


Abstract
For highly productive regions such as Germany, the increase of wheat grain yields observed throughout the 20th century is largely attributed to the progress in crop breeding and agronomic management. However, several studies indicate a strong variability of the genetic contribution across locations that further varies with experimental design and variety selection. It is therefore still unclear to which extent management conditions have promoted the realization of the breeding progress in Germany over the last 100+ years. We established a side-by-side cultivation experiment over two seasons (2014/2015 and 2015/2016) including 16 winter wheat varieties released in Germany between 1895 and 2007. The varieties were grown using 24 different long-term fertilization treatments established since 1904 (Dikopshof, Germany). Averaged over all cultivars and treatments mean yields of 6.88 t ha−1 and 5.15 t ha−1 were estimated in 2015 and 2016, respectively. A linear mixed effects analysis was performed to study the treatment-specific relation between grain yields and year of variety release. Results indicate a linear increase in grain yields ranging from 0.025 to 0.032 t ha−1 yr−1 (0.304 to 0.387% yr−1) in plots that were treated with combined synthetic-organic fertilizers without signs of a leveling-off. Yields from low or unfertilized plots do not show a significant progress in yield. Responsiveness of mean yields to fertilizer management increases with year of release and indicates small yield penalties under very low nutrient supply. Results highlight the need to consider the importance of long-term soil fertilization management for the realization of genetic gains and the value of long-term fertilization experiments to study interactions between genetic potential and management.
Export citation and abstract BibTeX RIS

Original content from this work may be used under the terms of the Creative Commons Attribution 3.0 licence. Any further distribution of this work must maintain attribution to the author(s) and the title of the work, journal citation and DOI.
1. Introduction
Grain yields of wheat considerably increased during the 20th century and more than half of the global wheat production areas still witness yield increases (Ray et al 2012, 2013, Iizumi et al 2014). Major time periods of this increase are associated with the 'Green Revolution', with the beginning generally dated to the 1960s, and the corresponding development of genetically improved wheat varieties (Evenson and Gollin 2003, Grassini et al 2013) in combination with improved agronomic practices (Khush 2001, Fischer 2009). Known as 'high yielding varieties', newer varieties are generally assumed to have a higher potential yield than those developed prior to the 'Green Revolution' (Evenson and Gollin 2003) with the potential yield defined as the expected yield in the absence of any biotic or abiotic stress using optimum agronomic management practices (Fischer 2015). Several studies indicated that modern varieties outyield older varieties under both, poor and optimal environmental conditions, with modern varieties responding more strongly to environmental improvements and increased fertilizer supply (Ortiz-Monasterio et al 1997, Calderini and Slafer 1999, De Vita and Maggio 2006, De Vita et al 2010). More specifically, the superiority of modern wheat varieties was attributed to changes in plant physiological traits and processes, such as plant height, harvest index, biomass, 1000 kernels weight, root growth, water soluble carbohydrate content of stems and leaf sheaths, stomatal conductance, growth rate, photosynthesis rate, modified source-sink-relations, water and nutrient use efficiency, and disease and stress resistance at the plant and/or at the canopy scale (reviewed in, e.g., Austin et al 1980, Calderini et al 1995, Reynolds et al 2009).
Most studies assessing the contribution of variety selection and breeding to changes in wheat grain yields are either based on unbalanced yield data obtained by testing varieties sequentially or on data originating from field trials with side-by-side cultivation of varieties released in different periods. Data derived from a side-by-side cultivation of different varieties under pest- and disease-controlled conditions are less affected by changes in other factors, such as climate or agronomic management, and therefore assumed to be well suited for a realistic estimation of the genetic trend component. However, analyzing unbalanced yield data obtained at variety trials or using national yield statistics allows for considering a higher number of data sets and, thus, might be more representative for regional and national yield progress rates. Recent statistical methods, such as mixed effects models, allow for deriving the genetic gain even from unbalanced data sets with cultivation conditions strongly changing over time (Smith et al 2005). Reported estimates of the relative genetic gain range from <0.2% to >1.5% yr−1 (tables S1, S2 and S3 are available online at stacks.iop.org/ERL/13/104003/mmedia). Discrepancies reflect differences in national and regional breeding programs (Slafer and Andrade 1991), time periods considered and are affected by the methods applied for calculating relative genetic gains. Thus, genetic progress estimates have to be interpreted with care. At single sites the number of management practices and environments that can be considered is limited. However, if assessing variety performance and genetic gains at multiple sites, results are nonlinearly affected by site-specific weather and management conditions during crop growth. Considering these uncertainties, it is still questionable, whether breeding has been the main factor for the increase in wheat grain yield. In this context, long-term fertilization experiments provide unique research sites where the performance of crop varieties can be evaluated under a range of highly differentiated soil nutrient equilibriums, however, located at a single site.
Winter wheat is the most important cereal crop in Germany and is grown on 54% of the cereal production area, which occupies about one third of the arable land. In 2015 and 2016 the average yield was 8.15 t ha–1 and 7.70 t ha−1, respectively (fresh weight at 14% moisture content, Statistisches Bundesamt 2017). Farmers have to take into account current and predicted changing environmental conditions, such as higher frequencies of drought, heat waves, or heavy rainfall events and face an increasing market volatility (Wiebe et al 2015, Macholdt and Honermeier 2017). Thus, beside grain yield, yield stability is of high importance, and, to farmers, variety choice is considered the most important management tool (Macholdt and Honermeier 2017). In a three-year study Ahlemeyer and Friedt (2011) tested 90 winter wheat varieties released in Germany between 1966 and 2007 and found an ongoing genetic gain in grain yield ranging between 0.034 and 0.038 t ha−1 yr−1. Using a series of trial data, Schuster (1997) calculated a genetic trend of 0.051 t ha−1 yr−1. More recently, based on farm and trial yield data dating back to the early 1980s, Laidig et al (2014, 2017) applied statistical models to dissect genetic and non-genetic trends in German winter wheat yields of varieties released between 1963 and 2012 (table S3). The authors calculated a genetic gain of 0.66 (low management intensity) to 1.16% yr−1 (high management intensity) (Laidig et al 2014), and from 0.63 (using trial and on-farm data) to 0.65% yr−1 (using trial data) (Laidig et al 2017). Yields were strongly affected by location (environment and management) and breeding was the most crucial factor for increasing yields under high management intensity, whereas non-genetic/agronomic factors were not significant due to a large year-to-year variation (Laidig et al 2014) or contributed 0.09% yr−1 (Laidig et al 2017). However, to the best of our knowledge, for Germany, studies on the contribution of the breeding progress on winter wheat grain yields based on parallel cultivation of multiple genotypes which have been released over a breeding period of more than a century, have not been published so far.
Here we present absolute and relative yield gains of 16 winter wheat varieties released in Germany between 1895 and 2007. We use a linear mixed effects model (see e.g. Gbur et al 2012) to analyze the relation between grain yield and the year of variety release. Results are considered as an indicator for the contribution of crop breeding and variety selection to changes in winter wheat grain yields in Germany during the last century. Different from previous research studies variety-specific yield data arise from 24 different fertilization regimes with a varying supply of nitrogen (N), phosphorus (P), potassium (K) and calcium (Ca) within a five-year crop rotation over a time period of 100+ years leading to big changes in soil fertility. We hypothesize that when wheat is grown under identical weather conditions and current agronomic management practices, the realization of the genetic gains depends on the long-term soil fertility management.
2. Material and methods
The long-term fertilization experiment 'Dikopshof' implemented in 1904 in West Germany near Cologne (50.8080222° N, 6.95295277° E, 62 m a.s.l.) forms the background of our experiment. The climate is characterized by an annual mean temperature of 10.5 °C and an annual precipitation of 688 mm. The soil is composed of humous, fine sandy loam developed from a 1 m loess layer and is known to be highly fertile due to high available water capacity and moderate to high P and K reserves related to the parent material. Wheat varieties are planted on plots that have been part of a five-year crop rotation cycle with a parallel growth of clover, potato (replacing oat since 1951), sugar beet, winter wheat and winter rye on five blocks until 2009. Using adequate levels of organic and synthetic fertilizers, yields have been linearly increasing since 1953, with rates exceeding 0.08 t ha−1 yr−1 for cereals and 0.3 and 0.2 t ha−1 yr−1 for sugar beet and potato fresh matter yields (Rueda-Ayala et al 2018). Absolute wheat yield levels increased from yield levels of ∼2 t ha−1 at the beginning of this century (data not shown) to ∼4 t ha−1 in the 1950s (Rueda-Ayala et al 2018) and to >10 t ha−1 at the beginning of this century. Since 2009 parallel growth was abandoned and a single crop is grown on all five blocks (maintaining the historic rotation and crop-specific fertilization rates). Blocks are subdivided in 24 different unreplicated fertilization treatments each measuring 18.5 × 15 m with different quantity of N, P, K and Ca supply (table 1) and an additional unknown N-supply by clover. For further details on the experiment we refer the reader to Rueda-Ayala et al (2018). After more than 100 years, the different plots are considered to be in a steady state nutrient equilibrium resulting from a constant long-term supply with synthetic base fertilizer, synthetic supplement fertilizer (s), animal manure (m) or a combination of both (m + s) and the omission or reduction of single nutrients (table 1). Soils are highly fertile and wheat yield levels of plots receiving maximum nutrient supply, such as TIDs 13, 15, 16 and 17 (see section 3), resemble yield levels reported by the Chamber of Agriculture North Rhine-Westphalia for variety trials on loess soils from 2014 to 2016 (Landwirtschaftskammer NRW 2017).
Table 1. Fertilizer (N = nitrogen, P = phosphorus, K = potassium, Ca = calcium) supply to winter wheat varieties (kg ha−1 yr−1) and for the complete 5 years crop rotation (kg ha−1) for the different treatments and corresponding treatment IDs (TIDs). Fertilizer source is given (m = animal manure, s = synthetic fertilizer). Note that TIDs 7–12 are supplied with purely synthetic fertilizers but at a lower rate than those with source = 's'. Animal manure is not supplied to winter wheat directly but to sugar beet, winter rye and potato crops within the 5 years crop rotation cycle at an average annual rate of 12 t ha−1. Bold = significant increase in grain yield with year of variety release (see table 3). Mean grain yields in 2015 and 2016 (averaged over all cultivars) are given.
| TID | Element | Source | N-P-K-Ca applied: 5 years crop rotationa | N-P-K-Ca applied: winter wheat | 2015 yield (t ha–1) | 2016 yield (t ha–1) |
|---|---|---|---|---|---|---|
| 13 | NPKCa | m + s | 530-287-1078-1293 | 120-31-116-0 | 10.442 | 6.347 |
| 14 | XPKCa | m + s | 240-287-1078-1293 | 0-31-116-0 | 7.332 | 4.712 |
| 15 | NXKCa | m + s | 530-132-1078-1293 | 120-0-116-0 | 9.808 | 7.110 |
| 16 | NPXCa | m + s | 530-287-498-1293 | 120-31-0-0 | 10.067 | 7.105 |
| 17 | NPKX | m + s | 530-287-1078-150 | 120-31-116-0 | 10.131 | 6.635 |
| 18 | XXXX | m + s | 240-132-498-150 | 0-0-0-0 | 5.967 | 4.391 |
| 1 | NPKCa | m | 380-221-829-1293 | 90-31-116-0 | 9.714 | 6.505 |
| 2 | XPKCa | m | 120-221-829-1293 | 0-31-116-0 | 5.778 | 3.744 |
| 3 | NXKCa | m | 380-66-829-1293 | 90-0-116-0 | 9.328 | 6.345 |
| 4 | NPXCa | m | 380-221-249-1293 | 90-31-0-0 | 9.091 | 6.806 |
| 5 | NPKX | m | 380-221-829-150 | 90-31-116-0 | 9.007 | 6.721 |
| 6 | XXXX | m | 120-66-249-150 | 0-0-0-0 | 3.212 | 3.553 |
| 19 | NPKCa | s | 380-221-829-1143 | 90-31-116-0 | 8.470 | 6.450 |
| 20 | XPKCa | s | 120-221-829-1143 | 0-31-116-0 | 3.954 | 2.523 |
| 21 | NXKCa | s | 380-66-829-1143 | 90-0-116-0 | 7.775 | 5.959 |
| 22 | NPXCa | s | 380-221-249-1143 | 90-31-0-0 | 7.885 | 6.217 |
| 23 | NPKX | s | 380-221-829-0 | 90-31-116-0 | 7.040 | 6.371 |
| 24 | XXXX | s | 120-66-249-0 | 0-0-0-0 | 3.296 | 2.440 |
| 7 | NPKCa | 230-155-580-1143 | 60-31-116-0 | 6.400 | 4.811 | |
| 8 | XPKCa | 0-155-580-1143 | 0-31-116-0 | 2.790 | 2.013 | |
| 9 | NXKCa | 230-0-580-1143 | 60-0-116-0 | 5.882 | 4.730 | |
| 10 | NPXCa | 230-155-0-1143 | 60-31-0-0 | 5.598 | 5.216 | |
| 11 | NPKX | 230-155-580-0 | 60-31-116 0 | 5.292 | 5.045 | |
| 12 | XXXX | 0-0-0-0 | 0-0-0-0 | 0.782 | 1.947 |
aClover, potato, sugar beet, winter wheat and winter rye (see section 2).
For this study, 16 winter wheat varieties released between 1895 and 2002 (figure 1, table 2) were grown on one of the five experimental blocks in harvest years 2015 and 2016. In terms of weather conditions, the year 2015 was slightly above average whereas 2016 was below average (see yield levels in table 2). The 24 fertilization treatments within this block were subdivided into 1.5 × 2 m (11 rows with half the row separation on both margins to account for edge effects) variety plots without replication. Distance between adjacent plots measured ∼50 cm (natural footpaths). Wheat was sown on 25 November 2014 and on 04 November 2015 using a randomized distribution of varieties to minimize edge effects resulting from the competition between varieties of different height (Austin and Blackwell 1980). Entire plots were harvested beginning of August in the following year. The preceding crop on the block used for this experiment in season 2013/2014 was sugar beet (Beta vulgaris L.) and in 2014/2015 winter wheat (Triticum aestivum L.). Plots were regularly treated with fungicides, pesticides and a growth regulating stem shortener (CCC) using recommended recent crop protection practices. Yields based on entire plot harvests are reported at a moisture content of 14%. Winter wheat plots received 116 kg K, 31 kg P and 60, 90 or 120 kg N ha−1 yr−1, except for those plots where single nutrients were omitted. For winter wheat manure (m) is not applied; however, for plot IDs 1–6 (m) and 13–18 (m + s) the long-term effect of manure supply within the crop rotation on soil properties has to be considered (table 1). Treatments 1–6 (m) and 19–24 (s) received similar amounts of N, P and K.

Figure 1. Grain yield (t ha–1, 14% moisture content) of winter wheat varieties released between 1895 and 2007 obtained in a variety experiment in 2015 (left panel) and 2016 (right panel) at the Dikopshof Research Site, Germany, under 24 different fertilization treatments (see table 1). Boxes indicate the 25th and 75th percentile with the median (thick black mark). Black dots indicate extreme values. Year of release is provided (see table 2 for variety names).
Download figure:
Standard image High-resolution imageTable 2. Mean (mean), minimum (min) and maximum (max) variety-specific winter wheat grain yield in 2015 and 2016 (t ha−1) obtained in a variety experiment at the Dikopshof Research Site, Germany. YoR = year of variety release. For maximum values the corresponding fertilization treatment is given (see table 1). S. Dickkopf = Strubes Dickkopf, K. Siegerl. = Kraffts Siegerländer, SG v. Stocken = Strubes General von Stocken.
| 2015 | 2016 | ||||||||
|---|---|---|---|---|---|---|---|---|---|
| Variety name | YoR | Mean | max | min | Mean | max | min | ||
| S. Dickkopf | 1895 | 6.210 | 9.395 | NPKCa m+s | 1.327 | 4.750 | 6.986 | NPXCa m+s | 1.906 |
| K. Siegerl. | 1908 | 5.727 | 8.208 | NPKX m+s | 1.449 | 4.260 | 6.218 | NXKCa m+s | 1.593 |
| SG v. Stocken | 1920 | 6.683 | 9.575 | NPKCa m+s | 1.230 | 4.738 | 6.875 | NXKCa m+s | 1.740 |
| Carstens V | 1921 | 6.720 | 10.159 | NPKX m+s | 0.607 | 5.064 | 7.370 | NPXCa m | 2.087 |
| Heines IV | 1940 | 6.046 | 9.071 | NPXCa m+s | 0.843 | 4.776 | 6.946 | NPKCa m | 1.897 |
| Heines VII | 1950 | 7.268 | 11.130 | NPKX m+s | 1.426 | 5.117 | 7.441 | NPXCa m | 1.993 |
| Jubilar | 1961 | 6.820 | 11.071 | NPKCa m+s | 0.721 | 5.422 | 8.456 | NPXCa m+s | 1.854 |
| Hanno, Anda | 1963 | 6.923 | 10.547 | NPXCa m+s | 0.630 | 5.153 | 7.287 | NPXCa m+s | 1.992 |
| Burgweizen | 1965 | 5.732 | 8.845 | NPXCa m+s | 0.049 | 4.715 | 7.140 | NPKX m | 1.694 |
| Carimulti | 1975 | 7.943 | 12.453 | NPKCa m+s | 0.167 | 5.802 | 8.224 | NPKX m | 1.780 |
| Okapi | 1978 | 7.542 | 12.666 | NPKCa m+s | 0.623 | 5.558 | 8.228 | NXKCa m+s | 1.909 |
| Sperber | 1982 | 7.002 | 11.326 | NPKCa m+s | 0.259 | 5.217 | 7.492 | NPXCa m+s | 2.003 |
| Greif | 1989 | 7.105 | 11.260 | NPKX m+s | 0.061 | 5.461 | 8.421 | NPKCa m | 1.802 |
| Tommi | 2002 | 7.772 | 11.880 | NPKX m+s | 1.277 | 5.806 | 9.321 | NXKCa m+s | 1.965 |
| Premio | 2007 | 7.657 | 12.659 | NPXCa m+s | 1.056 | 5.474 | 8.677 | NXKCa m+s | 2.141 |
| Average | 6.877 | 10.683 | 0.782 | 5.154 | 7.672 | 1.890 | |||
The non-parametric Mann–Kendall test was applied to test for the presence of a monotonic trend in grain yield over time. To quantify these trends, we performed a linear mixed effects analysis of the relation between grain yields and the year of variety release using the REstricted Maximum Likelihood method:
where yi,j,YOR is the observed yield (t ha−1) of the variety released in YoR for observation year i and fertilizer treatment j, α is the intercept, β1–β3 are the slope coefficients, T represents the fertilizer treatment, YoR the year of variety release, αi the random intercept and εi,j,YOR is the residual error with different variance for each T. YoR and fertilization treatment T were considered as interacting fixed effects. To account for the offset in grain yields caused by anomalies in weather conditions during the cultivation period the observation year was considered as a random effect (random intercept model). The model was fitted using the 'lme' function implemented in the 'nlme' package of the R statistical language (Pinheiro et al 2018). To obtain and to compare grain yield trends that depend on the interaction between YoR and the factor fertilization treatment we calculated the marginal means of linear trends by applying the 'emtrends' function implemented in the 'emmeans' R package (Lenth 2018) (R-code available on request).
We calculated the slope of the linear regression when the treatment-specific mean yield of each variety (averaged for 2015 and 2016 yields) is plotted against the treatment-specific yield across all varieties (Finlay and Wilkinson 1963, Bradshaw 1965, Sadras and Rebetzke 2013) and consider it as an indicator for the responsiveness of wheat varieties to different fertilization treatments and their tolerance of low nutrient levels. Large slope values indicate high responsiveness of a certain variety with respect to fertilization intensity and the corresponding soil environmental conditions.
3. Results
3.1. Grain yields
Grain yields across all plots ranged from 0.05 t ha−1 to 12.67 t ha−1 in 2015 and from 1.59 to 9.32 t ha–1 in 2016 (figure 1, table 2) with mean yields over all fertilizer treatments and varieties of 6.88 and 5.15 t ha−1 in 2015 and 2016, respectively. Notably the minimum yields in 2015 were lower (<2 t ha−1) and varied more strongly compared to 2016 yields (around 2 t ha−1). In 2015 maximum yields were achieved under maximum nutrient supply (TIDs 13, 16 and 17, see table 1 for TIDs) while in 2016 six varieties showed maximum yields under slightly reduced fertilization but additional manure supply (TIDs 1, 4 and 5) (table 2). Overall, newer varieties showed higher maximum yields compared with older varieties, in particular in 2015, but there was no trend in minimum yields (figure 1). The range of yields was mostly increasing with the year of release (figure 1), indicating a higher responsiveness of newer varieties to nutrient availability.
3.2. Relation between grain yields and YoR
A statistically significant yield progress ranged from 0.025 to 0.032 t ha−1 yr−1 (table 3). Using the treatment-means averaged over all varieties as reference values (100%) this change can be translated to an increase of 0.304–0.387% yr−1 (table 3).
Table 3. Presence of monotonic trends (Mann–Kendall Test) and change of the winter wheat grain yield (t ha−1 yr−1) resulting from the mixed effects analysis of the relation between grain yields and the year of variety release (1895–2007). Percent increase (% yr−1) was estimated using the treatment-averages (environmental means) as reference yield. Data were obtained in a two years comparative variety experiment (2015–2016) for 16 varieties and 24 different long-term fertilization treatments (Treatment, see table 1) at the Dikopshof Research Site, Germany. Significant trends in both years are indicated with bold typeface.
| TID | Treatment | Trend | t ha−1 yr−1 | % yr−1 |
|---|---|---|---|---|
| 13 | NPKCa m + s | yes | 0.032 | 0.387 |
| 14 | XPKCa m + s | yes | 0.009 | 0.152 |
| 15 | NXKCa m + s | yes | 0.029 | 0.344 |
| 16 | NPXCa m + s | yes | 0.027 | 0.311 |
| 17 | NPKX m + s | yes | 0.026 | 0.310 |
| 18 | XXXX m + s | no | 0.006 | 0.110 |
| 1 | NPKCa m | yes | 0.025 | 0.304 |
| 2 | XPKCa m | no | 0.005 | 0.099 |
| 3 | NXKCa m | yes | 0.022 | 0.278 |
| 4 | NPXCa m | yes | 0.018 | 0.223 |
| 5 | NPKX m | yes | 0.027 | 0.342 |
| 6 | XXXX m | no | 0.004 | 0.111 |
| 19 | NPKCa s | yes | 0.010 | 0.129 |
| 20 | XPKCa s | no | 0.003 | 0.100 |
| 21 | NXKCa s | no | 0.006 | 0.085 |
| 22 | NPXCa s | no | 0.009 | 0.133 |
| 23 | NPKX s | yes | 0.012 | 0.179 |
| 24 | XXXX s | no | 0.001 | 0.025 |
| 7 | NPKCa | yes | 0.008 | 0.141 |
| 8 | XPKCa | no | 0.002 | 0.093 |
| 9 | NXKCa | yes | 0.010 | 0.190 |
| 10 | NPXCa | yes | 0.005 | 0.100 |
| 11 | NPKX | no | 0.005 | 0.095 |
| 12 | XXXX | no | −0.002 | −0.177 |
Significance of the linear progress was limited to treatments with high levels of long-term nutrient supply that combine manure and synthetic supplements. Thus, fertilization treatment controlled gain estimates or prevented the expression of the improved genetic yield potential in the newer varieties. For plots treated with either manure (m, TIDs 1–6) or only synthetic fertilizers (TIDs 19–24 and TIDs 7–11) significance of the progress was dependent on the observation year (figure 2, table 3). Despite being treated with the same amount of N, P and K (see table 1) yield increase was more pronounced in plots treated with manure within the crop rotation than in plots that were only treated with synthetic fertilizers (table 3, figure 2).
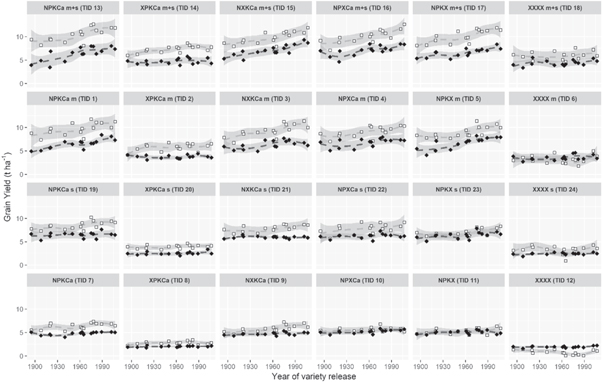
Figure 2. Grain yield (t ha−1) of winter wheat varieties released between 1895 and 2007 obtained in a variety experiment in 2015 (open white squares) and 2016 (black diamonds) at the Dikopshof Research Site, Germany, under 24 different fertilization treatments (see table 1 for TIDs). Dashed lines indicate locally weighted regression means (loess smoothing) of 2015 (gray) and 2016 (dark gray) data.
Download figure:
Standard image High-resolution imageIn summary, consistently significant (linear) trends in yields were found on plots that (I) regularly received all macronutrients (N, P, K) at a rate of at least 380-221-829 kg ha−1 yr−1 over five years and (II) received a long-term supply with animal manure (organic fertilizers) within the 5 years crop rotation containing 120-66-249 kg ha−1 yr−1 of N, P and K, respectively (TIDs 13, 15, 16, 17, 1 and 5, see table 1). Thus, 18 out of 24 long-term fertilizer treatments did not show consistently significant yield increase when grown in a side-by-side cultivation experiment. Five out of 11 treatments with significant trends in 2015 did no longer show significant trends in 2016; however, three treatments without significant trends in 2015 became significant in 2016 (data not shown).
3.3. Responsiveness to fertilization management
Newer varieties are characterized by a higher responsiveness to soil fertility levels resulting from long-term fertilization management than older varieties, as indicated by the steeper slope of the regression line of variety-specific yields over treatment-specific mean yields (figure 3). The higher responsiveness is associated with yield penalties below a mean yield of ∼3 t ha−1 (figure 3). Highest responsiveness and lowest tolerance of nutrient stress below mean yields of approximately 3 t ha−1 was estimated for Carimulti (YOR 1975) with a slope of 1.36, closely followed by the newest variety Premio (YOR 2007) with a slope of 1.31. Kraffts Siegerländer (YOR 1908) showed lowest responsiveness with a slope of 0.70.

Figure 3. Linear regression fit between the mean grain yield of each variety in each fertilization treatment (see table 1), and the mean yield across all varieties. Regression slopes are considered as an indicator for the responsiveness of varieties to long-term fertilization management and their tolerance of low nutrient supply. Data were obtained in a variety experiment (harvest years 2015 and 2016) at the Dikopshof Research Site, Germany.
Download figure:
Standard image High-resolution image
4. Discussion
Maximum yield levels of plots receiving high nutrient supply (TIDs 13, 15, 16 and 17) exceed 10 t ha−1 in 2015 and 8 t ha−1 in 2016 (table 2) and mean yield levels, even if averaged over all cultivars, 10 t ha−1 in 2015 and 7 t ha−1 in 2016 (table 1). These numbers resemble yield levels reported by the Chamber of Agriculture North Rhine-Westphalia for variety trials on loess soils for 2015 (10.4 t ha−1) and 2016 (8.58 t ha−1) (Landwirtschaftskammer NRW 2017) and provide evidence for the high soil fertility and the absence of nutrient stress in the treatments with high long-term nutrient supply. Thus, although plants are grown under rain-fed conditions and within small plots (see section 2) it can be assumed that on these plots the genetic progress in the yield potential was observed. Lower than average winter wheat yields were observed in 2016 in most regions in Germany and resulted from dry conditions during sowing, a mild winter and heavy precipitation events during spring and early summer.
Notably, at our site, unfertilized plots and those that have received low levels of nutrients for 100+ years had average grain yields of ∼2 to 5 t ha−1. Considering their long-term fertilization history without or with only small quantities of nitrogen, these yield levels can only be explained by the additional supply of nitrogen fixed by the clover crop in the crop rotation (see section 2) and atmospheric nitrogen input. Independent from the year of variety release, minimum yield values vary more strongly in 2015 than 2016 (table 2, figure 1). The most likely explanation are waterlogging effects resulting from strong rainfall events in winter 2014/2015 affecting seedling growth of all varieties. Strongest waterlogging effects during earlier phase of tillering were observed on TIDs 6 (XXXX m) and 12 (XXXX) leading to yield levels at the lower end of yields in 2015 (figure 1). Wheat is a species highly sensitive to waterlogging in the juvenile phase and there is some evidence for a lower waterlogging resistance of high yielding, modern varieties (Collaku and Harrison 2002, Dickin et al 2009). However, a systematic assessment of species-specific waterlogging would require a different experimental set-up.
Most importantly, varieties registered 100+ years ago, provide yields of up to 10 t ha−1 (at 14% moisture content) under the application of modern agricultural management practices (figure 1, table 2). These values greatly exceed yield values reported from the same varieties released and cultivated under management conditions 50+ years ago (Rueda-Ayala et al 2018). Rueda-Ayala et al (2018), using adjusted yield means for each of the ten varieties cultivated at our site between 1953 and 2009, found a yield progress of up to 0.105 t ha−1 yr−1. Thus, significant linear increase in the rates of realization of the genetic progress of 0.025 and 0.032 t ha–1 yr−1 estimated in this study (table 3) indicate that breeding for yield potential only contributed about one third to the realized yield progress in the highly fertilized treatments at our site. The agronomic (non-genetic) progress, including the control of lodging effects, the improved weed, disease and fertilizer management and the optimized timing of management applications might have been more relevant for increased yields at our site compared with the breeding progress. Despite randomizing variety plots in each year, the small plot size (see section 2), causing potential competition between species of different heights, adds uncertainty to yield levels. A relative increase in yields of tall varieties and a relative decrease of yields of adjacently growing small varieties would indicate that tall varieties have benefitted more strongly from competition (Austin and Blackwell 1980). Relating the spatial distribution of varieties (data not shown) to yield levels in 2015 and 2016 did not reveal a consistent pattern. This suggests a minor upward bias for yields from older (taller) cultivars. Providing an explanation for the large discrepancy between historic and current variety-yields was, however, beyond the aim of this study and would require further experiments.
Yield trends were significant and robust for plants grown on soils that have received N at a rate of at least 380 kg N ha−1 and that were regularly supplied with manure within a 5 years crop rotation (TIDs 13, 15, 16, 17, 1 and 5). Thus, up to a certain threshold, the lack of macronutrients, and in particular nitrogen, was reducing the expression of the genetic yield potential (table 3). Notably, maximum yields were not always observed at maximum fertilizer supply (table 2). Results indicate annual and variety-specific differences in the long-term fertilization treatment for maximizing yields. However, despite the use of growth regulators a minor degree of lodging of older (taller) cultivars was observed in 2016, and a contribution of lodging effects to lower yields despite higher nutrient supply cannot be ruled out. Since not the variety-specific maximum yield but their treatment-specific yields were used to study the genetic progress, this might have caused an upward bias in the genetic progress rates. Under long-term purely synthetic fertilizer supply or absolute omission of single macronutrients, the realization of the genetic gain was not significant and highly dependent on the annual conditions (table 3). Further, in both observation years, yield levels of most treatments receiving manure (TIDs 1–5, 'm') were consistently exceeding those of receiving purely synthetic fertilizer (TIDs 19–23, 's') despite similar contents of macronutrients (N, P, K, Ca). Notably, in 2015 the mean yield advantage of 'm'-treatments averages 1.6 t ha−1 and in 2016 0.5 t ha−1 (table 1). These results highlight the beneficial effects of organic fertilizer supplements with the slow release and corresponding enrichment and long-term availability of macro- and micronutrients (Edmeades 2003). Obviously, even on soils that are considered fertile, a substantial level of fertilizer amendments is required to find the breeding progress translated into increased grain yields. Contrastingly, if fertilizer inputs are low or omitted, newer varieties might perform worse than those released 100+ years ago (figure 3). In Germany major advances regarding the genetic improvement for grain yields have been the development of resistance against wheat rusts (Ahlemeyer and Friedt 2011) and the introduction of semi-dwarfing genes with the subsequent changes in the harvest index in the 1970s and 1980s. Plots where a significant gain in grain yields was estimated (TIDs 1, 5, 13, 15, 16, 17) indeed suggest a major change in potential yield levels of the varieties released in the late 1960 and early 1970s (figure 2). However, in summary, only plots treated with a combination of manure (m) and synthetic supplemental fertilizer (s) indicate an ongoing linear genetic gain without signs of an asymptotic upper limit.
While observing only one third of the rate of the historic yield increase in wheat grain yields at our side-by-side cultivation experiment, the rates of realized genetic progress in the treatments with high long-term nutrient supply are in line with those reported from other side-by-side cultivation experiments located in Western Europe (table S1). Ahlemeyer and Friedt (2011) reported genetic gains of 0.026 t ha−1 yr−1 (treated with fungicides) for German varieties (YoR 1966–2007), Austin et al (1989) a gain of 0.038 t ha−1 yr−1 for varieties in the UK, Cambride (YoR 1830–1986), Flor et al (2018) 0.026 t ha−1 yr−1 (0.4% yr−1 relative to the mean environmental yield) for varieties in the UK, Wales (YoR 1830–1986, spring wheat) and Brancourt-Hulmel et al (2003) 0.036 and 0.063 t ha−1 yr−1 for French varieties (YoR 1946–1992) under low and high input conditions, respectively. However, the yield increase rates in the treatments with no or low nutrient supply, are much lower and in most cases not significant, indicating that the realization of the genetic potential of the new wheat varieties requires adequate long-term nutrient supply. Relative rates of the realized genetic progress of 0.30%–0.39% yr−1 in this study are, however, low if compared to side-by-side cultivation experiments in Europe (table S1) and outside Europe (table S2). The interpretation of relative progress rates has to be handled with care and is not straightforward (Fischer 2015). In addition to the quantitative and qualitative differences in varieties, observation years and growing conditions (Austin et al 1989), relative genetic gains are affected by the method of calculation (see tables S1–S3 for examples found in the literature). The use of higher-yielding varieties (new varieties) as reference results in lower percent gains compared with the use of lower-yielding (older) varieties. Exemplarily, at our site, using the oldest variety as reference value (YoR 1895) leads to a maximum percent gain of 0.488% yr−1, as opposed to 0.338% yr−1 if using yields of the newest (YoR 2007) variety (data not shown). To minimize these effects and to facilitate a direct comparison of recent annual progress rates from different studies Fischer (2015) recommend the use of the newest variety as reference. However, either approach will be biased by the success or failure of single varieties under certain conditions, which is critical for studies comparing the performance of a specific set of varieties in different environments and under different management conditions. The mean environmental yield (in this study: average yield over all varieties in each treatment and year) allows for directly benchmarking calculated gains against gains estimated at similar environmental means (Sadras and Lawson 2011) and is more robust against the natural variability of yields and, thus, more suitable for our data.
More recently, statistical models have been applied to dissect genetic and non-genetic trends from trial and farm yield time series data (table S3) and for studying the causes and trends of national yield gaps. Genetic gains of >0.065 t ha−1 yr−1 reported for France (Oury et al 2012) and the UK (Mackay et al 2011), >0.056 t ha−1 yr−1 (>0.65% yr−1 relative to 1983 yield levels) for Germany (Laidig et al 2014, 2017) and >0.09 t ha−1 yr−1 for the Netherlands (Rijk et al 2013) exceed those reported from side-by-side cultivation experiments. Genetic gains estimated from side-by-side cultivation experiments are affected by the limited plot size, sampling errors and the limited range of environmental conditions and agronomic management practices available to maximize yields for each variety (Oury et al 2012, Fischer 2015). Using unbalanced yield data from large-scale trials or meta-analysis of a large number of field experiments allows for considering larger areas with a higher number of varieties and environments. However, corresponding statistical approaches have limited capabilities to account for site-specific conditions and are restricted by data availability, i.e. for varieties dating back to the beginning of the 20th century. They do not allow for an assessment of the effect of specific management factors, such as planting density, type of fertilizer (organic, mineral), fertilizer application rates and timing, application quantity and quality of fungicides and pesticides or stem shorteners which are crucial for the realization of the genetic gain as shown in this study. Contrastingly, side-by-side cultivation experiments allow for a direct control of these factors (e.g., fertilization) and, thus, for assessing the contribution of specific management practices to the realization of the breeding progress.
Responsiveness to long-term fertilization management and corresponding nutrient availability was much stronger for newer varieties compared to those registered prior to the 1970s (figure 3). These findings are in line with other studies (e.g., Ortiz-Monasterio et al 1997, Brancourt-Hulmel et al 2003, Sadras et al 2009, Mladenov et al 2011, Peltonen-Sainio et al 2011, Sadras and Rebetzke 2013, Grogan et al 2016, Wang et al 2017). Regression fits, however, indicate that the higher responsiveness is associated with yield penalties under low nutrient supply (figure 3). In other words, older varieties appear to be more tolerant to soil characteristics and nutrient deficiencies resulting from 100+ years of low fertilizer supply. Note that these results might not be generalized given the high uncertainty at low fertilization levels and the small experimental plot size. While studies agree on the higher responsiveness or 'phenotypic plasticity' of modern wheat varieties, yield penalties under sub-optimal conditions are debated. Differences between studies are likely a consequence of the selected combination of 'environments' and varieties (Sadras et al 2009). Considering the small size of the variety plots, the lack of replicates and the limited number of observation years, further studies are required to confirm our results. In general, at the Dikopshof site, a higher susceptibility of treatments with long-term low fertilizer input to the weed field horsetail (Equisetum arvense L.) has to be considered. Despite regular pesticide application horsetail growth is difficult to control since it multiplies through spores and a perennial underground rhizomatous stem system. Horsetail manifestation has also been reported from other long-term fertilization experiments (Glendining et al 1996). Because modern varieties have shorter stems and more erect leaves they are more strongly affected by weeds whereas tall, old varieties have a higher ability to suppress weed growth. This introduces an upward bias for the yield levels of old varieties on plots with horsetail manifestation and yield penalties for newer varieties. Estimated yield penalties at average grain yields below 3 t ha–1, as estimated in our study (figure 3), are of no practical relevance to most cropping systems in Germany. Nevertheless, challenged by the increasing need to balance system input and grain yields for a sustainable agriculture in the future, further studies on the realization of the breeding progress under a range of management intensities including low input systems in developing countries, are required (Brancourt-Hulmel et al 2003). At the same time, it is of high relevance that long-term fertilization experiments, such as the Dikopshof, are recognized in their role as unique research sites where modern and historic varieties can be linked and evaluated under well-established fertilization treatments.
Results from this study illustrate the interacting impact of environmental and management conditions on genetic gain estimates. The definition of optimum or most favorable management conditions, in this study represented by different fertilization treatments, varies with year (e.g., this study) and with variety (Oury et al 2012). This is of high importance, since, in consequence, a reference management for quantifying the breeding progress is generally lacking and varies with trial year, location and corresponding assumptions on best management practices. In consequence, differences in nutrient availability and management factors question the direct comparison of genetic gain estimates from different sites and, thus, require a more explicit consideration. Commonly, effects of nutrient supply on genetic gains are studied by a short-term addition or reduction of nutrients. Different from such studies, the background of our experiment, a fertilization experiment established 100+ years ago, allows for studying the breeding progress on plots with strongly differentiated soil chemical, physical and biological properties that result from different long-term fertilizer application rates. We suggest that such experimental sites are highly useful for studying the genetic gain of crop varieties under consideration of different fertilization environments (but consistent weather conditions and management practices) and thus should be continued.
5. Conclusions
Under current agricultural management practices grain yields of selected winter wheat varieties registered in Germany 100+ years ago greatly exceed historic yields. Nevertheless, for a breeding period of more than a century, varieties indicate a linear and still ongoing genetic gain under adequate nutrient supply. However, in treatments with low or no long-term nutrient supply, the genetic progress in the modern varieties is not realized. At the same time a higher responsiveness of selected modern varieties appears to be associated with small yield penalties on plots with very low soil fertility. The 'optimum' treatment varies with annual growth conditions and variety. In consequence, the establishment of a reference fertilizer treatment to quantify genetic gains and a generalization of quantitative estimates from Dikopshof and other sites must be done with care. This does however not reduce the unique value of such long-term fertilization experiments for assessing genetic gains in crop yield in highly differentiated soil environments.
Acknowledgments
We are very thankful to all station directors, technicians, field assistants and researchers who maintained the Long-Term Fertilization Experiment at the Dikopshof research station since the beginning of the experiment in 1904. We acknowledge the assistance of the IPK Gatersleben for providing seeds of some of the historic wheat varieties.