

Abstract
Many studies on drought consider precipitation and potential evapotranspiration (PET) impacts. However, catchment water retention is a factor affecting the interception of precipitation and slowing down runoff which also plays a critical role in determining the risks of hydrological drought. The Budyko framework links retention to the partitioning of precipitation into runoff or evapotranspiration. Applied worldwide, we demonstrate that retention changes are the dominant contribution to measured runoff changes in 21 of 33 major catchments. Similarly, assessing climate simulations for the historical period suggests that models substantially underestimate observed runoff changes due to unrepresented water management processes. Climate models show that water retention (without direct water management) generally decreases by the end of the 21st century, except in dry central Asia and northwestern China. Such decreases raise runoff, mainly driven by precipitation intensity increases (RCP4.5 scenario) and additionally by CO2-induced stomata closure (RCP8.5). This mitigates runoff deficits (generally from raised PET under warming) by increasing global mean runoff from −2.77 mm yr−1 to +3.81 mm yr−1 (RCP4.5), and −6.98 mm yr−1 to +5.11 mm yr−1 (RCP8.5).
Export citation and abstract BibTeX RIS

Original content from this work may be used under the terms of the Creative Commons Attribution 3.0 licence. Any further distribution of this work must maintain attribution to the author(s) and the title of the work, journal citation and DOI.
1. Introduction
There is compelling evidence that climate change has profound impacts on regional and global hydrological cycles (Huntington 2006, Piao et al 2007). Reconstructions of global river runoff show that one-third of the 200 largest rivers have significantly changed flows since the 1950s. More of these rivers experienced a runoff decrease rather than an increase, in an approximate ratio of 3:1 (Dai et al 2009). Due to the uncertainty of regional climate changes, however, no consistent conclusion is reached on the trend of the global mean runoff (Labat et al 2004, Milliman et al 2008, Dai et al 2009). In contrast, a majority of Earth System Model (ESM) projections from the Coupled Model Intercomparison Project Phase 5 (CMIP5) show an increase in global runoff for the future. This is particularly true for the high latitudes and humid tropics, while models predict that rivers in most dry tropical regions may experience reduced runoff (Cisneros et al 2014, Prudhomme et al 2014). Understanding the mechanisms that control changes in contemporary runoff is essential for constraining climate model projections, alongside the identification of any missing or poorly represented processes in climate models. The strong predictive capability of models is needed to help with decision-making to ensure sustainable future water resource management (Oki and Kanae 2006, Hall et al 2014).
ESMs capture processes to high accuracy through fine resolution discretization of responses in both time and space. However, their complexity can make them difficult to fully understand. It can also prevent characterization of their broad hydrological behaviours. Here we tackle the complexity challenge of ESMs by applying a well-established, conceptualized, and 'lumped parameter' Budyko framework to describe river flow measurements, along with ESM flow estimates for now and projecting the future. We do this to generate a far better overall understanding of the factors that contribute to historical and future runoff changes.
Our first objective is to quantify the contributions of change in runoff from precipitation amount (P), potential evapotranspiration (PET), and land surface characteristics. Here PET is derived from the Penman-Monteith equation (Shuttleworth 1993). Changes in land surface characteristics in particular alter terrestrial water retention capability, which in turn strongly influences the partitioning of precipitation into evapotranspiration and runoff. We place an initial emphasis on determining the water retention capability for historical measurement-based runoff changes. To achieve this, we use the Budyko framework (Budyko 1958, 1974). Although established six decades ago, the Budyko framework is still successfully used to explain and predict the variability of the terrestrial hydrological cycle and the associated runoff (Roderick et al 2014, Zhou et al 2015, Zhang et al 2016). We then also map this framework on to CMIP5 model outputs, to better understand the factors that control ESM projections of future runoff changes. Some recent studies (Sheffield and Wood 2008, Greve et al 2014, Zhao and Dai 2015) project that future potential evapotranspiration increases will dominate over raised precipitation amounts, leading to enhanced soil water deficits known as agricultural drought for many regions. Those studies were based on drivers of changing moisture supply (P) and demand (PET) only. Here we explore the potential for hydrological drought, which is associated with runoff deficits. Hydrological drought differs from agricultural drought, being additionally strongly dependent on the specific properties of catchments to retain precipitation and partition it to evapotranspiration and runoff. High retention implies less water lost by runoff in rivers and more water recycled to the atmosphere by evapotranspiration.
Water retention capability in a catchment can be diagnosed by a parameter n in the Budyko framework. The value of n is a simple parameterization, yet it is known to be effective at capturing many complex features of catchment properties in a combined way. Such features include vegetation properties (cover, structure, rooting depth, and water use efficiency), physical characteristics (soil water holding capacity, topography and stream density), and climate patterns (temporal and spatial distribution of rainfall) (Donohue et al 2007, Roderick and Farquhar 2011, Li et al 2013). For a given catchment, natural physical properties usually remain static over hundreds of years or more. However, vegetation transpiration is responsive to climate and CO2 change through impacts on leaf area and leaf physiology (Ito and Inatomi 2012, Zhu et al 2016). In particular, CO2-induced physiological changes (via stomatal closure) and structural changes (via vegetation cover) in vegetation are two key factors influencing n. Additionally, not only the amount but also the intensity and seasonality of rainfall are expected to change in a warmer climate (Chou et al 2013, Westra et al 2013). More intense rainfall events will raise runoff if infiltration capacity is exceeded (Xue and Gavin 2008). And changes in seasonal precipitation magnitude, timing and duration altering the timing of plant activities will also impact evaporative losses (Feng et al 2013). Lastly, changes in retention also occur through the direct management of catchments, for example by wetlands drainage, river channeling, damming and water withdrawals for irrigation and other purposes. The sum of these processes can be diagnosed by varying water retention, in historical data.
Our second objective is to make a direct comparison between observed and multi-models' simulated changes in runoff for the recent historical period. We propose here a new application of the Budyko framework to diagnose how changing environmental factors affect runoff in both measurements and ESMs estimates over recent decades, and thus facilitating comparison. This approach also illustrates whether there are any additional potential drivers of land surface water retention changes that are not presently included or properly parameterized in climate models.
Our third objective is to quantify the separate driving factors of future changes in water retention, as determined in the future scenario projections of CMIP5 ESMs. Recent modeling analyses demonstrate that future plant physiology responses to rising CO2 will significantly increase runoff (Gedney et al 2006, Betts et al 2007, Swann et al 2016), overtaking and offsetting the influence of increased vegetation cover due to CO2-induced plant fertilisation. The most recent study was based on a conceptual scenario of 1% per year cumulative increase in atmospheric CO2 concentrations, reaching 1140 ppm after 140 years (Swann et al 2016). Here we extend that analysis, using CMIP5-based projections under different future scenarios of raised atmospheric greenhouse gas concentrations (known as Representative Concentration pathways, or RCPs).
2. Methods
The Budyko framework (Budyko 1958, 1974) is based on verified empirical relationships between the evaporative index (ET/P) and the aridity index (PET/P). We use the measured runoff (Q, mm yr−1), observation-based precipitation (P, mm yr−1) and Penman-Monteith potential evapotranspiration (PET, mm yr−1) to estimate parameter n of the Choudhury-Yang formulation of Budyko framework (Choudhury 1999, Yang et al 2008):

Annual mean evapotranspiration (ET, mm yr−1) is calculated as the measured precipitation P minus runoff Q. Together six P and two PET data result in 12 combinations of data for the 1981–2005 period. Datasets are described in the supplementary material. With the quantities of P, ET, and PET available, we estimate parameter n for each 5-year period of a 25-year period (i.e. 1981–2005). Next, we estimate trends in the n-parameter, P, Q, ET, and PET using a least-squares 2-parameter linear regression (Y = At + B, where t is time in years). We then multiply these fitted linear trends (i.e. A) with 25 years to estimate the full change during the period of 1981–2005. Furthermore, we separate the contributions of P, PET and n-parameter changes to the measured runoff changes for the same period 1981–2005 (see below).
For the model-based analysis, we instead use simulated P, ET, along with derived PET from ten individual CMIP5 models. We use these to create their ensemble mean, CMIP5-EM, to estimate the n-parameter. We again consider the contributions of the ESM-based precipitation amount, PET, and n-parameter on runoff changes for the recent historical past. This allows direct comparison against our analysis of measurements. Similarly, we separate the contributions of future changes in precipitation amount, PET and n-parameter to the projected changes in runoff, from 1981–2005 to 2076–2100.
We use the first-order Taylor expansion of Choudhury-Yang equation to quantify the direct contributions of precipitation amount, PET, and n-parameter changes to runoff changes. The change in ET is:

These partial differentials are then found by differentiation of equation (1), giving:


Over the multi-year timescale, changes in water storage are small relative to the magnitude of fluxes (i.e. P, Q, ET) (Roderick and Farquhar 2011). Assuming steady state conditions of the water balance, changes in runoff can be separated into three components: precipitation amount (ΔQP), potential evapotranspiration (ΔQPET), and catchment properties (ΔQn), which is written as:
A note on terminology is made at this point as the name 'retention' has the potential to be confused with storage. The changes of 'retention' are reflected by variations in the n parameter in the Budyko framework. The raised retention over short timescales (i.e. annual) might slow down the transition of rainfall, making it more amenable to evaporation either naturally or via irrigation. Any remaining water is passed to river systems and hence in general the assumption of negligible storage change is reasonable, especially when averaging at the long-term timescales (i.e. multi-year period). For retention changes, however, although short-term, their effects are present throughout the year. Hence at the longer timescales, retention does impact on the overall partitioning of rainfall.
In addition, we investigate the dominant factors driving future changes in n-parameter itself. Three ESM outputs are analyzed in relation to Δn: vegetation structure measured by changes in leaf area index (ΔLAI); plant water use measured by changes in transpiration per leaf area (Δ[Tr/LAI]); and the daily precipitation intensity (ΔSDII; Hartmann et al 2013). Because changes in n-parameter are spatially correlated (according to the Moran's I index), that is, n-parameter changes over one grid cell not only depend on the local explanatory variable but also n-parameter changes over the adjacent grid cells. Thus, we apply a conditional autoregressive (CAR) model (a form of spatial lag model) to identify the dominant driving factors for Δn. This CAR model is used to remove any confounding effects of spatial autocorrelations between grid cells. The dependent variable is Δn and independent variables are ΔLAI, Δ[Tr/LAI], ΔSDII:
We achieve this by spatial regression for twenty-five 1° × 1° grid cells within each spatial window of 5° × 5°. This gives the local regression coefficients a, b, and c for each 5° × 5° spatial window. Then, the factor (ΔnLAI, Δn[Tr/LAI] or ΔnSDII) whose absolute value makes the largest contribution to changes in water retention capability, Δn, is regarded as the dominant driving factor.
3. Results
3.1. Historical changes in water retention capability
The analytical form of Choudhury-Yang formulation of Budyko framework (equation (1)) used here contains a parameter n reflecting catchment water retention capability. Figure 1(a) shows the change in water retention capability (Δn) for 33 river basins during the period of 1981–2005. During this period, wet large catchments (i.e. Congo, Amazon, Mississippi, Yukon, Mackenzie, Volga and Yenisey basins) generally show decreases in n, indicating water retention capability in these basins has declined. That is the fraction of P lost by evapotranspiration decreased and instead runoff increased. In contrast, the values of n are found to increase dramatically in dry basins such as the Murray, Colorado, Yellow River and three river catchments in the southern Africa (figures 1(a) and S1 is available online at stacks.iop.org/ERL/13/094019/mmedia).
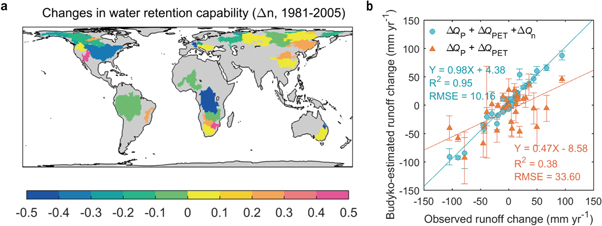
Figure 1. Historical retention changes and historical runoff changes due to the three contributions of ΔP, ΔPET, and Δn. (a) A map of 33 major basins (coloured, non-grey) and their water retention capability changes, from 1981 to 2005, as characterised by changes in parameter n of the Budyko framework. Grey land areas are omitted from the analysis because insufficient runoff observations are available. (b) Comparison of runoff change (ΔQ) measured at gauging stations versus ΔQ estimated by the Budyko framework, with change in precipitation amount and PET (orange) only, or with all three factors of change (i.e. precipitation amount, PET, and additionally water retention capability; blue).
Download figure:
Standard image High-resolution imageDespite the simplicity of the Budyko framework, the observed magnitude and spatial variability of runoff changes can be well reproduced by this theoretical framework. Using measurement-based values of P, PET along with our fitted time dependent n values to estimate runoff, we obtain a small RMSE of 10.2 mm yr−1 (figure 1(b), blue dots) against annual runoff measurements. This good fit of the sum of Budyko-estimated components (i.e. ∆QP + ∆QPET + ∆Qn; equations (3a)–(3c)) against measured runoff is in part expected, as the components use the fitted n values. However, such linearization in to the separate components does allow an assessment of the individual contributions to total changes in runoff. If we consider ∆QP + ∆QPET only, we just capture 38% of spatial variability in observational changes in runoff (RMSE = 30.6 mm yr−1; figure 1(b), orange dots). This illustrates the impact on runoff projections of neglecting changes in parameter-n, which some earlier studies have done. That is, we verify that this new part, ∆Qn, is an important contributor to recent runoff changes. We analyze this further by a first-order linear Taylor series expansion of equation (1) to separate the direct impacts of P, PET and n changes on runoff changes in the recent past (ΔQP, ΔQPET and ΔQn respectively). Figure 2 illustrates that 11 out of 33 catchments (e.g. Fitzroy, Congo, Mississippi, St Lawrence, Rhine) experienced decreases in precipitation amount or increases in PET over the period 1981–2005, both acting to reduce runoff. However, the component data shown in figure 2 also illustrate that for these catchments, changes in water retention had the opposite effect to increase runoff markedly, making overall runoff changes positive (see also table S1). Figure 2 thus shows that the effect of decreased n is in general to mitigate the P- or PET-induced reduction in river runoff. Our result confirms the dominant contribution of water retention capability changes on runoff changes in 21 out of 33 major catchments (table S1). This also explains the large difference that can occur when this effect is prevented from changing in flow estimates (figure 1(b)).
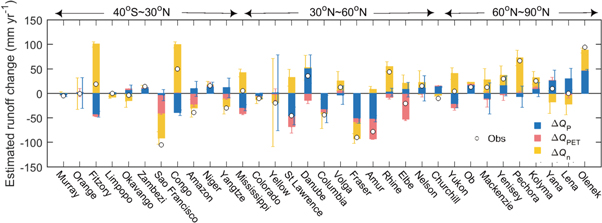
Figure 2. The contributions of the individual changes in precipitation amount (ΔQP; blue), PET (ΔQPET; red), and water retention capability (ΔQn; yellow) to overall changes in runoff. The observed runoff changes measured at gauging stations are marked as white dots. The basins are sorted (as named on horizontal axis) according to the latitudes of the gauge stations closest to the estuary, from 40 °S to 90 °N. The location of each basin is indicated in figure S1. Error bars in (b) and (c) represent the ±1 standard deviation of estimates from 12 data combinations.
Download figure:
Standard image High-resolution imageThe inferred decreases in water retention capability may be partly related to plant physiological stomatal response to rising atmospheric CO2 concentration and vapour pressure deficit, both leading to a higher fraction of P converted to runoff. In one study, there is strong detectable evidence that rising CO2 concentration leads to reduced opening of stomata, which in turn is associated with lower leaf-level transpiration and higher runoff (Gedney et al 2006). In addition, land use change with the replacement of forest by short vegetation, which has less transpiration ability, may also explain some runoff increases diagnosed by the decrease of n. This may be expected to apply in the Congo Basin, where extensive deforestation has occurred (Duveiller et al 2008). In contrast to the tropical regions, decreased runoff in the temperate catchments such as the Yellow River may be partly attributed to recent afforestation, reflected by an increase of n. This will induce an increase in evapotranspiration, and in rainfall interception loss (Yang et al 2009, Feng et al 2016). Additionally, direct physical engineering of the terrestrial hydrological system (e.g. dam construction, reservoir building and river channeling) and agricultural management (e.g. irrigation and terraces) also lead to a significant change in n, and thus alter runoff (Jaramillo and Destouni 2015). Such water management can act to either decrease n and facilitate runoff (wetland suppression, river channeling), or to increase n and reduce runoff (evaporation from dams, and re-use of stream water for irrigation).
3.2. Comparison of model versus measurement for historical period
Here we apply the same Budyko-based attribution of runoff changes to P, PET and n changes. These are simulated by ten state-of-the-art ESMs from the CMIP5 database (Methods, section S3). The estimate of changes to historical runoff amounts, and using the Ensemble Mean of these CMIP5 models (CMIP5-EM), are shown in figure 3(a). Such estimates based on CMIP5-EM in general project lower values of runoff change (i.e ΔQ). We compare differences in the Taylor series-based individual components ΔQP, ΔQPET and ΔQn value, and between CMIP5-EM and measurements in figures 3(b)–(d). Values also in table 1 (standard deviations across catchments). Magnitudes of ΔQP for CMIP5-EM are in general smaller than those from measurements (figure 3(b)). This arises in part due to ESMs differing markedly from observations for precipitation estimates. This even includes the signs of these changes in some regions (Knutti and Sedláček 2012, Flato et al 2013), which will balance to suppress mean CMIP5-EM estimates. Other suppression of changes in CMIP5-EM is also due to decadal timescale precipitation fluctuations, which reflects natural variability caused by the chaotic nature of large-scale atmospheric circulations and unforced variance in the coupled land-ocean-atmosphere system (Deser et al 2012). Random internal variations in PET are smaller, and there is better agreement for ΔQPET between model and measurement-based values (figure 3(c)).

Figure 3. Comparisons between measurements and model outputs of runoff features for the historical period. (a) Similar to figure 1(c), except that the water flux components (i.e. runoff, precipitation and ET) are estimated by the model ensemble mean (CMIP5-EM). The observed runoff changes measured at gauging stations are marked as white dots, hence identical values to figure 1(c). Catchment names as labelled. (b)–(d) Model and measurement-based separated contributions of (b) precipitation amount (ΔQP), (c) PET (ΔQPET), and (d) water retention capability (ΔQn) to historical changes in runoff, from 1981 to 2005. Horizontal error bars represent one standard deviation of the ten CMIP5 individual ESM estimates. Vertical error bars represent the ±1 standard deviation of estimates from 12 data combinations.
Download figure:
Standard image High-resolution imageTable 1. Standard deviations (SDs) of ΔQP, ΔQPET, ΔQn across catchments. The individual catchment values are based on the changes in P, PET and n from both measurements and model ensemble mean (CMIP5-EM). The 'Data' values below are the standard deviations of the histogram columns in figure 2, for the three quantities. The 'CMIP5-EM' values are the standard deviations of the histogram columns in figure 4(a), again for the three quantities.
| SD (mm yr−1) | ΔQP | ΔQPET | ΔQn |
|---|---|---|---|
| Data | 25.2 | 13.6 | 33.9 |
| CMIP5-EM | 21.0 | 11.7 | 9.3 |
For runoff changes attributable to retention, figure 3(d) shows a severe underestimation of ΔQn change magnitudes (both positive and negative) by ESMs, compared to measurements during the historical period. We conjecture that in the instances where ESMs fail to capture the observed decreases in ΔQn, it is a consequence of missing components of physical engineering and water management in the models. This is despite most ESMs having some representation of land use change. Besides physical changes, these alterations to the land surface may increase ET (for instance re-use of stream water in irrigation water and dam evaporation) which will also decrease ΔQn i.e. raise retention. In instances where ΔQn increases in data, but not in models (figure 2(d)), then this may be due to the omissions of channeling of small streams, wetland and riparian area suppression, and of some land management practices (e.g. no crop cover in winter). All these actions may increase runoff, i.e. raise ΔQn increase by lowering retention.
We formalize the impact of these missing ΔQn components in a simple statistic. We calculate an overall standard deviation across catchments (SD; mm yr−1) with data values from table 1 as  (this statistic assumes independence between components in the Budyko framework). In order to estimate the effect of model underestimation of inter-catchment variability in 'n-induced' runoff changes, we then recalculate an overall SD statistic, but instead replace ΔQn with the CMIP5-EM based value (replacing 33.9 with 9.3; table 1). This then gives a new overall SD (i.e. σD,n). The two values allow us to represent, as a percentage, the effect on runoff of missing water managements processes on modelled water retention changes, returning a value of underestimation as:
  This value quantifies the extent to which CMIP5 models lack the representation of physical engineering processes and water management impacts on observed spread of runoff changes observed across catchments. This is a severe limitation to the proper evaluation of models with observed runoff changes, except in catchments with minimum human intervention.
3.3. Future projections
Although there are noted deficiencies of ESMs depiction of retention, compared to measurements, due to their non-representation of water management processes, we can still explore future water retention changes within the CMIP5 model ensemble. These changes in n reflect rising atmospheric CO2 concentrations, changing imposed climate, varying vegetation distribution and its water use, along with land use change. We again do this via analysis of the ensemble mean of the CMIP5 models (CMIP5-EM), but here to analyze future runoff changes (we additionally provide individual model estimates in the SI). Figure 4(a) shows the estimated annual runoff change from CMIP5-EM by the end of this century under the RCP4.5 scenario, relative to the recent historical past (1981–2005). The increase in runoff mainly occurs in the Arctic region, northeastern China, South Asia, and North Africa, while the Amazon region, western and southern Africa, the United States, southern Europe, and central Asia experience decreased runoff (by −20 mm yr−1 or more; figure 4(a)). Similar patterns for runoff changes occur under the more intensive RCP8.5 scenario across most regions (figure S2(a)). As for the analysis of historical measurements, the heterogeneity in future runoff change is successfully captured by the Budyko framework. The Taylor series expansion of the Choudhury-Yang equation allows the separation of runoff changes into precipitation amount, PET, and water retention capability driven components. These sum up to the total future runoff changes (similarities of figures 4(a) versus 4(b), and also S2(a) versus S2(b)).

Figure 4. The contributions of precipitation amount, PET, and n to future runoff changes. Spatial patterns of (a) future runoff changes (ΔQ) projected by the model ensemble mean (CMIP5-EM) for the period 2076–2100 relative to 1981–2005 and under RCP4.5 scenario; (b) future runoff change estimated by the Budyko framework with the change in precipitation amount, PET, and water retention capability (ΔQP + ΔQPET + ΔQn), fitted to CMIP5-EM, same period and scenario. Separated contributions of these components to runoff changes, based on Budyko framework, and shown as (c) precipitation amount (ΔQP), (d) PET (ΔQPET), (e) both precipitation amount and PET (ΔQP + ΔQPET), and (f) water retention capability (ΔQn). Dots indicate where more than 80% of individual climate models show agreement on the direction of runoff changes (also shown in the supplementary information, figure S3). The grey areas have insufficient data.
Download figure:
Standard image High-resolution imageIn figure 4(c), the future precipitation amount generally increases, leading to an increase in runoff. This is for most regions (more than 65.4% of land surface). Decreases in P-induced runoff only can be found in Central America, southeastern Amazon, southern Europe, Australia and southern Africa. Driven by rising temperatures, PET consistently increases across all the land surface (Scheff and Frierson 2014), resulting in a negative runoff change component (figure 4(d)). This cancels out the upward effect on runoff of increases in the precipitation amount in temperate North America, southern China, western Africa, and the northwestern Amazon region (figure 4(e)). For retention changes, represented in the 'n-parameter', we find in general reduced values of that parameter, contributing to increased runoff (i.e. ΔQn) values. This n-induced increase is projected over much of the globe, particularly in most parts of South America, large parts of central and southern Africa, the eastern part of North America, southeast China, and eastern Siberia (figure 4(f)). In these regions, the increase in runoff associated with decreased n is generally larger than +20 mm yr−1 (figure 4(f)). However, there are regions where n-driven future runoff change is negative, including dry central Asia and northwest China. Critically, over much of the globe, future projections show that the changes in ΔQn are of similar order of magnitude to ΔQP and ΔQPET (figure 4). When assessing individual models, rather than the ensemble mean, we find that the inter-model contributions from changes in PET and water retention capability on runoff show relatively high consistency. However, models disagree on the contributions of precipitation amount (figures S3 and S4).
Overall the CMIP5-EM shows that the area projected to experience decreasing runoff under RCP4.5 scenario, when only considering the effects of precipitation amount and PET, is 47.6% of the land surface. However, when the additional effect of water retention change is included, i.e. with all factors changing, the area experiencing decreasing runoff reduces to 41.3% of land surface. At the global scale, mean runoff change associated only with changes in precipitation amount and PET is a decrease of −2.77 mm yr−1. This is of opposite sign to the runoff change when all factors of change are included, which then gives an increase of +3.81 mm yr−1. RCP8.5 scenario also shows a similar result. Under that scenario, the estimated global runoff associated with changes in precipitation amount and PET only is a decrease by −6.98 mm yr−1. When all factors including water retention changes are considered, the estimated global runoff is an increase of +5.11 mm yr−1.
3.4. Drivers of future change in water retention
The importance of retention changes in projecting runoff has been established. We now identify and explore a range of complex processes in ESMs that contribute to driving estimated future retention changes. We plot changes in n (i.e. Δn) during the 21st century for the RCP4.5 scenario (figure 5(a)). The Δn values exhibit substantial spatial heterogeneity of change, and as expected have similarities to ΔQn of figure 4(f). The increases in n associated with reduced ΔQn are found in some dry regions, while decreases in n appear in many other regions. The latter (i.e. lower retention n) dominates, covering more than 65.4% of land surface. These regions include wet tropical catchments, eastern North America, high-latitude Eurasia, and southeastern China. Similar spatial patterns of change in n are also found under RCP8.5 scenario (figure 5(b)). When forced with the more intensive warming scenario (i.e. RCP8.5), as expected the magnitude of Δn is larger compared to RCP4.5 scenario (figure 5(a)). Although there is general agreement, Δn diagnosed from individual ESMs shows a strong divergence in the high northern latitudes under RCP8.5 scenario (figure S6).

Figure 5. Future changes in water retention Δn and its dominant factors. (a) Spatial pattern of the changes in water retention capability (Δn) for the period 2076–2100 relative to 1981–2005, based on projections by the model ensemble mean (CMIP5-EM) and under RCP4.5 scenario. Dots indicate where more than 80% of individual climate models show agreement on the direction of change in water retention capability (also shown in the supplementary information, figure S5). (b) Same as (a) but under RCP8.5 scenario. (c) Spatial pattern of dominant driving factors of the change in water retention capability from the CMIP5-EM under RCP4.5 scenario. The driving factors considered are leaf area index (ΔLAI), the transpiration per unit leaf area (Δ[Tr/LAI]) and precipitation intensity (ΔSDII). (d) Same as (c) but under RCP8.5 scenario. In (c) and (d), different colours differentiate whether the dominant driver is contributing to either a positive or negative change in quantity n.
Download figure:
Standard image High-resolution image
Three ESM outputs are analyzed in relation to Δn: changes in leaf area index (ΔLAI); changes in transpiration per leaf area (Δ[Tr/LAI]); and changes in the daily intensity index ΔSDII (Hartmann et al 2013). SDII is designed to capture the situation where rainfall intensity is such that it exceeds infiltration capacity, increasing runoff. We find that in the dry mid-latitude regions, the water retention increases (Δn > 0) are mainly due to increased LAI for both RCP4.5 and RCP8.5 scenario (figures 5(c) and (d)). Higher atmospheric CO2 levels lead to increased photosynthetic rate, thereby increased LAI, which raises transpiration and reduces runoff. A more complex situation emerges where Δn is negative, causing raised runoff. In figure 5(c), negative Δn change is mostly driven by precipitation intensity increases under RCP4.5 scenario (see also figure S8(d)). However, decreases in [Tr/LAI] instead dominate n decreases under RCP8.5 scenario (figure 5(d)), particularly in tropical regions, northeast China, and part of the central North America (see also figure S8(g)). This finding of a switch in dominant driver between emission scenarios for year 2100 also exists in many individual climate models (figures S9 and S10).
We further consider the climate scenario dependence for the dominant driving factors of Δn between RCP4.5 and RCP8.5 (figures 5(c) versus 5(d); figures S9 versus S10). It was previously reported (e.g. Gedney et al 2006, Milly and Dunne 2016, Swann et al 2016) that the reduction of stomata opening due to elevated atmospheric CO2 concentration or changing climate (e.g. increased vapor pressure deficit) will impact transpiration and thereby alter runoff. However, our finding suggests that future precipitation intensity changes, rather than vegetation, play a major role in changing regional and global runoff over most land regions in the RCP4.5 (figure S4(c)). Based on both theoretical (O'Gorman and Schneider 2009) and modeling studies (Donat et al 2016), the intensity of precipitation, coincident with global warming, is expected to rise (figure S8). More intense precipitation in arid and semiarid environments where the precipitation rate is higher than the infiltration rate of the soil would result in higher runoff (Dunne et al 1991). Thus, for the same amount of annual precipitation, fewer but more heavy rainfall events will produce more runoff than many lighter ones, and result in parameter-n decreases. Under the RCP8.5 scenario, and consistent with previous results, parameter-n decreases are dominated by decreases in [Tr/LAI] (figure 5(d)), and this too will result in more water for runoff. Thus, high accuracy estimates of the expected increase in daily precipitation intensity and accurate parameterization of stomata closure in response to elevated CO2 are important for ESM modeling community to achieve.
Furthermore, it is worth noting that the characteristics of rainfall seasonality including its magnitude, timing and duration components might affect plant activities and runoff generations, altering the local water retention capability of watersheds (Roderick and Farquhar 2011). Yet its influences are not explicitly quantified in this study. For example, an asymmetry where a decrease in P in the dry spell could lead to a small decrease in Q, while an increase in P in the wet spell could lead to a larger increase in Q. This might be of particular interest given evidence that in a warming world, wet seasons are expected to get wetter (partly due to increased water holding capacity in the atmosphere), whilst for drier regions, are projected to dry seasons get drier (Chou et al 2013).
4. Discussion and conclusion
The Budyko framework was proposed six decades ago, but new datasets have motivated a recent use of this integrated, elegant and intuitive framework to analyze changes in the land hydrological cycle (e.g. Berghuijs et al 2014, Greve et al 2014, Carmona et al 2016). The Budyko framework distills complex systems to a key effective lumped parameter, which helps to understand and quantify measurements and model features. Large-scale effective parameters have prominent roles in other aspects of climate research, for instance overall equilibrium climate sensitivity that is routinely derived for different ESMs (Bindoff et al 2013). Here we combine ESM diagnostics with data, and via the Budyko framework allow summary-level understanding of ESM predictions of runoff changes for historical and future periods, and their performance against river flow measurements. This is particularly difficult without utilizing a summary framework such as that of Budyko, because ESMs have different structures preventing comparison on a per-parameter, per-equation or per-grid basis. Our study contributes to four related and linked advances, which broadly follow our four main diagrams.
First, we demonstrate that the Budyko framework does perform well in modelling river flow across 33 spatially-diverse catchments. In particular, our catchment dependent and time dependent parameter n allows rigorous isolation of the water retention influence on runoff. We find that the effect of water retention change on historical runoff changes is large and must be included in any assessment of river flow changes.
Second, we also compare the differences in three components of runoff changes in recent decades, between ESM estimates and observed data. Critically, we find that the water retention changes in the CMIP5 ensemble are too small for the historical period. This highlights the importance of direct human intervention impacts on water retention, which in turn strongly affects runoff. Thus, there is a need for inclusion within ESMs of direct physical engineering and water resource management, to enable comparison against any parallel changes caused by any imposed climate change.
Third, when the Budyko framework is applied to Earth system models future simulations, the retention component is found to change in such a way to make projected runoff higher than it would be if it was only driven by P and PET. Earlier studies (e.g. Feng and Fu 2013, Scheff and Frierson 2015, Huang et al 2016), based on drought metrics characterized only by precipitation amount and PET. However, without including retention changes, these assessments may not therefore characterize in full the risks of hydrological drought changes. In general, ignoring retention changes will lead to an over-estimation of future hydrological drought severity.
Fourth, we investigate the separate drivers of future change in water retention that are included, implicitly, in ESMs. The physiological effect of CO2-induced stomatal closure (via Tr/LAI), rainfall intensity changes (via SDII) and vegetation cover changes (via LAI) all influence retention. Critically, we find that by the end of the 21st century, the main cause of retention decreases is different between the RCP8.5 and RCP4.5 scenarios. Under RCP8.5, the stomata closure effect dominates, whereas for RCP4.5 it is the increased rainfall intensity.
Correctly, full earth system models remain the main and appropriate tool to perform high-resolution estimates of climate change impacts. The Budyko framework and its proposed enhancement (Taylor series development) is robust enough to better understand such climate model projections of large-scale river runoff. Our overarching finding is that when comparing ESM outputs against historical measurements, accurate representation of land surface water retention effects is needed for reliable runoff estimates. These effects require more accurate estimates of future rainfall features within ESMs. Currently, ESM estimates of rainfall changes vary substantially between models (Knutti and Sedláček 2012). Finally, although also a somewhat intuitive finding, our analysis illustrates the importance of accounting for direct human activity impacts on runoff in ESMs. This includes changes to irrigation, any new dam construction or small streams channeling, and the suppression of wetland and riparian area. Our analysis has enabled us to compare much more directly impacts on runoff through changes imposed by local river management, with those due to large-scale modelled climate change in ESMs as atmospheric greenhouse gases rise.
Acknowledgements
This study was supported by the National Natural Science Foundation of China (41530528), 111 project (B14001), and National Youth Top-notch Talent Support Program in China. CH acknowledges the NERC Science Budget. PC acknowledges support from the European Research Council Synergy grant ERC-2013-SyG-610028 IMBALANCE-P. We acknowledge the World Climate Research Programme's Working Group on Coupled Modelling, which is responsible for CMIP, and we thank the climate modelling groups for producing and making available their model output.