

Abstract
Green infrastructure, such as green roofs, is increasingly being used to reduce 'heat stresses' associated with urban heat island effects. This article discusses strategies to identify vulnerable neighborhoods in the City of Chicago, where green roofs could achieve multiple goals to mitigate urban heat-related challenges. Numerical simulations were performed using the urbanized version of the Advanced Research Weather Research and Forecasting model to predict rooftop temperatures, a representative variable for exposure in this study. The model was dynamically coupled with a physically-based green rooftop algorithm as a part of the urban parameterization within the model. Our approach integrates information from multiple sources: social vulnerability indices (a function of exposure, sensitivity, and adaptive capacity), high-resolution temperature simulations over the urban area, and observed electricity (air conditioning) consumption data. The social vulnerability indicators were used to develop a quantitative heat vulnerability index for Chicago. We found that an analysis of multiple drivers is needed to identify neighborhoods that will likely benefit from mitigation strategies like green roofs. Our case study identified a large number of census tracts in south and west Chicago, along with isolated tracts throughout the city that would strongly benefit from green roof implementation. The tools and methodology from this study can be easily adopted for other urban regions and would be informative for stakeholders and managers, in general, in making adaptation strategies for extreme heat management.
Export citation and abstract BibTeX RIS

Original content from this work may be used under the terms of the Creative Commons Attribution 3.0 licence. Any further distribution of this work must maintain attribution to the author(s) and the title of the work, journal citation and DOI.
1. Introduction
In the US, heat is the deadliest weather hazard, accounting for twenty percent of natural hazard deaths. Between 1986 and 2015, on the average 130 people per year lost their lives as a result of heat stress (National Weather Service Office of Climate 2016). Morbidity and mortality due to extreme heat are also exacerbated by urban heat island effects (UHI; Norton et al 2015). UHI effects are caused by multiple factors including urban ecology (less vegetation cover, thus reduced cooling from evapotranspiration), engineered building material properties (higher thermal capacity and storage), anthropogenic heat emissions (vehicular traffic and heating/cooling of built infrastructure), and urban canyon geometry (reduction of outgoing radiative heat flux due to 'heat trapping' in street canyons) (Sharma et al 2017). Urban landscapes absorb greater amounts of solar radiation during the day, resulting in elevated temperatures, especially at night (Stone and Rodgers 2001, Estrada et al 2017). Wong et al (2011), for example, found that cities are typically 1 °C–3 °C warmer than surrounding areas that are not urbanized. To mitigate UHI effects, cities are increasingly exploring green infrastructure such as urban forest and green roofs (Gill et al 2007, Tzoulas et al 2007, Bowler et al 2010, Wolch et al 2014, Maes et al 2015, Razzaghmanesh et al 2016, Sharma et al 2016). Green infrastructure provides one of the most promising opportunities to significantly reduce urban temperatures (Norton et al 2015, Leal Filho et al 2018). Extensive green infrastructure in cities increases the summer precipitation (Zhang et al 2009), which adds to cooling effects (e.g. due to cloudiness, latent heat of evaporation). Green infrastructure can include permeable high albedo pavements, green streets, urban tree canopy, land conservation, green walls, and green and cool rooftops. The analytical framework we develop in this paper can be applied to any type of green infrastructure, but we focus here specifically on green roofs as a case study, because of the City of Chicago's particular interest in this approach. In other areas of the country, other approaches might be preferable. For example, in arid areas, cool roofs might be more advantageous because there are no irrigation requirements for this approach.
Green roofs provide multiple benefits (Berardi et al 2014). For example, the soil substrate and vegetation have an insulating effect, and vegetation provides shade and evapotranspiration (Coutts et al 2013). Green roofs reduce rooftop surface temperature, produce energy savings for the building, and decrease ambient air temperatures (Coutts et al 2013). How green infrastructure, especially green roofs should be deployed to maximize these benefits remains an open question (Hunt et al 2013).
Multiple factors affect the temperature of cities including vegetation cover, building materials, building configurations, impervious surfaces, anthropogenic heat emissions (e.g., vehicular traffic and heating/cooling of built infrastructure), and the hydrologic characteristics of green space and green infrastructure. These factors vary within cities producing local hotspots (Stone and Rodgers 2001). For example, dense housing, sparse vegetation, and little open space in neighborhoods are significantly correlated with higher temperatures (Reid et al 2009). Thus in identifying appropriate locations for green roofs, there is a need to estimate the specific reductions in temperature that would result in different places in the urban environment.
Reductions in temperature alone, however, are insufficient to identify the most useful application of green roofs or other green infrastructure. To determine green roof locations that successfully reduce heat stressors on vulnerable populations, it is critical not only to identify where green roofs can lower the temperatures most, but also to identify populations that are disproportionately affected by high temperatures. Generally, populations are more vulnerable to heat impacts as a result of socio-economic factors or physical sensitivity (O'Neill et al 2009, Wilhelmi and Hayden 2010, Sarofim et al 2016). For example, there is strong evidence that older adults over the age of 65 are at higher risk for heat mortality and morbidity (Hayhoe et al 2010, Song et al 2017). In particular, older adults have an increased risk for respiratory and cardiovascular hospitalization and death in response to exposure to high temperatures, due to reduced capacity for thermo-regulation (O'Neill et al 2009, Harlan et al 2006, 2013, Rosenthal et al 2014). Pre-existing medical conditions further increases these risks. Cooling the body can result in extreme cardiovascular strain, and any pre-existing condition that impairs the respiratory or circulatory system—obesity, diabetes, heart disease, etc—increases the risk of heat mortality and morbidity (Hayhoe et al 2010, Song et al 2017). In addition to these physical risks, it is important to consider the ability of individuals to respond. For example, low-income individuals may not have air conditioning (AC) or may not be able to afford to run it (O'Neill et al 2005). Social isolation (e.g. living alone) has also been found to be correlated with heat morbidity (Hayhoe et al 2010, Klinenberg 2015), and isolation is more common in older adult populations, which increases the overall impact of this factor.
Within cities, the distribution of parks, green space, and trees are often uneven with low-income, minority populations lacking access to these assets (Pham et al 2012). In a nationwide study, Jesdale et al (2013) found that African American were 52% more likely than whites to live in neighborhoods with a higher percentage of impervious surfaces and less tree cover. This means that populations that are most susceptible to heat impacts also tend to live in areas that have higher temperatures (Harlan et al 2006, Jesdale et al 2013, Coseo and Larsen 2014). In New York City, for example, higher surface temperatures are positively correlated with poverty indices and percentages of African American residents (Rosenthal et al 2014, Madrigano et al 2015). Thus, efforts to mitigate heat impacts, such as implementation of green roofs, offer solutions to environmental justice issues as well.
High temperatures also lead to increased energy consumption in urban settings (Santamouris et al 2001, Madlener and Sunak 2011, Santamouris et al 2015), which can result in power outages that affect critical services such as drinking water, transportation, and healthcare. AC systems can consume more than 50% of the total electricity demand during extreme heat events, with maximum consumption up to 65% of total electricity demand during peak late afternoon hours (Salamanca et al 2013). Siting green roofs to reduce energy demand will help alleviate strain on the electrical energy distribution system.
This paper explores the utility of green roofs in the City of Chicago to achieve the following environmental sustainability objectives: (a) reduce urban temperatures, (b) reduce exposure of vulnerable populations to heat impacts, (c) reduce electricity consumption (AC consumption). To this end, we (1) model temperatures under green roof scenarios; (2) develop a heat vulnerability index (HVI) for Chicago to identify populations that are particularly sensitive to extreme heat; (3) analyze the potential of green roofs to lower electricity loads; (4) examine relationships between temperature reduction, social vulnerability, and electricity consumption; and (5) identify specific urban neighborhoods where green roofs would likely offer multiple benefits.
Chicago is an ideal case study in this context for many reasons. First, it has historically suffered high levels of morbidity and mortality due to extreme heat. In July 1995, an unprecedented heat wave resulted in more than 700 excess deaths in Chicago (Changnon et al 1996, Kunkel et al 1996, Karl and Knight 1997, Klinenber 2015, Chuang et al 2013). During the seven-day heat wave, maximum temperatures exceeded 32 °C with little relief at night (Hayhoe et al 2010). Klinenberg's (2015) seminal analysis demonstrated that rates of heat-related deaths during the 1995 Chicago heat wave had clear spatial variability, with the highest mortality in socioeconomically disadvantaged and isolated neighborhoods. Second, average summer temperatures and the frequency of extreme heat events are expected to rise in Chicago due to climate change (Conry et al 2014, 2015). The 1995 heat wave was unprecedented in Chicago's 123 year old weather records (Hayhoe et al 2010). By mid-century, a similarly intense heat wave is expected to occur approximately twice a decade under low emission scenarios and five times a decade in high emission scenarios. By the end of the century, a 1995-like heat wave is projected to occur three times each year under high emission scenarios (Hayhoe et al 2010). In addition, Chicago has UHI that increases temperatures in the city approximately 4 °C compared to surrounding areas. Lastly, Chicago has adopted a Climate Action Plan to better understand its vulnerabilities and to implement UHI adaptation initiatives in the face of climate change (Coffee et al 2010) and is one of the leaders in green roofs. As of 2010, the city had 509 green roofs (City of Chicago 2017). Chicago's Climate Action Plan set an ambitious vision for extensive green infrastructure that includes aggressive goal of increasing the number of green roofs to a total of 6000 by 2020 (City of Chicago 2008). Additionally, we chose to consider green roofs for our assessment rather than a cost-effective cool roofs due to the green roof's ability to remove pollutants through dry deposition and leaf stomata (Yang et al 2008, Tallis et al 2011, Nowak et al 2014). Moreover, cool roofs can increase energy consumption in winters due to reflection of solar radiations (higher albedo), whereas green roofs provide insulation in winter and summer cooling. Green roofs have aesthetic and conservation potential (Berardi et al 2014). If deployed on a large-scale, green roofs could add up to a substantial amount of green space in the Chicago urban environment, and provide a habitat for plants and insects across the city.
2. Methods
This paper develops an analytical framework for identifying specific neighborhoods in Chicago that would benefit most from the implementation of green roofs based on three key drivers: reductions in roof temperatures due to green roofs, vulnerability of specific communities to heat impacts, and AC consumption of buildings. The methods used to obtain key variables for this interdisciplinary approach follow. Figure 1 shows a schematic diagram of the approach.

Figure 1. Venn diagram illustrating the consensus-based framework used to prioritize urban census tracts for green roof implementation. In this figure, 'Heat Vulnerability' refers to social vulnerability index for heat, 'Temperature' refers to 'reduction in average daytime roof surface temperatures in summers', and 'Electricity Consumption' refers to 'AC electrical energy consumption in summers'. Census tracts with lowest—(U), low—(A), medium—(B), and high—(C) priority are shown. Lowest priority census tracts (U) would lie outside of all circles. Figure is modified based on Norton et al (2015).
Download figure:
Standard image High-resolution image2.1. Temperature
To calculate the temperature for Chicago region, we performed numerical simulations using the urbanized version the Advanced Research Weather Research and Forecasting model (WRF V3.8, Skamarock et al 2005, Chen et al 2011, Sharma and Huang 2012, Kulkarni et al 2016, Sharma et al 2017). We used four two-way nested domains with terrain height and grid spacing (grid points) of 27 km (99 × 99), 9 km (155 × 166), 3 km (190 × 190) and 1 km (319 × 379). Time-varying large-scale lateral boundary conditions were constructed from 3 hourly NCEP North American Regional Reanalysis product at 32 km resolution and the lake and sea surface temperatures were updated at 3 hourly intervals using NCEP Real-time SST archives. The study uses a single-layer urban canopy model (SLUCM: Chen and Dudhia 2001, Kusaka et al 2001, Kusaka and Kimura 2004, Liu et al 2006, Chen et al 2011) which was less computationally intensive and performed well in comparison with other urban parameterizations. For SLUCM, we added a diurnal profile of anthropogenic heat (AH) to the sensible heat flux based on the values estimated by Sailor and Lu (2004) for Chicago. Details of SLUCM and other physical parameterizations within the WRF model to obtain temperatures are included in the supplementary material and figures S1 and S2 is available online at stacks.iop.org/ERL/13/094011/mmedia. Based on Akbari and Rose (2008), we modified urban parameters for the SLUCM parameterizations to reflect current urban conditions in Chicago (see table S1). We performed WRF simulations from 15 August 2013 (0000 LST) to 18 August 2013 (2400 LST), with the first 24 h for spin-up and subsequent 72 h for analysis. The selected period was relatively hot with no precipitation over Chicago, but with strong lake breeze under quiescent synoptic conditions. We used this time period which also coincides with the observational campaign that was used to validate our regional climate model (Sharma et al 2014, 2015, 2016, 2017). In this article, we used average daytime temperatures in the late afternoon from 1400 to 1700 local time over the three-day period for simulating exposure. We consider three temperatures: ground surface temperature, air temperature at 2 m, and roof surface temperature obtained from the innermost domain at 1 km resolution.
2.2. Green roof scenarios
To enumerate green roof temperatures, we used a dynamically coupled green roof algorithm with a four-layer structure with total depth of 50 cm including a 15 cm soil (loam) layer for vegetation (grassland), 15 cm growing media layer, drainage layer, and 20 cm concrete roof layer. The green roof algorithm has already been coupled with SLUCM within WRF (Yang and Wang 2014, Yang et al 2015, Sharma et al 2016). A control run defines a baseline case, where conventional roofs with an albedo of 0.2 were simulated. For sensitivity tests, we introduced green roofs with changing green roof fractions (25%, 50%, 75% and 100% of each roof) and repeated the simulations to evaluate their impact on regional climate. The WRF model and the green roof algorithm were both validated over Chicago in our previous study for the same period (Sharma et al 2016). Note that we consider all roofs as flat for modeling purposes.
2.3. Heat vulnerability index
To measure neighborhood vulnerability to heat, we developed a composite indicator using the same method used to calculate the social vulnerability index (SOVI). Quantitative assessments of vulnerability to heat are relatively rare, and different methods have been used (Romero-Lankao et al 2012, Bao et al 2015). SOVI is one of the most well-known and widely used measurements of social vulnerability (Woodruff et al 2018). It uses an inductive approach to synthesize multiple socio-economic and demographic variables that are commonly used to describe sensitivity and adaptive capacity of populations to the impacts of natural hazards and climate change. In other words, SOVI uses principal component analysis to identify a smaller set of factors that explain the majority of the variation in the original variables and then combines these factors to create a relative score of vulnerability.
In this study, we used 28 variables collected from the Center for Disease Control 500 city project and 2010–2015 American Community Survey available at the census tract—the scale consistently used to measure vulnerability to heat (see table S2 in the supplementary material). These variables include socio-economic and demographic variables that have been widely used in the vulnerability indices and were important predictors of mortality during the 1995 Chicago heat wave.
Analysis of the 1995 Chicago heat wave highlighted the importance of age, race, and income in predicting heat-related health impacts in the city (Hayhoe et al 2010). During the heat wave, hospital admission rates increased 35% for ages 65 years and up compared to 11% for the general population (Semenza et al 1999). Mortality rates were also higher for the elderly (Whitman et al 1997). In addition, heat mortality rates were higher for African Americans than the city-wide average (Whitman et al 1997). Independent of race, low-income neighborhoods had higher mortality rates, most likely because they did not have access to air conditioning (Browning et al 2006). The Chicago heat wave also exposed the vulnerability due to social isolation and pre-existing medical conditions (Semenza et al 1996, Klinenberg 2015). All these factors were included in the index.
While mortality and epidemiological studies have demonstrated that pre-existing medical conditions increase the risk of heat morbidity, data availability on pre-existing medical conditions has limited their use in vulnerability studies. We used the Center for Disease's recently released 500 Cities dataset to capture these risks. Incorporating chronic disease data improves upon previous heat vulnerability studies and helps better identify neighborhoods that are most vulnerable to extreme heat. Since data on chronic disease is only available for cities, we limited our analysis to census tracts within the City of Chicago (N = 803).
Consistent with the SOVI methodology, all 28 variables were normalized using z-scores. To derive the index, we applied principal component analysis, which identifies a smaller set of independent factors that account for a majority of the overall variance within the original data (Kashem et al 2016). The first factor is the linear combination that explains the greatest variation among the original variables; the second factor explains the greatest remaining variation, and so on. We used parallel analysis to determine the optimal number of factors (Tate 2012). To determine what characteristics are being represented, we interpreted the factors based on their correlation (given by the factor loadings) with the original 28 variables. Based on the interpretation of each factor, we rescaled the factors so that higher positive values increase vulnerability to heat. The final HVI score is calculated by adding the rescaled components. The final scores represent relative sensitivity—in other words, scores can help identify which areas of the city are most vulnerable but they cannot be used to compare vulnerability to areas outside the sample and if the sample were changed, the scores would also change. HVI analysis was completed using R.
Four factors were retained with the parallel analysis. The four factors explained 74% of the overall variance among the census tracts. The first component, explaining 39% of the variance, represents pre-existing medical conditions, socio-economic status, and African American population. The second component combines elderly, living alone, Hispanic population, and education explaining 15% of the variance. The third component, which explains 12% of the variance, represents renters and type of housing unit. The fourth component represents language isolation and explains 8% of the variance. Note, a detailed description on HVI methodology is provided in the supplementary materials.
2.4. Electricity consumption
We acquired energy (electricity) usage data for year 2010 from the data portal of the City of Chicago (https://data.cityofchicago.org/Environment-Sustainable-Development/Energy-Usage-2010/8yq3-m6wp) to account for AC electrical energy consumption. We spatially aggregated the census block-level electricity consumption data to the census tract for the summer (June–August) season when cooling loads are the highest. Normalized observed electricity consumption over Chicago shows high consumption in summers (figure 2). We assume the electricity loads in relatively cool spring (April) and fall (October) months would be pure operational usage due to neither heating nor cooling. So, AC consumption in summers was calculated as the difference between total summer average electricity loads (June, July, August) minus average electricity usage in the months of April and October. This analysis assumed the overage above the estimated operational usage for summertime AC consumption, and below for general operational usage (e.g., household usage for illumination). During the winters, the months of November and December showed high electricity consumption likely due to festive season (Thanksgiving and Christmas) decorative lightings and celebrations. Refer to figure S3 for census level partitioning of total, operational usage and AC consumption of electricity in the supplementary material. We note the mismatch of electricity data: we use the year 2010 electricity consumption data with our summer 2013 simulations, primarily due to the unavailability of electricity consumption data for the year 2013. Having consistent electricity production data from 2013 might change the results somewhat from a numerical perspective, however we argue that the broad character of the results, and specifically the selection of neighborhoods that would benefit most from green roof implementation would not be substantially altered.
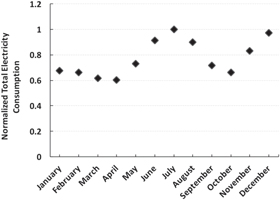
Figure 2. Normalized total monthly electricity consumption over Chicago for year 2010 with a peak consumption in the month of July.
Download figure:
Standard image High-resolution image2.5. Analysis
Analysis and visualization of socio-economic data, temperature data, and electricity (AC) consumption data were performed in ArcGIS software (ArcGIS 10.5, Environmental Systems Research Institute, Redlands, California, USA). We converted the WRF temperature data, originally in NetCDF format, to a continuous raster surface (.tiff) of 1 km × 1 km spatial resolution. The raster surface was then converted into a polygon vector layer to extract the temperature value to resulting polygons. Finally, we performed spatial overlay analysis between the temperature vector layer and the census tracts layer to assign a temperature value to each census tract. For census tracts that were intersected with more than one temperature polygon, we used an area-weighted average to calculate tract temperature. Likewise, the summer electrical consumption data (i.e., total electricity and AC consumption) of the City of Chicago at census block-level was spatially combined to their corresponding census tract.
To analyze the association between temperature, AC consumption and vulnerability, we calculated bivariate Moran's I in GeoDa software (Anselin et al 2006). The bivariate Moran's I is a measure of spatial association between variables at neighboring locations. The interpretation of Moran's I is similar to that of the product moment correlation coefficient. Informally, +1 indicates strong positive spatial autocorrelation (i.e., clustering of similar values), 0 indicates random spatial ordering, and −1 indicates strong negative spatial autocorrelation (i.e., a checkerboard pattern). We also generated cluster maps and significance maps to see which neighborhoods are contributing most strongly to the outcome and in which direction. Significance maps shows the statistically confidence of the cluster mapping where p = 0.001 referring to higher degree of confidence as compared to their neighbors.
2.5.1. Consensus-based model for establishing the priority of green roof implementation
Since any mitigation strategy is difficult to widely apply over a whole urban area, we designed steps for urban planners and city officials to scientifically identify lowest- to highest-priority census tracts for green roofs based on HVI, roof temperature reduction, and observed electricity consumption for AC. First, census tracts associated with a value greater than a 50th percentile threshold (i.e. HVI > 4; temperature reductions with green roofs <−5.3 °C; and AC consumption >229 MWh) are identified separately for each of the three metrics. Then a simple consensus-based scheme is used to identify the relative priority of each census tract as follows (see figure 1):
- (1)Lowest-priority census tracts (U): none of the metrics is above the 50th percentile threshold.
- (2)Low-priority census tracts (A): only one of the metrics is above the 50th percentile threshold.
- (3)Medium-priority census tracts (B): two metrics are above the 50th percentile threshold, but not three.
- (4)High-priority census tracts (C): all three metrics are above the 50th percentile threshold.
3. Results
3.1. Neighborhood conditions
To determine which neighborhoods would benefit most from green roofs, we modeled temperatures, social vulnerability, and AC consumption. Based on our model, the hottest parts of the city are central and west Chicago as shown in figure 3(A). To identify neighborhoods most susceptible to extreme heat, we created a composite indicator that combined data from 28 variables commonly used to model vulnerability to heat. The neighborhoods with the highest susceptibility are also clustered in the south and west Chicago (figure 3(B)). This indicates that relatively higher percentage of residents in these neighborhoods have pre-existing medical conditions, are low-income, live alone, have limited English proficiency, rent their homes, and are elderly. The least susceptible neighborhoods are clustered in central and north Chicago. AC consumption is highest in downtown Chicago with other high consumption pockets throughout Chicago (figure 3(C)).

Figure 3. Map of Chicago census tracts with (A) roof temperatures, (B) heat vulnerability index, and (C) AC consumption.
Download figure:
Standard image High-resolution image3.2. Change in temperature with green roofs
Simulations with different green roof fractions demonstrate that the conversion of conventional roofs to 100% green roofs significantly reduces roof temperatures (t = 116.35, p < 0.001). On average roof temperatures drop by 5.08 °C with 100% coverage (figure 4). With the 25%, 50%, and 75% green roof scenarios' temperatures decreased linearly—each increase in green roofs corresponds to approximately 1.25 °C decrease. Note that these simulations are based on a uniform green roofing strategy, wherein each roof has 0%, 25%, 50%, 75% or 100% green roof cover. For modeling purposes, a percentage green roof cover is not physically partitioned between green and conventional roofs, but here we account for a relative green roof contribution assuming the whole roof is green. For example, an effective contribution of 75% green roof coverage would mean that changes in latent and sensible heat is multiplied by a 0.75 factor. Note, we did not test how patches of green roofs in selected urban areas might change temperatures.

Figure 4. (A) Map of difference in peak daytime roof surface temperature between conventional and 100% green roofs from 1400 to 1700 LST for 16–18 August 2013. (B) Association between temperature reductions, vulnerability, and conventional roof temperatures. Darker points indicate larger temperature reductions; temperature reductions show strong association with conventional roof temperatures but no association with vulnerability.
Download figure:
Standard image High-resolution imageGreen roofs had the largest influence on roof temperatures. While ground and 2 m temperatures also dropped significantly between the no green roof and 100% green roof simulations (ground temperature: t = 109.58, p < 0.001; 2 meter: t = 79.817, p < 0.001), the reductions were smaller. On average, ground surface temperatures dropped 4.09 °C and two-meter temperature dropped 1.66 °C.
Comparing all green roof scenarios, the greatest reduction of temperatures was simulated in the hottest areas of the city with densely built infrastructure and little open green spaces. The plot in figure 4(B) shows the relationship between temperature reduction from 100% conventional to 100% green roofs, conventional roof temperatures, and vulnerability. Temperature reductions are strongly associated with the temperature of the conventional roof (Moran's I = 0.55). Although in some cases, the warmest areas in the city are also most vulnerable. In Chicago, there is a relatively a weak relationship between temperature reductions and vulnerability (Moran's I = −0.05). This relationship is somewhat atypical in comparison to other cities; nonetheless our mapping techniques can identify multiple vulnerable neighborhoods which will benefit from green roofs.
3.3. Relationship between AC consumption, vulnerability, and roof temperatures
In some parts of Chicago, we found a negative association between AC consumption and vulnerability in Chicago (bivariate Moran's I = −0.1539; figure 5). For example, the socioeconomically disadvantaged neighborhoods of southern Chicago have lower AC consumption, except for a few industrial neighborhoods. While less vulnerable neighborhoods in northern Chicago in some cases consume greater electricity, there are an equal number of neighborhoods in the northern Chicago area with low AC consumption (representing energy efficient use of electricity in about half the households and businesses). In most of the city, however, there is not a significant relationship between vulnerability and AC consumption as indicated by white fill (figure 5) because affluent neighborhoods either use a lot of AC or relatively little, but poor vulnerable neighborhoods consistently use relatively little AC.
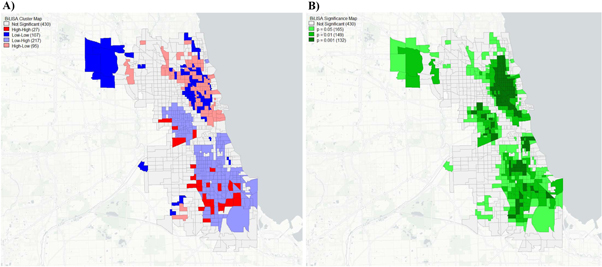
Figure 5. Relationship between AC consumption and vulnerability. (A) The map illustrates local spatial autocorrelation between AC consumption and vulnerability. Bright red areas indicate neighborhoods that consume high AC and have high vulnerability. Dark blue corresponds areas of low AC consumption and low vulnerability. Pale blue and pale red indicate areas that have low AC consumption and high vulnerability and vice versa. (B) The significance plot illustrates the confidence between AC consumption and vulnerability with low p-value showing higher confidence in census tracts of figure 5(A).
Download figure:
Standard image High-resolution imageThe relationship between AC consumption and conventional roof surface temperatures showed a slightly positive association (bivariate Moran's I = 0.103; figure 6). In general, neighborhoods with high AC consumption had higher roof surface temperatures. However, some neighborhoods in west and central Chicago had less AC consumption even with higher roof temperatures. Some neighborhoods in downtown Chicago and northern Chicago had extremely high AC consumption likely due to high-rise residential and commercial buildings occupancy, even though they had low roof temperature due to the lake breeze. Similar to figure 4, neighborhoods in northern Chicago with low roof temperatures consumed higher AC electricity primarily due to increased affordability in rich neighborhoods.

Figure 6. Same as figure 5, but for the relationship between AC consumption and roof surface temperatures.
Download figure:
Standard image High-resolution imageThe clustering of high vulnerability and high roof temperatures in west Chicago identified by our analysis suggests this area is a hotspot for heat-related health impacts (figure 7). Most of these areas also have low AC consumption (see figure 3(C)). For high roof temperature areas of west Chicago, vulnerability was high due to low AC consumption (figure 7). Even with relatively low roof temperatures of south Chicago, these neighborhoods showed high vulnerability. Many north Chicago neighborhoods showed low vulnerability and low temperatures. In general, for many neighborhoods, there was no or very weak relationships between temperature and individual social vulnerability variables such as poverty, race, elderly, single-person households, and language isolation. Corresponding significance maps based on p-values in figures 5–7 show which neighborhoods are contributing most strongly to specific outcomes (and in which direction) for specific drivers.
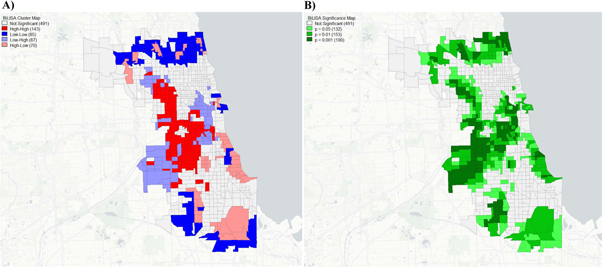
Figure 7. Same as figure 5, but for the relationship between vulnerability and roof temperature.
Download figure:
Standard image High-resolution image3.4. Targeted green roof implementation strategy
Since any mitigation strategy is difficult to widely apply over whole urban area, we designed steps for urban planners and city officials to scientifically identify potential census tracts for green roofs. Thus, to identify high-priority neighborhoods for targeted green roof implementation, we selected a set of census tracts with HVI and green roof surface temperature reductions greater than 50th percentile (figures 8(A), (B)). Figure 8(C) shows the AC consumption for these selected medium-priority census tracts. Subsequently, we sub-selected high-priority census tracts with over 50th percentile AC consumption from figure 8(C) that will respond best to a green roof adaptation strategy and are most vulnerable to heat, would experience strong reductions in roof temperatures with green roof implementation, and likely achieve substantial reductions in AC consumption (figure 8(D)).

Figure 8. (A) Scatter plot of census tracts with reductions in roof surface temperature and heat vulnerability index (HVI). Highlighted 2nd quadrant shows tracts with HVI >= 4 and change in roof surface temperature <= −5.3 C. (B) Map of 2nd quadrant subset census tracts highlighted in yellow. (C) Census tracts in (B) colored with average summer AC consumption data. (D) High-priority census tracts where AC consumption is higher than selected threshold 229 mega watt per hour (MWh) among the tracts of our interest.
Download figure:
Standard image High-resolution image
4. Discussion
In Chicago, the projected increases in average summer temperatures combined with more frequent and intense extreme heat events necessitate aggressive adaptation measures. The city's Climate Action Plan promotes green roofs to reduce the UHI, lower temperatures, and reduce energy demand (Coffee et al 2010). We identify specific high-priority census tracts that would benefit from the green roofs based on potential reductions in temperature, social vulnerability, and AC consumption. Such neighborhoods are predominantly in west and south Chicago (figure 8(D)). Our results, however, expose common challenges with siting green roofs. Namely, outcomes of green roof implementation can compete. For example, reducing electricity consumption or addressing heat vulnerability may be conflicting objectives. The tools and approaches employed in this study can integrate different types of data and are transferable to other cities across the world facing heat stresses. The methods described here can also be used for other mitigation strategies to design urban policy and perform targeted implementation.
Our results suggest that even though green roofs reduce temperatures in general, they will have a limited effect on temperatures in the most vulnerable neighborhoods. The greatest temperature reductions were realized in the hottest areas of the city. AC consumption showed inverse relationship with vulnerability and a positive relationship with roof surface temperatures, although in both cases, the relationship was weak. Downtown Chicago and affluent neighborhoods with high roof temperatures in Northern Chicago were consuming the most electricity. Although high-rise buildings in downtown Chicago have high AC loads, our analysis suggests that use of green roof on these buildings may not substantially reduce cooling loads because of their lower roof to wall area ratio. Furthermore, downtown Chicago lakeshore region benefits from lake breeze resulting in cooler temperatures relative to interior Chicago. Lastly, downtown Chicago exhibits low social vulnerability. Thus, a scientific perspective might advise against investing in green roofs in downtown Chicago, but preferring investments in more vulnerable neighborhoods highlighted in figure 8(D). However, other competing factors for siting green roofs in downtown Chicago would be their relative role in improving aesthetics, air quality and human comfort.
Previous studies have found that the hottest neighborhoods in many cities also have the greatest vulnerability (Rosenthal et al 2014, Madrigano et al 2015). In Chicago, however, vulnerability did not show consistent association with either conventional roof surface temperatures or temperature reductions with green roofs. Consequently, to prevent adverse health outcomes for census tracts where green roofs do not significantly reduce temperatures will require additional adaptive measures. For example, extreme heat warnings and construction of cooling centers have shown decrease in heat-related morbidity and mortality (Bassil and Cole 2010) and could be more effective than green roofs at protecting vulnerable populations in Chicago. While many cities have specific plans for extreme heat events to implement these types of measures, greater attention needs to be dedicated to ensuring these interventions reach at-risk populations to reduce mortality (Bao et al 2015). By assessing heat vulnerability across cities, we can more effectively prevent heat hazards by targeting resources to the places and populations that need them the most.
Some recent studies, however, have been critical of the efforts to evaluate vulnerability and temperature at the neighborhood scale (Kuras et al 2015). The temperatures that individuals experience vary significantly among individuals within neighborhoods due to individuals' daily schedules, lifestyles, and access to air-conditioned spaces (Basu and Samet 2002, Kuras et al 2015). Multiple neighborhoods in South Chicago, for example, had high vulnerability and high roof temperatures but low AC consumption, suggesting that they were not able to afford the same level of air conditioning. Thus, one solution is to develop adaptation strategies that make air conditioning more affordable such as insulating homes, or subsidizing the purchase of energy efficient AC equipment, especially in poor neighborhoods. However, this approach will increase heat emissions to the environment (which exacerbates impacts to those in the community without AC) and increase electricity (mostly AC) consumption and utility costs in poor communities.
Future research may also consider simulations under extreme heat scenarios, which could yield substantially different results. In this study we modeled 'average' afternoon temperatures in August and patterns of exposure may change under extreme heat events. In particular, the lake breeze of nearby Lake Michigan helps regulate the temperatures and UHI effects in Chicago, especially along the highly urbanized lakeshore region (Sharma et al 2017). During the 1995 Chicago heat wave, the cooling effect of the lake breeze was virtually eliminated by southerly winds (Hayhoe et al 2010). Suppression of lake breeze would likely exacerbate existing UHI effects and change temperature patterns across the city.
5. Conclusions
In this study, a methodology based on interdisciplinary tools and techniques was presented to identify high-priority areas for green roofs. Our study uses social and geographic information science (GIScience) based HVI, electricity consumption, and capacity to reduce roof temperatures via green roofs. With this approach, urban planners and managers can be better informed of the competing benefits and disadvantages of green roofs, including the reduction of ambient temperatures, electricity consumption and cost. This approach would help identify hotspots and specific locations where green roof technology can be deployed for sustainable urban development.
Existing studies on urban greening and cool roofs have predominantly focused on local (i.e., building) scales. This article explores the effect of these measures on larger spatial scales and their impacts on meteorological processes. The scenarios we tested—with a green roof or a fraction thereof on every roof in the city—are somewhat unrealistic but provide an estimate of the potential of green roofs to modify the temperatures. Future research should consider more realistic scenarios where green roofs are spread non-uniformly in the city. These simulations would help in determining how urban greening should be designed—specifying in greater detail the abundance, type, and distribution of green roofs.
To our knowledge this work presents, for the first time, integrated assessment of roof surface temperature modification due to implementation of green roofs, social vulnerability, and electricity consumption (AC usage) for a heterogeneous urban region. The tools and methodology can be easily adopted for other adaptation strategies and would be informative for stakeholders and managers, in general, in making green infrastructure choices for extreme heat management.
Acknowledgments
The research work is supported by the Notre Dame Environmental Change Initiative (ND-ECI) and the Notre Dame Center for Research Computing (ND-CRC). Numerical simulations were performed with NCAR Cheyenne computing grant. We also acknowledge the support from the USDA-NIFA Agriculture and Food Research Initiative (awards 2015-67003-23508 and 2015-67003-23460).