

Abstract
The effects of urban heat islands (UHIs) have a substantial bearing on the sustainability of cities and environs. This paper examines the efficacy of green and cool roofs as potential UHI mitigation strategies to make cities more resilient against UHI. We have employed the urbanized version of the Weather Research and Forecasting (uWRF) model at high (1 km) resolution with physically-based rooftop parameterization schemes (conventional, green and cool), a first-time application to the Chicago metropolitan area. We simulated a hot summer period (16–18 August 2013) and assessed (i) UHI reductions for different urban landuse with green/cool roofs, (ii) the interaction of lake breeze and UHI, and (iii) diurnal boundary layer dynamics. The performance of uWRF was evaluated using sensible heat flux and air temperature measurements from an urban mini-field campaign. The simulated roof surface energy balance captured the energy distribution with respective rooftop algorithms. Results showed that daytime roof temperature reduced and varied linearly with increasing green roof fractions, from less than 1 °C for the case of 25% green roof to ∼3 °C during peak daytime for 100% green roof. Diurnal transitions from land to lake breeze and vice versa had a substantial impact on the daytime cycle of roof surface UHI, which had a 3–4 hour lag in comparison to 2 m UHI. Green and cool roofs reduced horizontal and vertical wind speeds and affected lower atmosphere dynamics, including reduced vertical mixing, lower boundary layer depth, and weaker convective rolls. The lowered wind speeds and vertical mixing during daytime led to stagnation of air near the surface, potentially causing air quality issues. The selection of green and cool roofs for UHI mitigation should therefore carefully consider the competing feedbacks. The new results for regional land-lake circulations and boundary layer dynamics from this study may be extended to other urbanized areas, particularly to coastal areas.
Export citation and abstract BibTeX RIS
1. Introduction
Urban environments now support over half of the world population (Ching 2013) and are expected to grow rapidly at rates as high as 2.6% per year in some areas (Northridge and Sclar 2003). There is a need more than ever to develop policies for sustainable and safer cities which protect urban populations from natural and man-made hazards. This paper addresses mitigation strategies for a key physical phenomenon, the urban heat island (UHI) effect, which challenges urban sustainability. The UHI effect is characterized by elevated urban temperatures, especially at night, in comparison with nearby exurban and rural areas.
Since its identification by Howard (1818), UHI effects have been studied as a fundamental anthropogenic modification of the urban environment (Oke 1987). Factors contributing to UHI effects include urban ecology (less vegetation cover, thus reduced cooling from evapotranspiration), engineered building material properties (higher thermal capacity and storage), anthropogenic heat emissions (vehicular traffic and heating/cooling of built infrastructure), hydrological changes (increased runoff due to impervious surfaces and heat transmitted to streams via urban runoff), and urban canyon geometry (reduction of outgoing radiative heat flux due to 'heat trapping' in street canyons). According to the Environmental Protection Agency (EPA), a city with 1 million people or more can be 1 °C–3 °C warmer than surrounding areas (Wong et al 2011). Additional factors such as geographic location (proximity to large water bodies or topography) and regional climatology can either exacerbate or mitigate UHI effects (Keeler and Kristovich 2012, Fernando et al 2010). Sustainable solutions to improve resiliency against UHI effects, both short- and long-term, have received attention in recent years in the context of creating and maintaining livable cities. Important impact pathways associated with UHI effects include thermal comfort, human health, energy and water usage, and air pollution (Santamouris 2014).
Heat waves, periods of abnormally hot weather, exacerbate the threat of UHI due to disproportionate impacts on human mortality, economies, and local ecosystems within cities. For example, during the 1995 US Midwest and 2003 European heat waves, the cities of Chicago (Livezey and Tinker 1996) and Paris (Laaidi et al 2012), respectively, suffered elevated mortality rates due to hazardous coupling of UHI effects and heat wave. The case of Chicago (Whitman et al 1997) is of interest to us because this city will serve as the context of this paper. Global models predict that future heat waves in Chicago will become more intense, more frequent, and longer lasting in the second half of the 21st century (Meehl and Tebaldi 2004).
The UHI strongly affects the urban boundary layer (UBL), and hence heat and moisture exchange between land surface and atmosphere (Miao et al 2009, Zhang et al 2011). Therefore, mitigation of UHI must be accompanied by the careful treatment of the indirect effects to the UBL (Fernando 2010). Urbanization with varying building heights, configurations, and surface materials coupled with lake breeze leads to a complex boundary layer structure (Masson 2006, Han et al 2015). Green/cool roofs modify the development of daytime boundary layer by altering the surface energy balance. Thus an improved understanding of UBL dynamics is critical for determining the height of pollutant dispersion as well as for the development of sea and lake breeze. These effects have been studied for several urban areas (Davies et al 2007, Rigby and Toumi 2008, Yerramilli et al 2008), including Chicago (Harris and Kotamarthi 2005). However, the impacts of UHI mitigation strategies on the UBL and diurnal cycle of lake and land breeze over Chicago is not well explored, and is a central component of our present study, from which impacts on pollutant dispersion may be inferred.
1.1. Background of mitigation strategies
Although Chicago benefits from its proximity to Lake Michigan, especially by the lake breeze as a natural UHI mitigation mechanism, engineered UHI solutions have been a UHI mitigation and climate change adaptation strategy that the city has actively pursued. In particular, Chicago has adopted a Climate Action Plan to better understand its vulnerabilities and to implement UHI adaptation initiatives in the face of climate change (Coffee et al 2010, Bierbaum et al 2013). The mitigation strategies considered include green and cool roofs, urban green space and alternative modes of transportation. Green and cool roofs have the potential to reduce atmospheric warming through redistribution of energy in the surface radiative and heat budget equations, as will be discussed later (for a review, see Li et al 2014). Vegetation arrangement and building arrangement affect the surface temperature distribution, wind profiles and turbulence (Owinoh et al 2005). Similar to a study in Phoenix (Middel et al 2014), another study over London confirms that the average urban temperatures are more effectively reduced by a distribution of smaller parks rather than a few large ones (Bohnenstengel et al 2011, Hunt et al 2013). According to the EPA Urban Heat Island Pilot Project (Akbari et al 2003), green and cool roofs are excellent choices for mitigating UHI effects as rooftops account for 20%–25% of land cover (25% of land cover in Chicago's case; Gillette 2014). The cooling benefits of Chicago's green and cool roof initiatives have, in fact, already been noted via remote sensing (Mackey et al 2012).
Impacts of green and cool roofs have been studied via observational campaigns and modeling at various physical scales, including building energy consumption (Rosenfeld et al 1998, Wong et al 2003), hydrological budget (Takebayashi and Moriyama 2007, Carson et al 2013, Sun et al 2014), pedestrian and building comfort (Peng and Jim 2013), and air pollution (Rosenfeld et al 1998, Rowe 2011). Regional climate models have offered a practical solution for assessing green/cool roof benefits on the city scale, with urban canopy parameterizations accounting for green/cool roof effects on sub-grid scales. Georgescu et al (2014) showed that green and cool roof adaptation approaches offset urban-induced warming in several urban regions. Cool roofs were shown to decrease temperatures (slightly) more than green roofs. Smith and Roebber (2011) have led green/cool roof modeling efforts in Chicago, by employing the Weather Research and Forecasting (WRF) model coupled with a single layer urban canopy model (UCM; Kusaka and Kimura 2004). They did not directly parameterize green roofs, however, and a simple assumption of a uniform increase of moisture availability throughout the entire urban domain at the roof level was made, neglecting many physical processes pertinent to green roofs. Li et al (2014) conducted a more comprehensive study of the effectiveness of cool and green roofs over Baltimore–Washington DC metropolitan region. They employed an urban-WRF (uWRF) model coupled with the Princeton UCM, including well-tuned, physics-based effects of green and cool roofs (Li and Bou-Zeid 2014) to assess changes in surface and near-surface UHI. Yang et al (2015) assessed the impacts of improved urban land surface modeling framework with green roofs for hydrological applications for multiple cities. Their results showed that green roofs can reduce surface temperature and sensible heat flux and enhance the building energy efficiency.
In this paper, we discuss green/cool roof mechanisms, evaluate UCM's performance with observations and assess impacts of UHI on different urban landuse, regional lake breeze circulations, and boundary layer effects. Even though the results of the modeling system are site-specific and location dependent, they, especially qualitative impacts on the convective boundary layer, can be interpolated to other urban areas which strive for similar sustainability goals as Chicago.
2. Methodology
We employed a non-hydrostatic, compressible WRF regional climate model (version 3.4.1; Skamarock et al 2005) which is used to simulate climate at multiple spatial resolutions (mesoscale at ∼50 km to local scales at ∼50 m) (Heikkilä et al 2011, Sharma and Huang 2012, Talbot et al 2012, Conry et al 2015). The model outermost domain covers the Laurentian Great Lakes, while the innermost domain covers the CMA and adjoining non-urban and agricultural areas. Figure 1(a) shows four two-way nested domains with terrain height and grid spacing (grid points) of 27 km (99 × 99), 9 km (155 × 166), 3 km (190 × 190) and 1 km (319 × 379). The outermost domain was large enough to capture any synoptic activity contained within the domain boundaries for the duration of simulation (∼4 days). A large spatial domain also provided degrees of freedom to develop its own synoptic and mesoscale circulations. The model had 40 sigma vertical levels from the surface to 100 hPa, with first 17 levels in the lower 1.5 km. Time-varying large-scale lateral boundary conditions were constructed from 3-hourly NCEP North American Regional Reanalysis (NARR) product at 32 km resolution and the lake and sea surface temperatures were updated at 3-hourly intervals using NCEP Real-time SST archives. All analysis herein focuses on the innermost domain at 1 km resolution. Figure 1(b) shows the land-use categories in the innermost domain, with urbanization over CMA and adjoining regions covered by agricultural area.

Figure 1. WRF model setup: (a) shows dynamical downscaling used with d01 as outermost domain with 27 km grid resolution, d02 with 9 km resolution, d03 with 3 km resolution, and innermost d04 domain with 1 km resolution. Color contours indicate topography with legend to the right defining elevation scale in meters; (b) innermost d04 domain with 1 km resolution which includes Chicago metropolitan area (CMA). CMA is covered mostly by urban landuse and land cover (LULC) 31, 32, and 33, which correspond to low-, medium-, and high-intensity urban landuse respectively. Area outside CMA is predominantly cropland (LULC 12). The orientation indicated by the north arrow shown here applies to all subsequent figures depicting aerial view. The black dashed line AB is the transect for studying the impact of vertical mixing normal to the lake breeze (see figure 10).
Download figure:
Standard image High-resolution imageThe study uses a single-layer urban canopy model (SLUCM: Chen and Dudhia 2001, Kusaka et al 2001, Kusaka and Kimura 2004, Liu et al 2006, Chen et al 2011) which was less computationally intensive and performed well in comparison to other urban parameterizations. For SLUCM, we added a diurnal profile of anthropogenic heat (AH) to the sensible heat flux based on the values estimated by Sailor and Lu (2004) for Chicago. Details of SLUCM and other physical parameterizations used in this study are included in the Supplementary Material.
2.1. Numerical modeling of green/cool roofs
Figure 2 shows a basic schematic of an urban grid cell with built and pervious fraction. Urban built fraction accounts for the impervious part of the grid cell containing buildings, roads, and pavements. Figure 2 also shows different types of roofs: conventional, green and cool roofs. The net radiation for typical roof is given by

where  is thoe net radiation flux at the surface,
  is the sensible heat flux,
  is the latent heat flux, and
  is the storage heat flux. For conventional roofs, most of the incoming energy (net radiation) is translated to sensible heat flux, increasing the air temperature at the surface and above, whereas green roofs reduce surface temperature via evapotranspiration. During the daytime, surface moisture near green roofs is high and a large amount of incoming energy is absorbed for evapotranspiration. A net cooling thus occurs because the net radiation is conserved and sensible heat is reduced to compensate for the increased latent heat expenditure.
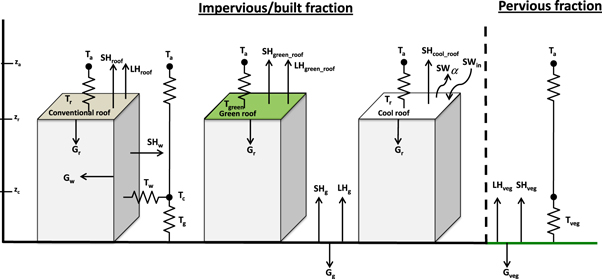
Figure 2. Schematic diagram of the urban grid cell used in WRF for modeling green/cool roof effects (see equations (1)–(4)). There are two parts to each grid cell: the pervious fraction (right of the dashed line) and the impervious/built fraction (left of dashed line). It is assumed that all vegetation in urban areas (parks, lawns, etc) are placed in the 'vegetated fraction' and no vegetation in impervious portion of the grid (Chen et al 2011). The 'vegetated fraction', is further partitioned into vegetated and bare ground. Refer to table S1 for the landuse partitioning in the supplementaty material. The built fraction consists of ground and buildings, which could have 1–2 roof types in this study. SH is the sensible heat flux with subscript (g) denoting the ground flux, (veg) the vegetated fraction, (w) the wall, (roof) the conventional roof, (green_roof) the green roof, or (cool_roof) the cool roof. LH is latent heat flux with similar meanings for subscripts; note that cool roof lacks LH because it is near zero. G is storage heat flux into vegetated fraction (veg), wall (w), ground (g), or roof (r). SWin is the incoming shortwave radiation, which is divided between all other terms, and SWα is reflected shortwave radiation, depending of albedo. T is the surface temperature for same subscripts as SH, but T with other subscripts denotes air temperature for street canyon (c) and first level of atmospheric model (a). Levels at left depict street canyon height (zc), rooftop height (zr), and the first level of atmospheric model (za).
Download figure:
Standard image High-resolution imageIn uWRF, green roofs have a four-layer structure with total depth of 50 cm including a 15 cm soil (loam) layer for vegetation (grassland), 15 cm growing layer, drainage layer, and 20 cm concrete roof layer. The averaged roof temperature,  is calculated as

where fveg is the green roof fraction, Tgreen is the green roof temperature, and Tr is the roof temperature for conventional roofs. Canyon 2 m temperature is calculated using Monin–Obukhov Similarity Theory (MOST) as

where Ts is the surface temperature, Ta is the 1st layer model level,  is the friction velocity at 2 m and
  is the velocity at the 1st model level. The WRF green roof model uses a dynamic irrigation algorithm for summer months of May–September from 1800 to 2000 Local Standard Time (LST) to enhance soil moisture to field capacity values from a look-up table (e.g. 0.329 m m−3 for loam) over urban ground vegetation and green roofs. Note that the derived temperatures are valid for a given type of vegetation. Thermal and hydrological parameters for green roofs algorithm are discussed in Yang and Wang (2014).
Cool roofs reduce the overall net radiation available at the roof by reflecting shortwave radiation from a high-albedo surface. Mathematically, total net radiation at roof surface  is given by the surface radiative budget:

where, SWin is the shortwave incoming radiation, α the albedo, and LWin and LWout are the long wave incoming and outgoing radiations, respectively. For our cool roof simulations, we used an albedo of 0.85 for white paints (table 1).
Table 1. Experimental setup for the mitigation study.
| Experiment | Roof type | Modification |
|---|---|---|
| 1 | Conventional | albedo = 0.2 |
| 2 | Green | green roof fraction: 0.25, 0.5, 0.75, 1 |
| 3 | Cool | albedo = 0.85 |
2.2. Experimental design
A mini-field campaign was conducted in August 2013 to obtain observational data to help evaluate the model performance. Equipment was deployed on the campus of DePaul University, Chicago as displayed in figures 3(b) and (d). One of the rooftop locations was a conventional roof, and the other a combined green/cool roof. Both contained sonic anemometers operating at 20 Hz for sensible heat flux measurement as well as thermocouples for rooftop temperature profiles. The fluxes were measured at 6.5 m and 5 m above the rooftop level so that flux footprint (Kormann and Meixner 2001) would include the respective rooftop types and additional upwind urban surfaces. The instruments' heights, subject to material and regulatory constraints, were selected to achieve flux measurements representative of a larger integrated area.
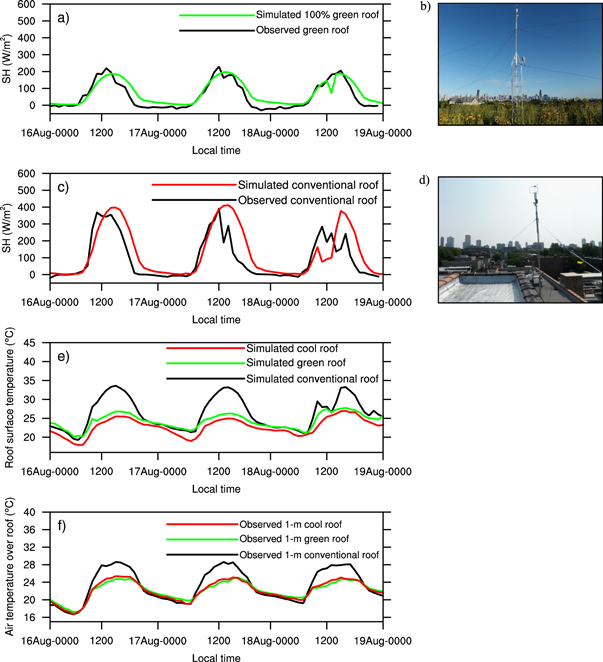
Figure 3. (a) Comparison of simulated and observed sensible heat flux from green roof for 16–18 August 2013 period. 100% green roof simulation was used for WRF output; (b) shows instruments atop McGowan South building's roof garden, data of which are plotted in (a); (c) and (d) are similar to (a) and (b), but for conventional roof sensible heat flux; (e) simulated roof surface temperature for conventional, 100% green, and 100% cool roofs; and (f) observed 1 m above roof level air temperature for conventional, green, and cool roofs.
Download figure:
Standard image High-resolution imageIn order to coincide with the observational campaign and an extended period of no precipitation and clear skies, 15 August 2013 (0000 LST) to 18 August 2013 (2400 LST) was selected for numerical modeling, with the first 24 hours for spin-up and subsequent 72 h for analysis. Hourly outputs were used to analyze the impact of green/cool roofs. Numerical experiments were conducted with different rooftop radiative and energy budget schemes—conventional, green and cool roofs, as shown in table 1—to analyze sensitivity to different roof types and infer their mitigation efficacies. Experiment 1 is the baseline case when conventional roofs with an albedo of 0.2 were simulated. In experiment 2, green roofs were introduced, with changing green roof fractions (25%, 50%, 75% and 100% of each roof), in a series of simulations. Non-green roof fraction was treated the same as in experiment 1 (albedo = 0.2). Experiment 3 examined the cool roofs concept, simulating the effects of an imposed albedo of 0.85 for all roofs. Note that the same fraction of green roofs was used for each grid cell over the entire urban area. Since a regional climate model was used for simulations, changing of roof characteristics by a substantial percentage was needed to produce a noticeable effect on the regional and local meteorology. In reality, all roofs cannot be converted to green/cool. For calculating UHI and energy budgets for green/cool roofs, only the influence of CMA was considered, excluding Milwaukee or other urban environments in the innermost domain.
3. Results and discussion
3.1. Model evaluation: diurnal temperature cycle
First, we assessed the uWRF model's ability to reasonably approximate real-world rooftop conditions. Sensible heat flux measurements from the experimental field campaign dataset were compared with WRF model output at the corresponding grid cell for the period 16–18 August 2013 (figure 3). This comparison required two assumptions: (1) the actual areas contributing to flux footprint were representative of local area and (2) quasi horizontal homogeneity at sub-grid scales in model would result in grid cell average flux similar to the flux from a representative portion of the grid cell. Simulations captured observed diurnal maxima and minima of sensible heat flux accurately for green and conventional roof types (figures 3(a) and (c), respectively). Note that since the observational rooftop was a combined green/cool roof, this is not a perfect one-to-one comparison with 100% green roof simulation but is the closest possible because measured fluxes are most strongly influenced by a roof garden directly beneath. With green roofs, the sensible heat flux is roughly reduced by half. Figures 3(b) and (d) are the photos of instrumental towers for the measurements shown in figures 3(a) and (c), respectively. The WRF model has previously been tuned and validated for Chicago region to simulate the diurnal cycle of near-surface temperature and winds using the routine monitoring data at several locations (Sharma et al 2014, 2016, Sharma 2015), including the particular DePaul observational location (Conry et al 2015), and hence the discussion here only covers the rooftop flux data from the DePaul observational site. The satisfactory agreement of green and conventional roof simulations with observations provided confidence on the model's ability to assess these UHI mitigation strategies.
Figure 3(e) shows the simulated roof surface temperatures. Diurnal variation of observed air temperatures at 1 m height above roof level (ARL) for different roof types (figure 3(f)) showed similar trends as simulated roof surface temperatures. The observed daytime roof temperatures were significantly (∼4 °C) lower for both green and cool roofs in comparison to conventional roofs. The air temperature difference between the green and cool roofs was less significant (<0.5 °C). Note that the observations did not include the roof surface temperatures, but only the 1 m ARL air temperatures, which naturally modulated with the roof surface temperatures. In the following subsections, all presented data will be output from the uWRF model, having established the ability of uWRF to simulate green roof effects.
3.2. Impact on Urban heat island effects using green roofs
The effectiveness of different sustainable roofing strategies was judged by their ability to reduce UHI effects, defined as the difference between the averaged urban and rural temperatures ( The relative differences between conventional and green roofs across CMA was calculated as
  (Li et al 2014) and is plotted in figures 4(a) and (b) for near-surface (2 m) and roof surface urban heat island, respectively. Diurnal profiles were obtained by averaging three days (16–18 August 2013) of simulations, which all had similar meteorological conditions. Daytime 2 m temperature reductions displayed smaller (<0.5 °C) changes as compared with roof surface temperature, which underwent more substantial changes. Daytime roof surface temperature reductions varied nearly linearly with increasing green roof fractions, from less than 1 °C for the 25% green roof case to as much as 3 °C during peak daytime for the 100% green roof case. On the other hand, near-surface temperatures reduced by only about 0.6 °C for 100% green roof coverage. Reduction in daytime UHI was largely relative to the nighttime UHI because most evapotranspiration occurred during daytime while little to none occurred at night. Also, in an urban environment, surface temperatures modulate highly from one location to another due to different surface types: parks, pavements, buildings, asphalt roads, open spaces and ponds. Air temperatures vary less across the landscape, however, as the air mixes quickly via turbulence and causing almost uniform warming.
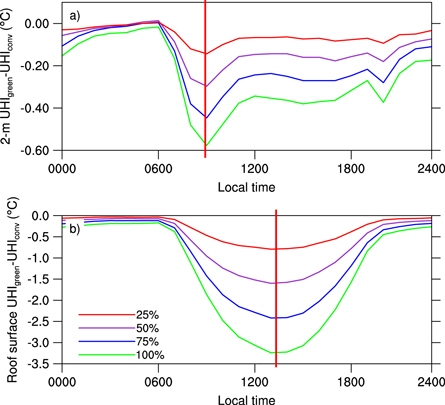
Figure 4. The UHI impact of various green roof fractions as compared to baseline conventional roofs. UHI is defined as  where
where  is the average temperature across all urban landuse categories and
  is the average temperature across non-urban surface types.
  is shown for (a) near-surface (2 m) temperature and (b) roof surface temperature. The roof surface temperatures reduced more significantly with increasing green roof fractions, and the
  response scaled almost linearly with green roof fraction. The vertical redlines indicate the time for peak reduction.
Download figure:
Standard image High-resolution imageReduction of near-surface (2 m) UHI effects during daytime was partly caused by lake breeze, which led to relatively cooler temperatures close to the shoreline of Lake Michigan. Decrease in  for both 2 m and roof surface began at around 0700 local time. 2 m
  reached its minima at around 0900 (local time) while roof surface
  reached minima at around 1300 local time. This time lag was due to the fact that lake breeze in CMA, initiated early around 0800–0900 local time, is affected by the air temperature more than the roof surface temperature. 2 m temperatures showed a second peak at 2100 local time during the transition from lake to land breeze. Thus, in addition to green roofs, lake breeze also contributed to a reduction in UHI.
The implementation of green roofs affected certain parts of the city disproportionately. Table 2 shows how CMA-averaged  calculated with roof surface temperatures varies with urban landuse category and green roof fraction. Results showed that the implementation of green roofs with increasing green roof fractions linearly reduced UHI across all landuse categories. With as low as 25% green roofs, a 2 °C reduction in UHI was achieved over high-intensity and commercial landuse (HL) parts of the CMA. With 100% green roof implementation, over 8.3 °C reduction in roof surface temperature was achieved over HL.
Table 2. Peak daily urban heat island reductions (°C) based on CMA-averaged roof surface temperatures for different urban landuse categories.
| Green roofs | Cool roofs | ||||
|---|---|---|---|---|---|
| Urban landuse category | 25% | 50% | 75% | 100% | 100% |
| Low intensity residential | 0.56 | 1.11 | 1.68 | 2.24 | 1.6 |
| Medium-intensity residential | 1.63 | 3.25 | 4.97 | 6.68 | 7.01 |
| High-intensity/commercial | 2.02 | 4.07 | 6.27 | 8.34 | 10.09 |
| All urban areas | 0.84 | 1.68 | 2.56 | 3.41 | 3.22 |
The aerial view of CMA in figure 5 demonstrates how parts of the city responded differently with reductions in surface temperature and near-surface winds (10 m) for 100% green roofs relative to conventional roofs for innermost (1 km resolution) domain. For the calculations in figure 5 (as well as figure 7 later) the 'daytime' was taken as average conditions from 1400–1700 LST for 16–18 August 2013, wherein the peak daily temperature was observed. As can be seen from figure 5(a), the 100% green roof scenario provided maximum reductions in roof surface temperatures of 6 °C–7 °C over highly urbanized areas and 2–3 °C in suburban areas. As the relative percentage of urban green roofs decreased, the impact of greening on surface temperatures reduced (refer to supplementary figure S1). Green roofs also reduced near-surface (10 m) wind speed (figure 5(b)). Owing to the reduction in UHI effects, the offshore horizontal pressure gradients causing the lake breeze were reduced. Refer to supplementary figure S2 to study the impact of variable green roof fractions on near-surface winds (10 m).

Figure 5. Reduction in roof surface temperature and 10 m wind speed achieved by 100% green roofs relative to baseline conventional roofs: (a) roof surface temperature change for daytime period calculated using model output averaged from 1400 to 1700 LST for 16–18 August 2013 (this was period of peak daily temperatures); and (b) as in (a) but for near-surface (10 m) wind speed.
Download figure:
Standard image High-resolution imageThe simulated averaged energy balance (1) at the roof level is shown in figure 6, with sensible heat flux (figure 6(a)), latent heat flux (figure 6(b)), storage heat flux (figure 6(c)) and total net radiation (figure 6(d)) for different green roof fractions, highlighting the contributions for UHI reduction. With increasing percentage of green roofs from 0 to 100%, the peak sensible heat flux during the daytime was reduced by 140 W m−2 (figure 6(a)) while the latent heat flux (reducing surface energy) increased by 60 W m−2 (figure 6(b)). Since green roofs mitigate UHI effects by increasing latent flux (through evapotranspiration by plants), roof surface temperatures decreased significantly during the daytime and minimally during the nighttime. The roof storage heat flux decreased slightly with increasing green roof fraction during the daytime (figure 6(c)). With green roofs, less heat flux is transferred to the buildings relative to 100% conventional roofs, thus potentially decreasing building cooling energy requirements. At night, because less stored energy was available for release into the atmosphere, green roofs had relatively smaller positive values of heat being released back into atmosphere. During daytime, net radiation decreased slightly with increasing green roof percentage (figure 6(d)) possibly due to regional repartitioning of energy as average urban albedo increased slightly with the addition of green roofs.

Figure 6. CMA-averaged daily terms in energy balance (see equation (1)) at rooftops with changing green roof fraction for 16–18 August 2013: (a) the sensible heat (SH) flux; (b) latent heat (LH) flux; (c) storage (G) heat flux at rooftops; and (d) total net radiation Rn is the sum of terms plotted in three other panels.
Download figure:
Standard image High-resolution image3.3. Impact of cool roofs on UHI
Cool roof implementation was evaluated for only one test case of 100% cool roofs with albedo 0.85, considering that the above evaluation of green roofs and past studies of green and cool roofs (Li et al 2014) demonstrate an approximately linear response of UHI reduction to the variation of green or cool roof fractions. As can be seen from the aerial view of daytime surface temperature reduction in figure 7(a), during the daytime roof surface temperatures for core high intensity urban areas were reduced 7 °C–8 °C, ∼1 °C more reduction than the 100% green roof case. As for figure 5, the 'daytime' was defined as 1400–1700 LST for 16–18 August 2013. Similar to green roofs, near-surface (10 m) wind speed was also reduced over CMA (figure 7(b)) and Lake Michigan. The dynamic reasons for this wind speed behavior are discussed in section 3.4.
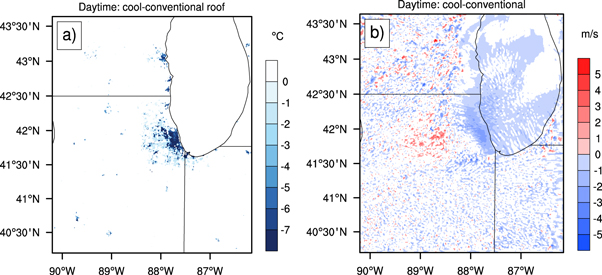
Figure 7. Same as figure 5, but for cool roofs.
Download figure:
Standard image High-resolution imageReduction of absorbed shortwave radiation due to reflection, and thereby less net radiation (4), contributed to the change in surface temperatures during daytime, as confirmed by CMA-averaged surface energy flux comparisons for cool and conventional roofs (figure 8). Net radiation was reduced considerably during daytime as a result of higher albedo of cool roofs, thus causing a significant cooling effect. The sensible heat flux was halved (reduced by 150 W m−2) during peak daytime and because of lack of water, latent heat flux reduced to almost zero throughout the day for cool roofs. Both these fluxes were almost zero during nighttime because there was no shortwave radiation in nighttime. Roof storage heat flux decreased slightly but was not a major contributor in terms of mitigating UHI effects.

Figure 8. CMA-averaged daily terms of the energy balance equation (see equation (1)) for cool and conventional roofs for 16–18 August 2013. Dashed lines are for cool roof and solid lines for conventional roofs.
Download figure:
Standard image High-resolution image3.4. Impact of green/cool roofs on boundary layer
The major alterations of surface fluxes across CMA by green/cool roofs resulted in changed boundary layer structure. To demonstrate the impact of green/cool roofs on boundary layer, time-series (16–18 August 2013) of changes in vertical profiles of temperature, horizontal wind speed and relative humidity were investigated by subtracting CMA-averaged uWRF output for conventional roof case from green and cool roof cases (see figure 9; for green (left panel) and cool (right panel) roofs). A decrease in atmospheric temperature up to approximately ∼1.8 km during daytime (figure 9(a)) and ∼0.1 km at nighttime (figure 9(b)) could be seen. Overall, both green and cool roofs enhance the stability of the atmosphere. A maximum reduction of 1 °C occurred close to ground. A decrease in horizontal wind speed due to reduced vertical mixing of momentum was observed for both green and cool roofs for the lower 1 km of the atmosphere, and an increase above it during daytime (figures 9(c) and (d)). With reduced vertical mixing, upper level air flow with higher wind speed was less entrained into lower-level air with lower wind speed (i.e. reduced momentum transfer from upper to lower layers), so that the wind speed in upper levels over urban area was reduced to a lesser degree in green/cool roof simulations (for a discussion on dynamics, see Owinoh et al 2005 and Zilitinkevich et al 2006). This resulted in higher (lower) wind speed in upper (lower) levels. Lower pressure gradient between the Lake Michigan and CMA reduced the lake breeze and thus contributed towards decrease in horizontal speeds. Higher evaporation during daytime and lower horizontal wind speed caused higher relative humidity close to the ground for green roof case (figure 9(e)). However, for cool roofs the increase in relative humidity occurred due to reduced temperatures (which lower the saturation vapor pressure) and advection of moist cool air from rural areas (figure 9(f)). The impact on different aspects of stability of boundary layer during the 24 h cycle of a day were evaluated using potential temperature. During daytime, the convective boundary layer developed fastest and was deeper with conventional roofs relative to green and cool roofs in lower atmosphere (refer to supplementary figure S3).
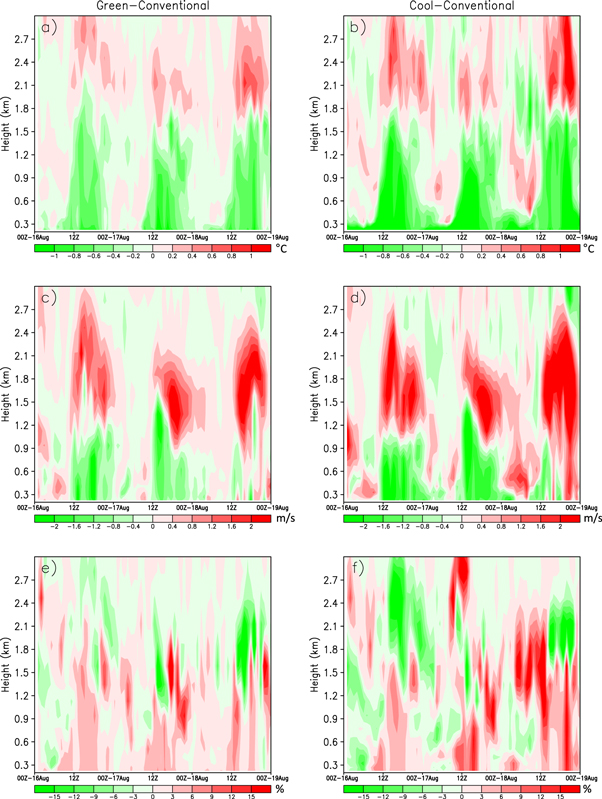
Figure 9. Changes in meteorological variables for 100% green roof case (left panels) and 100% cool roof case (right panels) relative to conventional roof case for CMA-averaged uWRF output vertical profiles for 16–18 August 2013 period; (a) and (b) show changes in ambient temperature; (c) and (d) show changes in horizontal wind speed; (e) and (f) show changes in relative humidity.
Download figure:
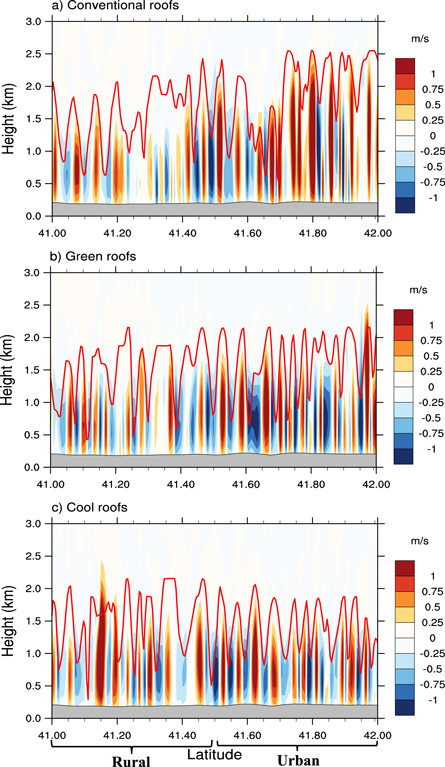
Standard image High-resolution imageTo study the impact of vertical mixing, profiles of vertical wind speed along the line AB from figure 1(b) are shown in figure 10. In general, higher sensible fluxes caused strong vertical mixing over urban areas in comparison to rural and agricultural areas (figure 10(a)). However, over urban areas, the sensible heat flux is reduced with green/cool roofs and generated less vigorous planetary boundary layer (PBL) and thus reduced the vertical wind speeds (figures 10(b), (c)). This effect, in turn, led to lesser vertical mixing and a lower PBL height (figures 10(b), (c)). With conventional roofs, the daytime PBL height reaches 2.5 km, while it is less than 2 km for the green/cool roofs. The decrease in PBL height (0.5 km) for green/cool roofs within CMA is similar to the decrease in California (Georgescu 2015).
Figure 10. Cross section of vertical velocity (m s−1) along line AB (shown in figure 1(b)) at 1500 LST on 16 August 2013 overlaid with planetary boundary layer (PBL) height in red for (a) convectional roofs; (b) 100% green roofs; and (c) 100% cool roofs. PBL height is the calculated height using Mellor-Yamada-Janjic (MYJ) scheme when 2*TKE (turbulent kinetic energy) first drops below a minimum value parameter (0.20 for MYJ scheme) in the atmosphere (Janjic 1994, Duda 2010).
Download figure:
Standard image High-resolution image
Figures 10(a)–(c) suggest large boundary layer convective rolls (CR) in urban areas due to higher surface roughness and larger shear (Miao and Chen 2008, Miao et al 2009). CRs were weaker for green/cool roofs cases with thinner updrafts of vertical velocity and thicker downdrafts. Miao et al (2009) discussed the impact of changing urban boundary layer height on CRs. With weaker vertical velocity, weaker CRs, and lesser horizontal velocity in the lower atmosphere (lower 0.5 km) could lead to stagnation of air close to the surface and thus longer retention times of anthropogenic pollutants released in the urban surface layer. This effect would then lead to increased exposure rates of urban dwellers, a detrimental air quality impact, because of reduced transport of pollutants to upper levels and eventually downstream areas.
4. Summary and conclusions
This study is a step forward in assessing green and cool roof mitigation strategies to combat UHI in the Chicago Metropolitan Area (CMA) using an urbanized mesoscale uWRF model with a single layer urban canopy model (SLUCM). Unlike Smith and Roebber (2011) who used albedo adjustments for green roofs in Chicago, we employ a physically-based green/cool roof algorithm for three hot summer days of August 2013 with lake breeze. The effectiveness of the mitigation strategies investigated in this study would change in other time-periods throughout the year, but the problematic heat wave season for Chicago (and elsewhere) is summer when lake breeze commonly occurs. A more climatological approach addressing multiple seasons was beyond our current scope but is an area for future work.
The uWRF model simulations were verified and validated using sensible heat flux and air temperature measurements from an urban field campaign in a Chicago neighborhood. The uWRF model compared well with data for conventional and green/cool rooftops for sensible heat fluxes. Similar to Georgescu et al (2014), we showed that green/cool roof offsets urban-induced warming. Results showed that the daytime peak roof surface temperature reduced linearly from 0.75 °C to 3.25 °C as green roof fraction increased from 25% to 100%. Green roofs were evaluated for a range of roof fractions, and the cool roofs were evaluated only for the 100% cool roof case. In the latter, the daytime surface temperature for core high intensity urban areas was reduced 7 °C–8 °C, ∼1 °C more reduction than 100% green roof case. The UHI, on the average, decreased linearly with the green roof fraction, but impacted various urban landuse categories differently, ranging from 0.6 °C–8.3 °C for studied cases. The ability to assess heterogeneous green/cool roof implementation strategies is useful for stakeholders wishing to target only certain parts of the city with a green/cool roof.
Modified land cover using green and cool roofs also affected the interaction of UHI with the lake breeze. The diurnal cycle of green roof impacts (figure 4) shows a much different pattern than previous reports (see Li et al 2014; figure 3). The roof surface based UHI had a 3–4 h lag in comparison to that based on 2 m air temperature, which was attributed to lake breeze that initiates in morning. Dual peaks were observed in  one peak was at the onset of lake breeze (∼0800 local time) and another during the evening transition from lake to land breeze. Green and cool roofs also changed regional circulation with reduced near-surface (10 m) winds over Lake Michigan, where the lake breeze originated. Simulations showed decreased UHI signatures over Lake Michigan due to green and cool roofs and the decrease of UHI over CMA.
The modifications to the roof surface energy budget caused by green and cool roofs not only affected the surface and near-surface conditions but also modified the structure of the boundary layer (<2500 m). The lower atmosphere temperature, winds, and relative humidity changed due to reduction in UHI, as vertical mixing and boundary layer depth decreased with green and cool roofs during daytime convective period. The strength of vertical convective rolls and their height decreased. Overall, reduced vertical mixing, weaker CRs and less horizontal velocity in lower atmosphere (<0.5 km) may lead to increased retention time of pollutant-laden air close to the surface during daytime, thus causing air quality issues.
In making a decision between green and cool roofs and other mitigation strategies, several competing benefits and disadvantages must be considered. One benefit is their aesthetic and conservation potential (Beradi et al 2014). If deployed on a large scale such as studied here (e.g. >25% of roofs), green roofs could add up to a substantial amount of green space in the CMA urban environment, and this land could provide a habitat for plants and insects across the city. In addition, studies have shown that urban vegetation has the capacity to remove solid and gaseous pollutants via dry deposition and leaf stomata (Tallis et al 2011, Nowak et al 2014, and sources therein). On the other hand, cool roofs use no water, and cost less than green roofs to install and maintain, and hence may be a more viable and cost-effective approach for mitigating the UHI effects. While green roofs may help remove pollutants through vegetation (Yang et al 2008), increases in water use and local humidity are potential drawbacks. Both cool and green roofs would lead to decreased vertical mixing as discussed above, a disadvantage from the air quality standpoint. Other relevant factors to consider are human comfort and environmental justice.
Future analysis could consider smaller patches of green/cool roofs in comparison to continuous/large roofs (Bohnenstengel et al 2011, Hunt et al 2013), and UHI impact of a specific region for green/cool roofs or block-by-block (microscale) effects of UHI reduction (Middel et al 2014) from green/cool roofs, in addition to the citywide (mesoscale) temperature effects studied here. The impacts assessed from this study would be informative for stakeholders and managers in this region and lessons learnt and approach used will be useful for other cities. We believe that the non-heat wave days will show less intense, but similar impacts within the boundary layer. However, a need remains in future to confirm hypotheses on air quality impacts through mesoscale dispersion modeling. Numerical modeling will help predict the impacts of climate variability on cities and, as shown here, help develop and evaluate adaptation/mitigation strategies for sustainable development.
Acknowledgments
The research work is supported by National Science Foundation (NSF) grant number: AGS 0934592, the Notre Dame Environmental Change Initiative, the Notre Dame Center for Sustainable Energy, and the City of Chicago. This project was also supported by the USDA-NIFA Agriculture and Food Research Initiative (awards 2015-67003-23508, and 2015-67003-23460). Patrick Conry was supported by DoD through the National Defense Science and Engineering Graduate Fellowship (NDSEG) program. Simulations were performed with NCAR Yellowstone, NCSA Blue Waters GLCPC computing grants and the CRC at the University of Notre Dame. The authors would like to thank Mark J Potosnak of DePaul University for his support in the experimental field campaign.