

Abstract
This study investigates the robustness of the long-term changes in the wintertime surface Arctic Oscillation (AO) in the ERA20C reanalysis. A statistically significant trend in the AO is found in ERA20C over the period 1900–2010. These long-term changes in the AO are not found in two other observational datasets. The long-term change in the AO in ERA20C is associated with statistically significant negative trend (approximately −6 hPa per century) in mean-sea level pressure (MSLP) over the Northern Hemisphere polar regions. This is not seen in the HADSLP2 observational dataset, suggesting that the trends in the ERA20C AO index may be spurious. The spurious long-term changes in MSLP and the AO index in ERA20C result in a strengthening of the meridional MSLP gradient in ERA20C. The strengthening of the meridional MSLP gradient is consistent with increases in wintertime storminess in Northern Europe and the NH high latitudes.
Export citation and abstract BibTeX RIS

Original content from this work may be used under the terms of the Creative Commons Attribution 3.0 licence. Any further distribution of this work must maintain attribution to the author(s) and the title of the work, journal citation and DOI.
1. Introduction
Global atmospheric reanalyses are a common tool for the evaluation of climate models and for studies of long-term climate variability. Spurious trends are known to occur in reanalysis products, even for the modern satellite period, due to changes in observation quantity and quality (Bengtsson et al 2004). Similar questions have been raised with regards to century-long reanalyses (e.g. Wang et al 2013), which are primarily based on surface observational networks. Two century-long reanalyses are currently used: the ECMWF 20th century reanalysis (ERA20C; Poli et al 2016) and the second version of the National Oceanic and Atmospheric Administration Twentieth Century reanalysis (NOAA-20CR; Compo et al 2011). Century-long reanalyses have been used to study a number of phenomena including wind power generation (Bett et al 2015), European wave climate (Paris et al 2014, Ulazia et al 2017) East Asian surface air temperatures (Liu et al 2017) and North Russian snow cover (Wegmann et al 2017).
A number of studies have used ERA20C to investigate long-term changes in the Northern Hemisphere (NH) atmospheric circulation. Poli et al (2016) have compared the time evolution of teleconnection indices from NOAA-20CR and ERA20C, including the North Atlantic Oscillation (NAO). The NAO is an index which describes fluctuations in sea-level pressure in the North Atlantic Ocean, commonly calculated by taking the pressure difference between Iceland and the Azores (Hurrell et al 2003). Poli et al (2016) found the NAO to be consistent between NOAA-20CR and ERA20C from 1950 to the present. There were large discrepancies between the two reanalyses in the first half of the century, with ERA20C tending to produce lower values of the NAO index at the start of the century compared to NOAA-20CR. However, Poli et al (2016) did not compare the reanalyses to observations and so did not consider which of the two reanalyses was the most realistic.
Belleflamme et al (2015) also found discrepancies between ERA20C and NOAA-20CR, with ERA20C overestimating high pressure systems over the Beaufort Sea and underestimating low pressure systems over the Arctic Ocean in the early half of the reanalysis compared to NOAA-20CR. Similarly, Dell'Aquila et al (2016) showed that 2–7 day bandpass 500 hPa geopotential height variance in ERA20C was substantially lower in 1900–1930 than in 1980–2010. The differences between 1900–1930 and 1980–2010 were much smaller in the NOAA-20CR reanalyses. Although Belleflamme et al (2015) and Dell'Aquila et al (2016) compared the ERA20C and NOAA-20CR reanalyses, they did not compare with observational datasets.
Befort et al (2016) and Varino et al (2018) found that there was a significant positive trend in ERA20C in the number of extratropical cyclones in the NH polar and European regions. Befort et al (2016) did not find significant positive trends in extratropical cyclone number in the NOAA-20CR reanalyses. Varino et al (2018) investigated the relationship between decadal modes of climate variability and extratropical storminess. Given these dynamical links were considered realistic, Varino et al (2018) concluded that confidence could be placed in the trend in extratropical cyclone number in ERA20C. Other observational studies have concluded that trends over the 20th Century in storminess and extratropical cyclone number are statistically insignificant over Europe (e.g. Alexanderson et al 2000, Feser et al 2015).
A key aspect of the NH atmospheric circulation that has received less attention in century-long reanalyses is the Arctic Oscillation (AO). The wintertime surface AO is defined as the dominant mode of variability of the NH atmospheric circulation and its variability is associated with changing weather patterns over Europe and North America (Thompson and Wallace 2000).
Previous studies have shown that extremes in the NAO index (the dominant mode of variability of the North Atlantic and Europe; Hurrell et al 2003) are associated with extreme temperature and precipitation anomalies over Europe (Yiou and Nogaj 2004. Cattiaux et al 2010). The NAO also shows significant correlation with and significant wave height anomalies. This is most noticeable in the Eastern North Atlantic (Carretero et al 1998, Woolf et al 2002, Dodet et al 2010, Bertin et al 2013). A strong positive correlation is seen in Northern latitudes and significant negative correlation is seen in southern latitudes (Dodet et al 2010). This suggests a link between the large scale modes of atmospheric circulation and regional weather extremes which can impact on major population centres. It is therefore important to understand the behaviour of the large scale modes of atmospheric variability.
The long-term changes in AO from observational datasets have been previously calculated. The first to do this was Thompson and Wallace (2000), using sea level pressure data from 1900 to 1997. The AO has also been calculated in Allan and Ansell (2006) for the period 1850–2003 using the HADSLP2. Both studies find the AO experiences multiple positive and negative extended phases. A predominantly negative AO state is present from 1960 to 1985, with a positive AO in the 1990s. and returning to a more negative phase in the 2000s. Neither study found a significant long-term trend in the AO.
Feldstein (2002) examined the AO index from 1899 to 2000 with an extended version of the dataset from Trenberth and Paolino (1980), finding a linear trend in the AO index between 1967 and 1997, in excess of the level expected by internal variability. Feldstein (2002) show all of the interannual variability of the annular mode in the first 60 years can be explained by atmospheric internal variability, whereas this is not possible in the later period.
The AO has previously been calculated in the ERA20C reanalysis by Liu et al (2017), who examined the relationship between the AO and East Asian surface air temperatures. A positive trend in the normalised AO index was found in Liu et al (2017) (≈0.06 standard deviations decade−1). However Liu et al (2017) did not compare the AO to other century-long reanalyses or observational datasets.
It is clear from previous studies that long-term changes in the atmospheric circulation have been seen in ERA20C. Other studies have hypothesised that long-term changes may be due to the sparse observational network in the early years of the reanalysis compared to the later period (Belleflamme et al 2015, Befort et al 2016, Dell'Aquila et al 2016, Poli et al 2016). Similar hypothesis have been made following studies in the Southern Hemisphere using the NCEP-NCAR reanalysis (Kalnay et al 1996). Spurious trends have been observed in surface pressure field Hines et al (2000) and the number of cyclone tracks (Simmonds and Keay 2000). The majority of these spurious trends coincide with areas where surface pressure observations are most sparse (50N–70N; Hines et al 2000, Simmonds and Keay 2000).
Although, these studies have suggested that these trends are not real, they have not made direct comparisons between ERA20C and observational datasets. To a certain extent, observational uncertainty can be partially assessed by using an ensemble reanalysis (e.g. the NOAA-20CR reanalyses has 56 members). ERA20C, however, has only a single member making such assessment difficult. A new coupled version of ERA20C (available at: https://ecmwf.int/en/forecasts/datasets/reanalysis-datasets/cera-20c), has ten ensemble members which allows for the robustness of long-term changes to be assessed.
In this study, the robustness of long-term changes in the wintertime surface AO and the NH storminess in ERA20C and the recently available Coupled ERA20C (CERA20C) are investigated. Results from CERA20C)are included to provide a comparison to ERA20C and to assess ensemble uncertainty. The paper is structured as follows. Section 2 summarises the datasets analysed in this study (section 2.1), the methods for calculating the AO (section 2.2), and wintertime storminess (section 2.3). Section 3 presents the results for the representation of the AO in ERA20C and two other ECMWF reanalysis products (section 3.1), with details of how this relates to the mean-sea level pressure (MSLP) patterns in each reanalysis (section 3.2) and wintertime storminess (section 3.3). Section 4 concludes and discusses the implications of the key findings.
2. Methods
2.1. Datasets
The main dataset used in this study is the ERA20C reanalysis which spans the period 1900–2010. ERA20C is available every 3 hours at 1.25° horizontal resolution. ERA-20C was created as part of the ERA-CLIM project (see http://era-clim.eu), and is based on ECMWF's Integrated Forecast System. ERA20C uses a four-dimensional variational data assimilation scheme with 24 h window and a spectral resolution of T159 (Poli et al 2016). Only surface pressure data (archived in the International Surface Pressure Databank, ISPD; Cram et al 2015) and surface marine winds (available from the Internal Comprehensive Ocean-Atmosphere Data set, ICOADS; Woodruff et al 2011) are assimilated into ERA20C. The HADISST2.1 sea surface temperature and sea ice concentration datasets are used as boundary conditions (Titchner and Rayner 2014). For further details on ERA20C see Poli et al (2016).
Comparisons between ERA20C and other ECMWF twentieth century reanalyses for the period of 1900–2000 are discussed later in this paper and include:
- (i)CERA20C: The Coupled European reanalysis System, which assimilates both atmosphere and ocean observations, allowing for interaction between the atmosphere and ocean. CERA20C has ten ensemble members with 3 hourly data available, covering the period 1900–2010 at the same model resolution as ERA20C. The ten member ensemble provides an assessment of both model and observation uncertainty throughout the 20th century. CERA20C was initialised from the uncoupled reanalyses ERA-20C and the 20th Century Ocean reanalysis. See Laloyaux et al (2016) for details of the CERA assimilation system.
- (ii)ERA20CM: A ten member ensemble of free-running model integrations using the same model as in ERA20C, covering the period 1900–2010 at the same horizontal resolution as ERA20C. The ensemble does not assimilate any observations, however: sea-surface temperature and the sea-ice cover are prescribed by an ensemble of realisations from HadISST2. ERA20CM provides an estimate of uncertainty in the model climate (see Hersbach et al 2015 for further details).
HADSLP2 is used for comparison with ERA20C. HADSLP2 is a 5° gridded dataset spanning the period 1850–2004. It is created based on digitised terrestrial observations of surface pressure as well as sea-level pressure observations from ICOADS. An empirical orthogonal function (EOF)-based smoother is used to interpolate over data-sparse regions (Allan and Ansell 2006). HADSLP2 has previously been used for twentieth century reanalysis validation by Compo et al (2011). All observations undergo extensive quality control before inclusion in the dataset (as discussed in Allan and Ansell 2006). However, there are still data-sparse regions in HADSLP2, particularly in the early period of the dataset and at high latitudes. Over the ocean the surface pressure data that ERA20C has the option to assimilate should be similar to that used in HADSLP2 (as both are using ICOADS as an input). However, there may be larger differences in land observations, as Allan and Ansell (2006) use a large set of terrestrial observations, whereas ERA20C use all that are available from the ISPD.
In Allan and Ansell (2006) it is noted that HADSLP2 includes a series of quality control checks. First the stations were checked for internal consistency, and stations from multiple sources are converted into a single time-series. Nearest-neighbour and climatology checks were also performed. Large issues in the sources of MSLP data were highlighted from the quality control procedure. Allan and Ansell (2006) state that the measurement and sampling errors are particularly large in the high southern latitudes, where the number of observations is very low.
The monthly-mean AO index created using the method from Thompson and Wallace (2000) is also used in this study (available at: http:/atmos.colostate.edu/davet/ao/Data/ao_index.html). This index covers the period 1899–2002 and is generated by projecting the AO pattern onto monthly-mean MSLP anomalies. Sea level pressure data created for 1899–1997 using an extended version of the dataset, and the method of Trenberth and Paolino (1980). The NCEP-NCAR reanalysis (Kalnay et al 1996) is used from 1997 to 2002. The dataset of Trenberth and Paolino (1980) spans the period 1899–1977, and includes MSLP from eight different sources which can lead to discontinuities when changing from one data source to another. A discontinuity may be present in 1997 when the data source is changed to the NCEP-NCAR reanalysis.
In Trenberth and Paolino (1980) a time series of sea level pressure data is deemed well behaved if there were no long-term trends or discontinuities, and if there were no data points greater than three standard deviations from the long-term mean. If a time series contained issues and was close to another available data source a correction was established, otherwise the problems were documented and data set to missing values. Trenberth and Paolino (1980) note a number of problems in the dataset, the first of which is in the high latitudes, arising due to sparse data coverage. The sea level pressures are shown to be biased high until the end of 1923 at latitudes greater than 70 N.
2.2. Calculating the wintertime surface AO
The wintertime surface AO is calculated as in Thompson and Wallace (2000) by taking the first EOF of the normalised NH monthly-mean MSLP data from 20 to 90N. To ensure equal area weighting within the EOF analysis, the normalised MSLPs are weighted by the square root of the cosine of latitude (as in Thompson and Wallace 2000). The October–March AO value is then calculated as the mean of the six monthly values. This period is chosen for analysis as it is the winter storm season used in Befort et al (2016). All datasets are interpolated onto a 5° grid before calculation of the AO (as this is the resolution of the coarsest product, HADSLP2). The spatial patterns of the AO are shown in subsequent figures as the correlation coefficient between the AO index and the MSLP at each grid box.
2.3. Wintertime cyclone tracking
Extratropical cyclones are identified in the reanalysis datasets by an automated cyclone tracking algorithm based on the method described by Hodges (1995, 1999), used to create the European Wind storm catalogue (Roberts et al 2014). This method provides the 3 hourly tracks of the locations of maximum 850 hPa relative vorticity (at T42 resolution). This method means that cyclone numbers are not impacted by the background MSLP. Only cyclones North of 30°N are included, to exclude tropical cyclones. For a feature to be tracked it must reach a relative vorticity maximum greater than 1 × 10⁻⁵ s−1 and last for a minimum of 2 days. The tracking algorithm has been applied to ERA20C, and individual members of CERA20C and ERA20CM for the period 1900–2000, from October to March. It is important to note that the number of storms identified in this study is dependent on the tracking algorithm used (see Ulbrich et al 2013 and Rudeva et al 2014). It has been shown in Hodges et al (2017) that the chosen method for this study has been used to successfully identify tropical cyclones in six reanalysis products, which match well to tropical cyclone track archives. As Hodges et al (2017) state that nearly every cyclone is found in all six reanalysis over the period 1979–2012 we are confident the method can accurately represent storm counts.
3. Results
3.1. The representation of the wintertime surface AO in ERA20C, CERA20C and ERA20CM
Figure 1(a) shows the AO time-series from Thompson and Wallace (2000), ERA20C, and HADSLP2 over the common time period of 1900–2000. The ERA20C, HADSLP2 and Thompson and Wallace (2000) AO indices compare well in the second half of the century. The agreement of the HADSLP2 AO index with the AO index from Thompson and Wallace (2000) gives confidence that if a bias is present in HADSLP2, then it is the same as that in Thompson and Wallace (2000). Figures 1(c) and (d) show the spatial pattern of the AO for ERA20C and HADSLP2 respectively. The general agreement between the two subplots shows that ERA20C is able to capture the spatial structure of the AO well over the 20th century. The main difference is the magnitude of the pattern (which is larger in HADSLP2).

Figure 1. (a) Time series of the mean October–March AO index from 1900 to 2000 from Thompson and Wallace (2000), ERA20C and HADSLP2. (b) Difference in mean October–March AO index of Thompson and Wallace (2000) and HADSLP2 from ERA20C (c) ERA20C spatial map of AO index presented as the correlation between each grid box's MSLP and the AO index (d) as (c) for HADSLP2.
Download figure:
Standard image High-resolution imageFigure 1(b) shows the differences between ERA20C and the two other AO indices. In ERA20C, the AO tends to be too negative on average from 1900 to 1950 and then moderately too positive on average from 1950 to 2000. A significant positive trend (defined using a Mann-Kendal test with p ≤ 0.05) is present in the time-series of the AO in ERA20C. No significant trends are present in HADSLP2 or Thompson and Wallace (2000) over the same time period.
The power spectrum density from the ERA20C, HADSLP2 and the Thompson and Wallace (2000) AO indices are shown in figure 2 along with the 95% confidence spectrum for white noise. Figure 2(b) shows that at short periods (less than 10 years) the observational datasets have a similar power spectrum density to ERA20C. Statistically significant peaks occur at approximately 2.5 years in all three datasets. However, at larger periods (greater than 40 years) ERA20C is the only dataset with statistically significant power. This is primarily due to the positive trend in the AO index through the century in ERA20C.

Figure 2. Power spectrum density for the October–March AO indices from Thompson and Wallace (2000) (black), HADSLP2 (red) and ERA20C (blue) (a) for periods 0–50 years (b) for period 0–10 years. The 95% confidence spectrum for white noise is given as the grey dashed line.
Download figure:
Standard image High-resolution imageERA20C was part of a suite of experiments including ERA20CM and CERA20C for which the analysis in this paper has been repeated (see section 2.1 for details of the experiments). CERA20C, exhibits very similar trends in the AO to ERA20C (see figure A1). In the period from 1950 to 2000 the AO index is very similar to ERA20C and there is very little spread in the ten member ensemble from CERA20C, which suggests the AO index value is well constrained. However, there is much more spread in the ensemble from 1900 to 1950. There are also more discrepancies between the CERA20C ensemble members and ERA20C where both the atmosphere and ocean are less strongly constrained. The spatial map of the AO for ERA20CM looks similar to that for ERA20C and CERA20C (see figure A1). However, ERA20CM does not show a positive trend in AO in nine out of ten ensemble members (and the trend is only weakly positive in the one member where it is seen; not shown). This suggests that the positive trend seen in the reanalyses may be related to the use of observations in the data assimilation, rather than the boundary conditions used in ERA20C or ERA20CM.
3.2. Long-term changes in wintertime MSLP in ERA20C, CERA20C and ERA20CM
Figures 3(a)–(c) shows October–March MSLP data for ERA20C for the early period (1900–1930), late period (1970–2000) and the difference between the two periods. The figures shows a statistically significant decrease in MSLP of approximately 6 hPa in the polar regions in the late period compared to the early period (results significant to 2 sample t test p ≤ 0.05). A statistically significant approximately 2 hPa increase in pressure is seen over the North Pacific and over central and southern Europe. Figures 3(d)–(f) shows the October–March MSLP data averaged over the same time periods from HADSLP2. In HADSLP2 only small significant changes in mean sea-level pressure are seen over the poles (approximately 1 hPa), and no significant decreases are seen in central and southern Europe or the North Pacific. Hence the pattern of the difference in MSLP from early period to late period is very different in HADSLP2 compared to ERA20C.
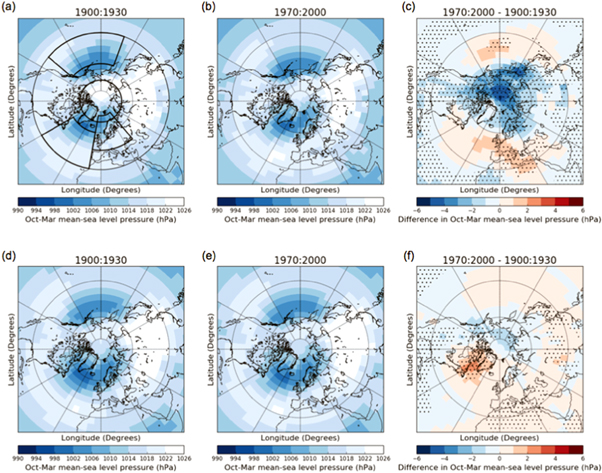
Figure 3. Mean October–March MSLP from ERA20C (a)–(c) and HADSLP2 (d)–(f) for the period 1900–1930 (a) and (d) 1970–2000 (b) and (e) and the difference between the two periods (c) and (f). Stippling indicates significant differences between the two time periods using a two sample t-test (p value ≤ 0.05).
Download figure:
Standard image High-resolution imageThe differences in October–March MSLP shown in figure 2(c) project strongly on to the spatial pattern of the wintertime surface AO in figure 1(c). The correlation coefficient between the ERA20C AO index and the winter-mean MSLP in each region are given in table 1. The extremely strong negative correlation between the AO index and MSLP in the polar region (r = −0.95, p value <0.01) suggests that the trend in the AO index seen in ERA20C (figures 1(a), (b)) is consistent with the higher MSLP in the early period compared to the late period in the high latitudes.
Table 1. Pearsons correlation coefficient between the ERA20C AO index and the regional-mean wintertime MSLP for regions defined in figure 2(a). All p-values are less than 0.01.
| Region | Correlation coefficient between ERA20C |
|---|---|
| AO index and regional MSLP | |
| Extra-tropics | −0.47 |
| Northern Europe | 0.40 |
| Polar Region | −0.95 |
| North Atlantic | 0.46 |
| North Pacific | 0.29 |
Figure 4 shows the mean October–March MSLP averaged over the NH extra-tropics, North Pacific, North Atlantic, Polar region and Northern Europe (defined in figure 3(a)) for HADSLP2 and ERA20C. Figure 4 shows that HADSLP2 does not have a statistically significant trend in MSLP in any of the chosen regions. However, over the whole extra-tropics there is a statistically significant negative trend in MSLP in ERA20C (figure 4(a)). This is dominated by a large negative trend in MSLP over the polar region (figure 4(d)). Significant trends are not present in the North Pacific (figure 4(b)) or North Atlantic (figure 4(c)) in ERA20C.
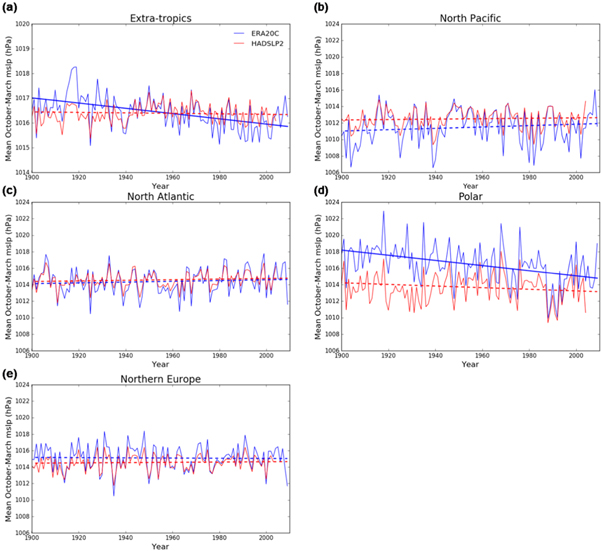
Figure 4. Mean October–March MSLP from ERA20C (blue) and HADSLP2 (red) for (a) the extra-tropics, (b) North Pacific, (c) North Atlantic, (d) polar region, (e) Northern Europe. Regions are defined in figure 3(a). Solid lines show a significant trend using a Mann-Kendal test (p value ≤ 0.05). Dotted lines show no significant trend.
Download figure:
Standard image High-resolution imageThe October–March MSLP differences between the early and late period for the ensemble-mean of CERA20C show a similar pattern to ERA20C (compare figure A2 with figure 3). However, the magnitude of the anomalies in the Polar region are smaller. No significant differences are seen between the early and late period in the October–March MSLP in the ensemble-mean of the free-running ERA20CM (see figure A2). This suggests that the long-term change in the AO index in ERA20C between the beginning and end of the century is likely due to changes in the atmospheric observing system rather than a trend produced by the boundary conditions.
3.3. Wintertime storminess in ERA20C, CERA20C and ERA20CM
The AO/NAO have been related to NH storm tracks by Nie et al (2008), Luo et al (2007) and Luo et al (2011) who showed strong positive winter AO anomalies are associated with increased synoptic scale wave activity in the North Atlantic and therefore an intensification of the North Atlantic Storm track. When the AO is in its positive phase there is an increased meridional pressure gradient in the North Atlantic and North Pacific associated with stronger winds circulating the North Pole (Thompson and Wallace 2000). The stronger winds result in colder air being confined to polar regions, which is associated with regions of increased meridional temperature gradient, providing the baroclinicity needed for storm development and growth (Thompson and Wallace 1998).
The differences in the October–March MSLP over the NH, shown in figure 3, result in changes in the location and strength of the surface meridional pressure gradients over the course of the century. The surface meridional pressure gradients for ERA20C are shown in figures 5(a)–(c), for 1900–1930, 1970–2000 and the difference between the two periods. The reduction in MSLP at polar latitudes in ERA20C from 1970 to 2000 (see figure 3(c)) results in a statistically significant increase in surface meridional pressure gradient over North Atlantic and European sector. In the North Pacific there is a statistically significant increase in meridional MSLP gradient at ≈60°N (figure 5(c)) and a smaller reduction in MSLP gradient at ≈30°N. These statistically significant changes are not seen in HADSLP2 (not shown).
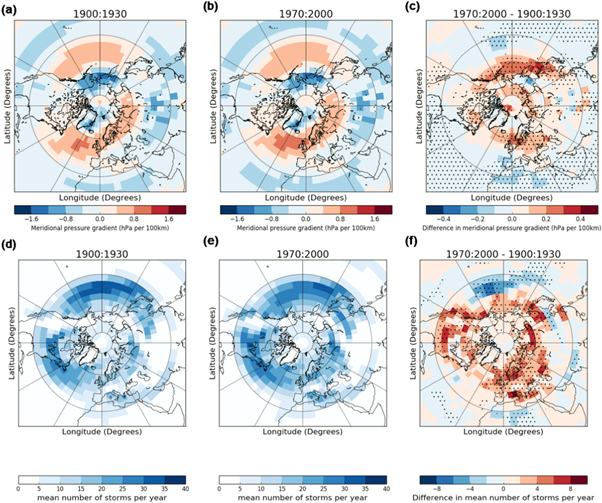
Figure 5. Mean meridional pressure gradient of October–March daily MSLP from ERA20C for (a)1900–1930 (b) 1930–1960 (c) 1970–2000–1900–1930. Subplots (d)–(f) as (a)–(c) but for the number of storms in each 5° grid box. Stippling indicates significant differences between the two time periods using a two sample t-test (p value ≤ 0.05).
Download figure:
Standard image High-resolution imageFigures 5(d)–(f) shows the number of storms from October–March for the 1900–1930, 1970–2000 and the difference between the two periods for ERA20C. The increases in ERA20C's surface meridional MSLP gradient shown in figure 5(c) are consistent with increases in wintertime storminess over the North Atlantic and European sector and the high-latitude North Pacific. However, increasing storminess over North America and Eurasia seen in ERA20C is less consistent with changes in meridional MSLP gradients.
Figure 6 shows the long-term changes in the number of storms for ERA20C in the regions used in figure 4. Statistically significant increases in the number of storms are seen in the extra-tropics which are mostly due to increased numbers of storms over Northern Europe and the Polar region. The analysis here suggests that changes in North Atlantic storminess and high-latitude North Pacific storminess seen in previous studies (Befort et al 2016, Varino et al 2018) are consistent with the spurious trends in MSLP seen in ERA20C.
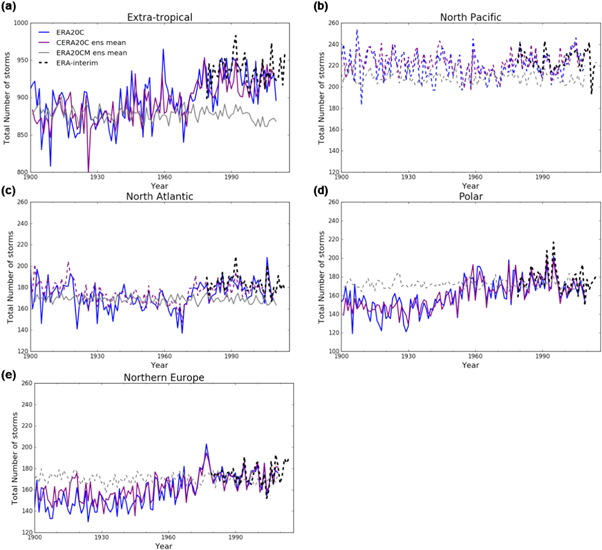
Figure 6. October–March total number of storms for ERA20C (blue), free-running ERA20CM ensemble mean (grey), CERA20C ensemble mean (purple), and ERA-interim (black) for (a) the extra-tropics (b) North Pacific (c) North Atlantic (d) polar region (e) Northern Europe. Regions are defined in figure 3(a). Lines are solid if a significant trend is present (using a Mann-Kendal test; p ≤ 0.05).
Download figure:
Standard image High-resolution imageFigure 6 also shows the changes in the number of storms for the ensemble mean of CERA20C and the free-running ERA20CM. The significant positive trends in the number of storms that are seen in ERA20C are also present in CERA20C in Northern Europe and the Polar region. However, they are not seen in these regions for ERA20CM. It is interesting to note that in Northern Europe and the Polar region the number of storms in the free-running ERA20CM is much higher than in ERA20C for the early period. This suggests that without any observations the model is potentially able to represent the average number of storms more accurately than when the model has only sparse observations, highlighting the difficulties when assimilating sparse observations.
4. Conclusions
The aim of this study is to evaluate the long-term changes in the wintertime surface AO in ERA20C, and associated changes in NH wintertime MSLP and storminess. The key results are as follows:
- (i)A statistically significant long-term change is seen in the wintertime surface AO in ERA20C for the period 1900–2000 (as measured by a Mann-Kendal test p < 0.05). A statistically significant long-term change is not present in the AO index calculated from two observational datasets (Thompson and Wallace 2000, Allan and Ansell 2006).
- (ii)The long-term change in the AO in ERA20C is due to a spurious decrease in MSLP in the polar region (latitudes >60N). Again this long-term change in MSLP is not seen in the two observational datasets which have been quality controlled.
- (iii)The long-term changes in MSLP correspond to changes in the meridional pressure gradients over Northern Europe and the Polar region, which are consistent with increases in wintertime storminess seen in ERA20C over the North Atlantic and North Pacific.
The long-term changes in MSLP in polar regions are consistent with Belleflamme et al (2015) who showed that at the start of the century ERA20C has less low pressure systems over the Arctic Ocean and more high pressure systems located over the Beaufort Sea (when compared to NOAA-20CR). This study has extended the work of Belleflamme et al (2015) by comparing to gridded observations in order to show that the polar region is the region of largest spurious change in ERA20C.
This study provides evidence for the increasing trend in wintertime surface AO index seen in Liu et al (2017), by demonstrating significant differences in the AO time series generated using ERA20C before and after 1950 compared to two observational datasets. In this study the observational datasets are considered as truth. However, there are notable discrepancies between them, particularly in the early period, when observations are sparse (see figure 1). Trenberth and Paolino (1980) comment that there are anomalously high sea level pressures at high latitudes in their dataset before 1923, which may explain some of these differences. The key point for this study is that although both observational AO indices are different, they both do not contain a long-term change.
The increasing long-term change in NH storminess is consistent with that found in Befort et al (2016) and Varino et al (2018) for ERA20C. The consistency between the number of storms in ERA20C and ERA-interim from 1980 to 2000 suggests that ERA20C has a good representation of storms for this period.
The long-term changes in ERA20C MSLP are most pronounced at high latitudes. This is an area where Poli et al (2016) have documented there are particularly large increases in the number of observations that are assimilated into the reanalysis over time, with sparse observations in the early period. Simmonds and Keay (2000) and Hines et al (2000) find similar problems in the southern hemisphere in the early period of the NCEP-NCAR re-analysis where observations are more sparse than in the later period.
The fact that long-term changes in the AO, MSLP and wintertime storminess are not present in free-running ERA20CM (which does not assimilate surface pressure or wind speeds; see figures A1, A2 and 6) supports previous studies that have suggested long-term changes may be due to the assimilation of increasing numbers of observations (Belleflamme et al 2015, Befort et al 2016, Dell'Aquila et al 2016, Poli et al 2016).
This study has shown that a significant long-term positive trend is seen in the ERA20C AO index, which is not seen in other century-long observational datasets. The ERA20C reanalysis should therefore be used with caution when examining the effects of long-term climate change at latitudes greater than 60°N, as there may be spurious trends in this region.
Acknowledgments
Bloomfield was funded as part of the Wind Storms Information Services project, a Copernicus Climate Change Services programme project funded by the European Union. Vidale and Hodges were funded as part of National Centre for Atmospheric Science. Shaffrey was funded by the WINDSURFER project, part of the ERA4CS, an ERA-NET initiated by JPI Climate with co-funding by the European Union (Grant 690462).
: Appendix
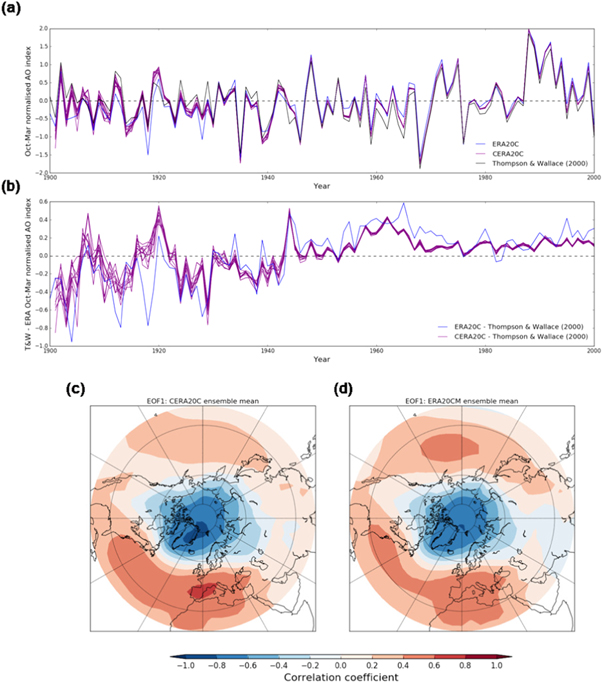
Figure A1. (a) Time series of the mean October–March AO index from Thompson and Wallace (2000) (black), ERA20C (blue) and CERA20C (purple) (b) difference in mean October–March AO index from ERA20C, and CERA20C from Thompson and Wallace (2000) (c) CERA20C spatial map of AO index (d) ERA20CM spatial map of AO index.
Download figure:
Standard image High-resolution image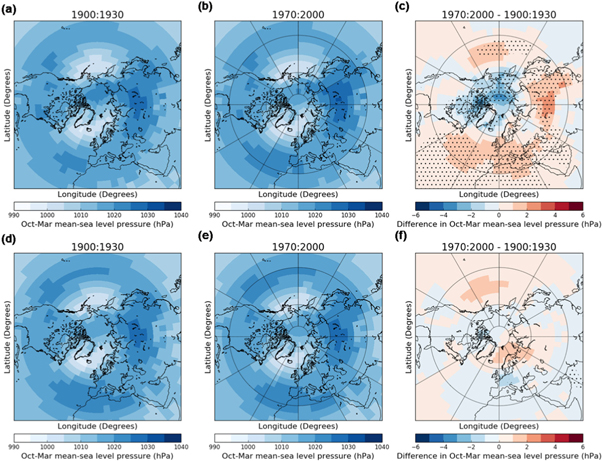
Figure A2. Mean October–March MSLP from CERA20C (a)–(c) and free-running ERA20CM (d)–(f) for the period 1900–1930 (a), (d) 1970–2000 (b) and (e) and the difference between the two periods (c), (f). Stippling indicates significant differences between the two time periods using a two sample t-test (p value ≤ 0.05).
Download figure:
Standard image High-resolution image