

Abstract
Numerous studies have established a link between tropical atmospheric conditions and northern midlatitude circulation mediated by Rossby wave propagation in winter. In recent years, research has also investigated tropical to midlatitude teleconnections in northern hemisphere summer. In this paper, we examine summer connections further by imposing observed tropical conditions in climate model simulations. We examine resulting changes in the representation of seasonal mean surface climate variables and mid-troposphere circulation in the northern hemisphere summer, identifying regions where model fidelity improves following the imposition of tropical conditions. We demonstrate robust connections between the tropics and mid-latitudes on the seasonal timescale, with these connections apparent in three mid-latitude regions, namely eastern North America, central Europe and northern Siberia. These regions are shown to be impacted by wave trains originating in specific regions of the subtropics associated with patterns of upper-level convergence. The results provide a clearer picture of tropical to extratropical teleconnections that affect summer mean climate in the northern midlatitudes.
Export citation and abstract BibTeX RIS

Original content from this work may be used under the terms of the Creative Commons Attribution 4.0 license. Any further distribution of this work must maintain attribution to the author(s) and the title of the work, journal citation and DOI.
1. Introduction
Summer climate variability, particularly extremes, can have profound socio-economic impacts. In Europe, heatwaves (Robine et al 2008, Barriopedro et al 2011) and extremes of precipitation leading to flooding (Grams et al 2014, Fekete and Sandholz 2021) have led to excess deaths running into the thousands and economic losses up to multiple billions of Euros (Ulbrich et al 2006). Drought can also have profound impacts on crop yields (Bachmair et al 2018, Parsons et al 2019) and on river levels and hence transport along waterways (Madrugo de Brito et al 2020). Not only extremes are important; up to a third of variability in crop yield worldwide (and up to 60% in the major breadbasket regions of the world) may be attributable to interannual variability (Ray et al 2015), while in the United States, up to 70% of summer domestic energy consumption is driven by internal climate variability (Eshraghia et al 2021). Droughts also have impacts on hydropower production (Van Vliet et al 2016) and on the availability of cooling water for thermoelectric power production (Byers Edward et al 2020). It is therefore important to understand how much of summer variability is driven by chaotic processes and how much by potential teleconnections to slowly varying drivers.
Progress has been made in identifying some of these drivers in recent years, with studies establishing links between spring and summer Atlantic sea surface temperature (SST) anomalies and European summer precipitation (Dunstone et al 2018); the role of circumglobal wave trains in these precipitation anomalies (Saeed et al 2014); and between SST and Eurasian wave-trains (the silk road pattern, Thompson et al 2019) which impact summer temperature anomalies across Asia. More generally, summer conditions in the Northern hemisphere are characterised by a circumglobal wave train (Ambrizzi et al 1995, Ding and Wang 2005) driven by summer tropical precipitation anomalies (O'Reilly et al 2018). Mean sea level pressure (MSLP) patterns also play a role. In North America, summer temperatures are related to the Pacific-North America pattern (PNA) and the Arctic oscillation (Justino et al 2022), albeit with weaker links than in winter (Manthos et al 2022). In Europe, summer temperature and precipitation are related to the two leading modes of variability in MSLP over the North Atlantic sector, the Summer North Atlantic Oscillation (SNAO, Folland et al 2009) and the Summer East Atlantic Pattern (EAP, Barnston and Livezey 1987), with associated impacts on surface temperature over Europe (Cassou et al 2005). The SNAO appears to be dominated by chaotic atmospheric processes (Franzke and Woollings 2011) with only limited predictability (Wang and Ting 2022). In contrast, the EAP appears to have tropical drivers linking the EAP and European temperatures, with the EAP in turn being driven by fluctuations in a dipole of SSTs between the central equatorial Pacific and the Caribbean (Wulff et al 2017).
Tropical links to northern hemisphere mid-latitudes have previously been examined by many authors (e.g. Liebmann and Hartmann 1984, Stan and Lin 2019), particularly for northern hemisphere winter (e.g. Trenberth et al 1998, Toniazzo and Scaife 2006, Scaife et al 2017). Maidens et al (2021) (hereafter M21) used relaxation experiments to impose observed tropical conditions in winter seasonal reforecasts, allowing extratropical responses to be diagnosed. They showed that in winter, patterns of mid-latitude circulation are well simulated in a majority of years by accounting for tropical influences alongside those from the extratropical stratosphere. In this paper we extend this investigation to boreal summer (June–July–August or JJA) using a similar relaxation methodology. Relaxation is now a well-established and widely used technique in the study of climate dynamics (e.g. Ferranti et al 1990, Klinker et al 1990, Jung et al 2010, Greatbatch et al 2012, Watson et al 2016, Knight et al 2017, 2021, Maidens et al 2019, 2021).
Our relaxation approach allows us to identify tropical contributions to observed extratropical variability in a more systematic way than selecting regions a priori by their relation to specific phenomena (e.g. EAP) or impacts (e.g. Western Europe). We aim to test whether imposing observed tropical variability improves the reproduction of seasonal mean patterns of extratropical atmospheric circulation. We then identify the parts of the northern hemisphere midlatitudes showing the largest increases in correlation with reanalysis, and identify tropical sources of influence. Note that these connections may not indicate scope for improved predictability within models; instead, they may link midlatitude conditions to tropical phenomena which are themselves unpredictable (hence we discuss increases in correlation, rather than forecast skill). Nevertheless, the approach is useful in further illuminating the dynamical teleconnections in the summer season. The teleconnections are typically mediated by wave activity (as noted above) and the relaxation technique enables us to identify the wave trains from the tropics that contribute to seasonal mean conditions in the extratropics The remainder of the paper is presented in the following way: section 2 describes the experimental techniques as well as the datasets used, and analysis methods adopted; section 3 describes the results of our experiments; and section 4 presents our conclusions.
2. Data and methods
Following M21, we run two sets of experiments using the Met Office GloSea5 seasonal prediction system (MacLachlan et al 2014). Each set consists of a historical reforecast (hindcast) over the period 1993–2015, comprising an ensemble of simulations initialised around 1 May of each year and covering the summer season JJA. The tropical relaxation experiment, TROP (30 members per year), has wind components u and v and temperature T relaxed towards ERA-interim (ERAI) reanalysis fields (Dee et al 2011) throughout the depth of the model atmosphere between 19.5° N and 19.5° S with an e-folding time for relaxation of 6 h. To minimise the risk of shocks due to the artificial imposition of relaxation increments, relaxation is tapered between latitudes of 19.5° and 25° in both hemispheres. The control experiment without relaxation, HCAST, consists of 21 members taken from hindcasts for the period 1993–2015, with initialisations centred around 1 May for each year. Further details of the experimental design can be found in Maidens et al (2019). Note that unlike M21, which examined the northern hemisphere winter, an experiment relaxing the extratropical stratosphere is not performed as the summer stratosphere lacks the variability of its winter counterpart (Domeisen and Butler 2020) and therefore is not expected to influence mid-latitude circulation variability.
Anomaly correlations of ensemble means with reanalysis are computed using ERAI for MSLP, 2 m temperature and 500 hPa geopotential height (Z500). ERAI is used rather than the more recent ERA5 reanalysis (Hersbach et al 2020) to be consistent with the use of ERAI in the relaxation. For precipitation, correlations are calculated against data from the Global Precipitation Climatology Project (GPCP Pendergrass and National Center for Atmospheric Research Staff 2016).
To assess how well the model (whether HCAST or TROP) reproduces ERAI surface and upper-tropospheric circulation, we use pattern correlations (Hegerl and Zwiers 2011) of seasonal mean circulation for the whole mid-latitudes. Because large scale circulation variability can be strongly influenced by a few leading patterns, there is a non-negligible potential of relatively high pattern correlations occurring by chance. To address this we construct randomly paired, non-identical years of summer-mean ERAI data to estimate the limits of significance of pattern correlations (since each year is assumed to be an independent sample). To identify geographical regions of strong teleconnections between the tropics and midlatitudes, we consider temporal correlations of fields at each gridpoint, calculating the Pearson correlation coefficient and assessing statistical significance using Monte Carlo simulations.
Mechanisms underlying teleconnections are assessed by analysis of upper-tropospheric (200 hPa) azonal streamfunction anomaly (henceforth STRMFN anomaly) as a guide to tropically generated wave activity, together with 200 hPa divergence, divergent wind field and Rossby wave source (RWS; Sardeshmukh and Hoskins 1988). Following this analysis, although the underlying driver for wave activity is convection in the tropics (with accompanying tropical precipitation anomalies), rather than finding RWS co-located with these precipitation anomalies, we would expect to find the sources where the divergent outflow (or convergence from compensating downward motion) meets gradients of vorticity in the subtropics on the flanks of the subtropical jets (Sardeshmukh and Hoskins 1988, Shimizu and de Albuquerque Cavalcanti 2011). We use upper-level divergence as a diagnostic to infer where convective heating anomalies and precipitation anomalies may be driving wave activity. Figures throughout show the change in a field (TROP minus HCAST) or the change regressed onto the change in an area-average timeseries, i.e. the impact of tropical relaxation on the teleconnections when compared to a freely running hindcast. RWS analysis was carried out using the Windspharm python library (Dawson 2016).
Possible links to the Madden Julian Oscillation (MJO) are assessed using daily data available from the Bureau of Meteorology (Wheeler and Hendon 2004).
3. Results
We firstly consider whether tropical signals affect the reproduction of midlatitude conditions in ERAI. Figure 1 shows the distributions (for each hindcast year) of pattern correlations between model ensemble mean and reanalysis for midlatitude bands in both hemispheres, examining both surface (MSLP) and mid-tropospheric (500 hPa geopotential height; Z500) measures of atmospheric circulation. MSLP is more relevant to surface impacts, but in summer can be affected by shallow phenomena such as heat lows. Z500 is thus useful to corroborate the presence of teleconnections (which tend to appear through a greater depth of the troposphere).

Figure 1. Impact of tropical relaxation on reproduction of midlatitude circulation. Pattern correlations for a mid-latitude band between 40° and 75° N (S) for TROP and ERAI (red), HCAST and ERAI (blue), and for a null hypothesis of randomly paired years of ERAI excluding repetition (black). Top row: MSLP; bottom row Z500. Distributions for each year are shown for the northern hemisphere (a), (c) and southern hemisphere (b), (d). Dots (TROP and HCAST) correspond to individual hindcast years. For the null hypothesis test, the square indicates the mean of the distribution, circles indicate the 5th and 95th percentiles, and dashed lines extend to the maximum and minimum values. For each panel, each distribution is shifted relative to the other two (significant at the 95% level for a 2-tailed Welch's t-test) except for the northern hemisphere hindcast distribution for Z500 (Figure 1(c)) which is statistically indistinguishable from the null hypothesis at the 95% level.
Download figure:
Standard image High-resolution imageFigure 1(a) shows the range of pattern correlations for northern hemisphere midlatitude MSLP in HCAST and TROP alongside an estimate of the range of pattern correlations that could be obtained by chance. Most individual years in HCAST are within the 90% limits for significance and the mean pattern correlation (0.06) is small. As a result, we see that HCAST essentially reproduces none of the ERAI summer-mean midlatitude variability. For TROP, in contrast, there is a shift in the distribution towards positive correlations and several years a possess pattern correlations that are unlikely to arise by chance. The mean correlation in TROP is 0.22, which is significantly different from zero (p =  ) and the mean of HCAST (p= 0.03). We see that 5 out of 23 years' pattern correlations for TROP exceed the 95th percentile of the null hypothesis (compared to the 2–3 we would expect at random). This demonstrates that while tropical influences do not dominate the northern summer midlatitude atmospheric circulation variability, they have a significant influence.
Following from M21, in which winter connections in the northern hemisphere were examined, we show simulated versus reanalysis MSLP pattern correlations in the southern (winter) hemisphere midlatitudes (figure 1(b)). In this instance, there is a clear influence of the tropics in both HCAST and TROP, with mean correlations of 0.19 (p = 0.003) and 0.40 (p =  ) respectively. This shows that the seasonal prediction system can predict winter circulation in the southern hemisphere to an extent, just as in the northern hemisphere (M21). Enhancing the fidelity of the tropics by relaxation augments this.
Equivalent results for Z500 (figures 1(c) and (d)) reinforce the results from analysis of MSLP. Northern hemisphere Z500 patterns are not reproduced in HCAST but relaxation improves this somewhat in TROP with 7 out of 23 years of pattern correlations for TROP exceeding the 95th percentile of the null hypothesis. In the southern hemisphere, HCAST again has some skill but the ability to reproduce the tropospheric circulation patterns is enhanced in TROP, with 11 out of 23 years of pattern correlations for TROP exceeding the 95th percentile.
Having seen improvements in the reproduction of circulation variability in the northern (summer) hemisphere, we consider whether these improvements are uniform across the whole of the midlatitudes or focussed on particular regions. Since there are essentially no teleconnections evident in HCAST, tropical-extratropical teleconnections in seasonal means can be identified by increases in the ability of TROP to reproduce observations. Figure 2 shows the increase in anomaly correlation coefficient at each grid point for TROP minus that for HCAST for MSLP, Z500, 2 m temperature and precipitation. Increases in correlation indicate where relaxing the model to reanalysis improves the representation of key variables (either surface or mid-tropospheric) in the hindcasts.
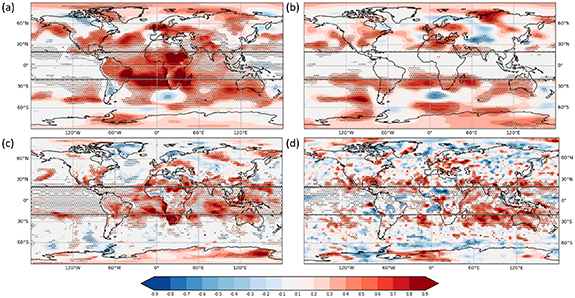
Figure 2. Identification of regional impacts of tropical relaxation. Difference in correlation between TROP and ERAI/GPCP and HCAST and ERAI/GPCP for (a) MSLP, (b) Z500, (c) 2 m temperature and (d) precipitation. Stippling indicates confidence at the 95% level (2-tailed Monte Carlo simulation).
Download figure:
Standard image High-resolution imageWithin the tropics, where we are imposing the observed conditions, figure 2 enables us to distinguish regions where HCAST is already simulating reanalysis well, and regions where the representation of the tropics is less well captured. In most of the tropical Pacific, imposing reanalysis leads to very little change in correlation for MSLP or Z500, due in part to the high skill in the seasonal hindcast already present in simulating the El Niño-Southern Oscillation (ENSO) (MacLachlan et al 2014). Changes in correlation for temperature and precipitation are also modest in the Pacific east of the dateline. For the surface fields in the other two tropical ocean basins, increases in correlation due to tropical atmospheric relaxation are positive, indicating that HCAST is only partially successful in representing tropical fields in these basins. In the mid-troposphere, in contrast, away from the southern boundary of the relaxation region, correlation for Z500 shows very little change in the whole of the tropics, due to very small interannual variability in the Z500 field. This shows that the improvements in the reproduction of the low-level tropical fields are shallow features.
As noted, within the relaxation region, increases in correlation help us to diagnose areas where HCAST is not reproducing reanalysis conditions fully. Outside the relaxation region, increases in correlation address the different issue of the extent to which tropical teleconnections improve the representation of midlatitude fields when compared with reanalysis. We find several geographical areas where TROP significantly increases the correlation with reanalysis relative to HCAST. Starting with MSLP (figure 2(a)), we see considerable areas of increase, both over land and in the oceans in the northern hemisphere. Over land we see increases for a considerable part of southern and eastern North America, western and much of central Europe as far east as the Caspian Sea and a region of northern Siberia south of the Kara and Laptev Seas. Over the oceans, meanwhile, regions of increased correlation are found in the central North Atlantic and the eastern North Pacific (extending inland over western Canada). However, MSLP does not necessarily indicate the influence of remote dynamical influences in summer due to phenomena such as local heat lows, which decouple the surface from larger scale flows aloft. Consequently, we also consider Z500 (figure 2(b)). For Z500 we lose much of the increase in correlation over the oceans seen in the MSLP field, but we do retain regions of increased correlation over eastern and some parts of southern North America, over central Europe and over Siberia. For 2 m temperature (figure 2(c)), the regions of increased correlation are in similar locations to those for Z500, albeit slightly reduced in extent, suggesting that at seasonal timescales and averaged over large regions, temperature anomalies are in part related to large scale circulation. Precipitation (figure 2(d)) shows patchy increases in correlation over central Europe. The more limited region of increased correlation is unsurprising as precipitation fields are noisier than the other fields in figure 2.
Our focus in this analysis is seasonal mean JJA conditions, however, studies suggest that subseasonal variability in summer climate can also be driven by tropical factors. Ding and Wang (2005), for example, find that while phase-locked circumglobal wave patterns are broadly similar in June, August and September, there is a tendency towards shorter wavelength patterns in July. A subseasonal breakdown of changes in correlation for each month separately in our experiments (not shown) does not indicate any systematic variation from one month to another. Instead, there are small variations which appear to be internal noise rather than a systematic shift in pattern from one month to another in all variables.
To build a picture of the dynamical drivers of teleconnections mediated by wave propagation (Sardeshmukh and Hoskins 1988, M21, Wulff et al 2017), it is important to look at features which appear in the mid-level Z500 field as well as the surface fields. We thus discard the feature in the central North Atlantic in figure 2(a) and other smaller features in the midlatitude Pacific. We also note that increases in correlation with GPCP due to TROP for precipitation are noisier and mostly appear confined to the central European band. We therefore identify three regions of increased correlation common to the MSLP, Z500 and surface temperature fields over central Europe, north-eastern North America and northern Siberia (figures 3(a), 4(a) and 5(a)). We will now examine how the tropics influences conditions in these regions.

Figure 3. Wave activity associated with eastern North American temperature anomalies. (a) Regression of STRMFN (contours), 200 hPa divergence (colours) and 200 hPa divergent component of wind (arrows) onto the area averaged timeseries of 2 m T in the box shown. (b) As (a), but with fields regressed onto 200 hPa convergence in the box shown. (c) Regression of STRMFN (contours), 200 hPa RWS (colours) and 200 hPa divergent component of wind (arrows) onto upper-level convergence in the box shown. All units are standardised, with contour intervals of 0.2, grey for negative values and black for positive contours (zero line not shown). Divergence and wind arrows are only shown for a band between  35° N.
Download figure:
Standard image High-resolution image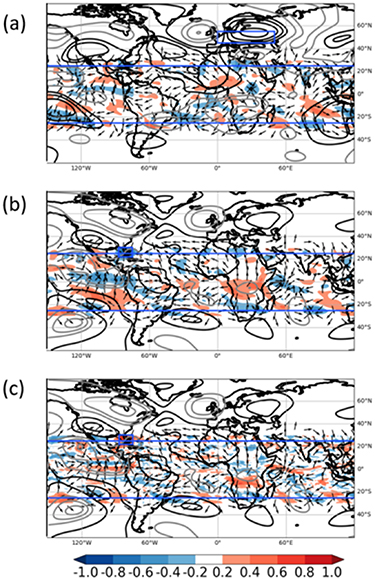
Figure 4. Wave activity associated with central European temperature anomalies. As for figure 3 but for a box over central Europe (figure 4(a)) and over Florida/Eastern Gulf of Mexico(b) and (c).
Download figure:
Standard image High-resolution image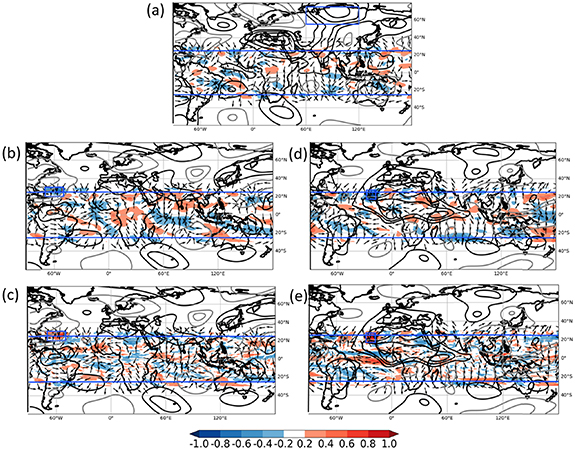
Figure 5. Wave activity associated with North Siberian temperature anomalies. (a) As for figure 3(a), but with fields regressed onto box-averaged 2 m T over Northern Siberia. (b) and (c) As for figures 3(b) and (c) with regressions onto box-averaged divergence over the western subtropical North Atlantic. (d) and (e) As for figures 3(b) and (c) with regressions onto box-averaged divergence over the eastern subtropical North Atlantic.
Download figure:
Standard image High-resolution image
For each region, we regress upper-level fields (TROP minus HCAST) onto area-averaged 2 m temperature (TROP minus HCAST) within the region, analysing difference fields because we want to study the change brought about by relaxation. Figure 3(a) shows the regressed 200 hPa fields for the temperature timeseries area-averaged over a region of northeast North America. The contours for STRMFN anomalies correspond to upper-level wave activity, and we see that the temperature box is co-located with a region of positive STRMFN anomaly (and upper-level anticyclonic flow). This appears to be a node in a wave train propagating from the tropical Pacific east of the date line, with a negative node over western North America, and a positive node slightly southwest at approximately 40° N. Upper-level tropical and subtropical divergence anomalies show a wave train that appears to originate from near a region of upper-level convergence north of the equator between 175° and 140° W.
To confirm that the region we have identified as a putative source is a plausible tropical driver of the waves mediating teleconnections to the midlatitudes, we consider the reverse association, between the upper-level divergence field and STRMFM. We see (figure 3(b)) that we can recreate a wave train with nodes in the same locations as in figure 3(a). While the signal is slightly weaker when we regress onto divergence, the recreation of the wave pattern confirms the source region of the waves affecting eastern North American summer-mean temperatures. We confirm that the wave train originates from a RWS region by plotting the regression of RWS onto upper-level convergence (figure 3(c)). Note that the RWS in this case is not co-located with the region of convergence, but is slightly to the north, in keeping with the earlier observation that RWS occur where divergent outflow/convergent inflow interacts with gradients of absolute vorticity associated with the subtropical jets.
A similar analysis can be made for the central European and northern Siberian regions. For central Europe (figure 4(a)) from France to the Caspian Sea, there is again co-located positive STRMFN anomaly. In this case, it is part of a wave train which extends back towards the Caribbean. In this instance there are several small, regionally localised features in the divergence field, so identifying the precise source of the wave train into Europe is harder and several potential sources have to be investigated. We identify a region of upper-level convergence in the Caribbean, encompassing the east of the Gulf of Mexico and Florida which appears to be the key source region in reproducing the wave train seen in figure 4(a). Regressing STRMFN anomaly onto the timeseries of convergence in this box (figure 4(b)) reproduces the main features of this wave train, with nodes co-located with areas south of the Grand Banks, west of the UK and Ireland, and Finland and northwest Russia, albeit again weaker in magnitude. Note that the node to the west of Ireland is in the region of the centre of action of the EAP identified by Wulff et al (2017). In contrast to their work, this region does not show up as a region of statistically significantly increased correlation in figure 2, however. This difference may indicate that while there is an EA signal related to a wave train from the Caribbean, as a fraction of the total variance this signal is small compared to signals over continental Europe. The different analysis periods may additionally contribute to the differences (1980–2014 rather than the period 1993–2015 used in this study). Again, we confirm this analysis by regressing the RWS field onto the upper-level convergence (figure 4(c)). In this instance, because the source region is in the subtropics near the subtropical jet, the RWS region is almost co-located with the upper-level convergence field.
For northern Siberia (figure 5(a)), a wave train is found extending back over Scandinavia. There are two potential source regions which we investigate. One is identified by following the wave train over the central North Atlantic then south westwards towards the subtropical West Atlantic (figure 5(b)) and the other by following a wave train south over the Mediterranean to a region in the subtropical East Atlantic near Senegal (figure 5(d)). Both regions contribute to wave trains terminating in northern Siberia, with the western source appearing to play a dominant role. The wave originating in the subtropical west North Atlantic (figure 5(b), RWS shown in figure 5(c)) is connected to a region of upper-level convergence to the east of Florida and Cuba. Regressing STRMFN anomaly onto upper-level convergence over the west Atlantic reproduces the wave train connecting the tropics with Northern Siberia (figure 5(b)), albeit once more with a weaker signal than that seen in figure 5(a). The area of divergence off the coast of West Africa in the vicinity of Senegal (figure 5(d)) gives rise to an apparent north-easterly propagating wave, albeit with the nodes over the Mediterranean and Northern Europe seen in figure 5(a) shifted slightly northwards (over the Alps and north of Scandinavia). The node over Siberia is further east than in figure 5(b), and closer to the position of that seen in figure 5(a). It seems plausible that the two waves combine to reinforce one another, with the source in the eastern subtropical Atlantic reinforcing the anticyclonic circulation over the Mediterranean and hence strengthening the wave originating in the western subtropical Atlantic.
The analysis here identifies Pacific and Atlantic sources of midlatitude boreal summer teleconnections, but Ding and Wang (2005) established the existence of a region in the north of the Arabian Sea/Pakistan which serves as source of a circumglobal wave. As can be seen from figure 3(a), 4(a) and 5(a), none of the three major extratropical areas of increased correlation in figure 2 are linked to the subtropical Indian Ocean. There is however a small region of increased correlation in the far east of Northern Siberia in the Z500 and 2 m T fields and we regressed STRMFN onto 2 m T in this region following the method described for figures 3–5 (not shown). Nevertheless, there was no indication of any wave trains originating from this region. One possible explanation of this null result compared to the importance of this region in studies looking at the 10–30 day timescale is that the impacts of shorter-lived phenomena such as the MJO, which are known to act on timescales of days to weeks, are filtered out over seasonal timescales. To confirm this null result, we repeated the pattern correlations for TROP in figure 1 with subsets chosen by seasonal mean MJO amplitude and found no link between MJO strength for JJA and increased pattern correlation.
4. Conclusions
Following progress in explaining tropical teleconnections to the midlatitudes in northern hemisphere winter, this paper extends understanding of tropical teleconnections to northern hemisphere summer. We have used atmospheric relaxation in an ensemble of seasonal length reforecasts to show that the representation of atmospheric circulation patterns (averaged over JJA) is improved by imposing accurate tropical conditions (TROP) relative to including only information about initial conditions (HCAST). Since HCAST shows almost no skill for northern hemisphere summer atmospheric circulation patterns, this demonstrates that summer mean climate has teleconnections from the tropics in a similar way as is seen in northern hemisphere winter. It is furthermore found that this improvement is not uniform across the whole of the midlatitudes but is focussed on three regions—north-eastern North America, central Europe and northern Siberia. In these key midlatitude regions, the maximum increase in correlation in TROP is over 0.4, suggesting that in these locations the tropical atmosphere explains approximately 20% of summer-mean midlatitude variations. Our experimental method allows us to establish which regions are affected by the tropics, without prescribing regions of interest a priori.
For each of the three key mid-latitude regions found in our analysis, we diagnose a wave train emanating from the tropics linked to areas of tropical or sub-tropical upper-level convergence. We confirm that they are genuinely the sources of the teleconnections by recovering the wave pattern in a regression of the local divergence with the extratropical streamfunction. These regions (the subtropical Pacific east of the dateline, the eastern Gulf of Mexico and Florida, and the western subtropical Atlantic) are therefore 'hot spots' for seasonal-mean teleconnections to mid-latitudes.
The wave trains we have identified are similar to those discussed by Manthos et al (2022) in for the summer PNA and Wulff et al (2017) for the summer EAP. Our aim here has been to isolate slowly varying drivers over seasonal timescales. One consequence of this focus is that shorter-lived wave patterns (such as circumglobal teleconnections on the 10–30 day timescale: Ambrizzi et al 1995) may not emerge from this study. This may limit our ability to identify teleconnections originating in the Indian Ocean. However, previous experience in seasonal forecasting in winter suggests that concentrating on the impact of slower drivers, acting at seasonal mean timescales, gives the best chance to overcome internal noise in mid-latitude atmospheric circulation. This, in turn, is where we might expect to see eventual gains in forecast performance. Higher frequency, subseasonal drivers (such as the MJO) are additionally often not themselves predictable across seasonal timescales.
These findings show that the tropics exert a specific influence on seasonal mean conditions in northern mid-latitudes, despite summer teleconnections being weaker than those in winter. Improved understanding of these connections contributes to a better understanding of the climate dynamics of the northern hemisphere summer, which is essential to interpret extreme conditions seen in recent summers.
Acknowledgments
This work was supported by the Met Office Hadley Centre Climate Programme, funded by the Department for Business, Energy and Industrial Strategy. We are grateful for the feedback from our referees in helping us to present this work clearly.
Data availability statement
The data that support the findings of this study are openly available at the following URL/DOI: https://doi.org/10.5281/zenodo.7677004 (Maidens 2023).