
Abstract
Wildfires are a recurrent feature of ecosystems in southern Europe, regularly causing large ecological and socio-economic damages. For efficient management of this hazard, long lead time forecasts could be valuable tools. Using logistic regression, we show that the probability of above normal summer wildfire activity in the 1985–2010 time period can be forecasted as a function of meteorological drought with significant predictability (p  ) several months in advance. The results show that long lead time forecasts of this natural hazard are feasible in southern Europe, which could potentially aid decision-makers in the design of strategies for forest management.
Export citation and abstract BibTeX RIS

Content from this work may be used under the terms of the Creative Commons Attribution 3.0 licence. Any further distribution of this work must maintain attribution to the author(s) and the title of the work, journal citation and DOI.
1. Introduction
Although wildfires are recurrent natural phenomena and an important feature of many ecosystems (Bowman 2009, Moreira et al 2011), their occurrence is commonly perceived as a threat for human activities (Hardy 2005, Milad et al 2011, Bowman 2011, Moreira et al 2011, Thompson and Calkin 2011, Keywood et al 2013). Wildfires are complex phenomena that depend on a multitude of factors (Westerling et al 2006, Xiao and Zhuang 2007, Cruz and Alexander 2010, Krawchuk and Moritz 2010, Macias Fauria et al 2011, Moreira et al 2011). On the one hand, the availability of burnable biomass is a precondition for wildfire activity. On the other hand fuels will only ignite if their moisture content is sufficiently low. While fuel accumulation depends on both natural factors as well as on human interventions (Cruz and Alexander 2010, Bowman 2011, Moreira et al 2011), fuel moisture is governed by meteorological drivers (Westerling et al 2006, Macias Fauria et al 2011). Wildfire management therefore depends not only on knowledge of the amount of burnable biomass, but also on a robust quantification of changes in wildfire risk related to meteorological conditions (Thompson and Calkin 2011). This dependency of fire activity on meteorological conditions is often quantified using so called fire weather indices (Van Wagner 1987, Carvalho et al 2008, Ganatsas et al 2011) but also using statistical techniques that directly relate observed weather conditions to wildfire activity (Thompson and Calkin 2011).
The dependence of wildfires on meteorological conditions can be used to derive long lead time forecasts of fire activity. Such forecasts are either based on fire weather indices derived from weather forecast models (Roads et al 2010), or on statistical techniques that relate present meteorological conditions to fire activity in the future (Westerling et al 2002, Preisler et al 2004, Thompson and Calkin 2011). While both forecasting approaches have been successfully tested for long lead times and continental-scale regions in North America (Westerling et al 2002, Preisler et al 2004, Preisler and Westerling 2007, Preisler et al 2008, Roads et al 2010), their applicability in other fire prone regions is less clear. For example in southern Europe, investigations relating meteorological conditions to climate drivers have usually focused on relatively small areas (Pausas,, 2004, Ganatsas et al 2011, Pausas and Fernández-Muñoz 2012, Pausas and Paula 2012, de Vicente and Crespo 2012, Papadopoulos et al 2013, Turco, et al 2013). While these investigations provide valuable tools for local management, the potential of large-scale and long lead time predictability of wildfire activity in southern Europe has not yet been demonstrated with scientific rigour.
To approach the question of predictability of wildfires, we rely on results showing that large scale droughts significantly affect continental scale wildfire activity (Xiao and Zhuang 2007). This, combined with the finding that drought impacts on Mediterranean fire regimes have recently increased (Pausas and Fernández-Muñoz 2012), suggests that wildfire activity in Southern Europe can be predicted using information on drought. In the following we present a pilot study demonstrating the potential for forecasting above normal wildfire activity as a function of meteorological drought several months in advance.
2. Data sources and processing
2.1. Meteorological drought in southern Europe
Meteorological drought for the 1985–2010 time window was quantified using the well established standardized precipitation index (SPI, McKee et al 1993, Guttman 1999)), which has a long and proven record for drought characterization (e.g. Hayes et al 2010, Mueller and Seneviratne 2012). SPI thus constitutes a comprehensive indicator for fuel moisture and fuel drying. For this study SPI is derived from the E-OBS dataset (version 9, Haylock et al 2008), which provides reliable estimates of precipitation on a 0.5 grid in Europe. In a first step a backward moving average with accumulation time τ is applied to the time series of monthly precipitation. The accumulation time τ is also referred to as time scale in the literature. Here we consider time scales ranging from 1 to 12 months, where
  corresponds to a precipitation anomaly accumulated over 1 month, and
  corresponds to anomalies in precipitation accumulated over 12 months. In a second step the resulting series are standardized for each calendar month separately. For this, a gamma distribution is fitted to the data using maximum likelihood estimation and this distribution is subsequently used to transform the data to the standard normal distribution. The resulting SPIτ
time series thus corresponds to accumulated precipitation anomalies over the past τ months expressed in units of the standard normal distribution. Positive values indicate above normal precipitation amounts, negative values indicate drought conditions. To emphasize large-scale phenomena and to reduce the effects of spatial heterogeneity, the gridded SPI series were spatially averaged to derive time series representing regional anomalies in southern Europe and two sub regions (the Iberian Peninsula and a region representing South Italy & Greece, figure 1).
corresponds to anomalies in precipitation accumulated over 12 months. In a second step the resulting series are standardized for each calendar month separately. For this, a gamma distribution is fitted to the data using maximum likelihood estimation and this distribution is subsequently used to transform the data to the standard normal distribution. The resulting SPIτ
time series thus corresponds to accumulated precipitation anomalies over the past τ months expressed in units of the standard normal distribution. Positive values indicate above normal precipitation amounts, negative values indicate drought conditions. To emphasize large-scale phenomena and to reduce the effects of spatial heterogeneity, the gridded SPI series were spatially averaged to derive time series representing regional anomalies in southern Europe and two sub regions (the Iberian Peninsula and a region representing South Italy & Greece, figure 1).

Figure 1. Mean wildfire occurrence in southern Europe for the 1985–2010 period. (a) Fraction of area burned in NUTS3 units in the region under investigation, including the Iberian Peninsula (red box) and the South Italy & Greece (blue box) sub-regions. The lower panels (b,c,d) show the mean observed total area burned (TAB) for each month.
Download figure:
Standard image High-resolution image2.2. Area burned by wildfires in southern Europe
The employed wildfire data (1985–2010) stem from the European Fire Database (EDF, European Commission 2009, 2011) that has been collected within the framework of the European Forest Fire Information System (EFFIS) and is held by the Joint Research Centre. The EFD contains monthly information on the Total Area Burned (TAB) at the level of NUTS3 units (Nomenclature of Units for Territorial Statistics), which correspond to local administrative units.
The monthly TAB series of the NUTS3 units were first aggregated to time series representing the total area burned in all of southern Europe as well as in the Iberian Peninsula and the South Italy & Greece sub regions (figure 1). These regional series are dominated by a pronounced seasonal cycle, which characterizes wildfire activity in southern Europe (figure 1). As wildfire activity is most pronounced throughout late summer and early autumn (figures 1(b)–(d)) we limit the analysis to July, August and September. To focus on departures of this mean pattern the regional series were converted to monthly anomaly series, by subtracting the mean annual cycle.
Figure 2(a) shows the relation between TAB anomalies and SPI1 in southern Europe. Although a linear regression analysis indicates a significant dependence ( ), the resulting model has only low explanatory power (
 ). The large scatter in figure 2(a) thus shows, that many other factors such as fuel availability, fire suppression, or the stochastic nature of ignition also play a major role for determining regional anomalies in TAB. However, the slope of the regression is significantly smaller than zero (
 ) showing that SPI1 can indeed be used to derive information on wildfire activity in southern Europe. In addition, the regression line separates positive and negative anomalies quite elegantly. Hence the results not only suggest that SPI may not be sufficient to explain the magnitude of anomalies in regional TAB series, but also highlights that information on meteorological drought is sufficient to separate months with below- from months with above normal TAB. In the remainder of this study we focus on this property and therefore convert the anomaly series to binary series indicating above normal (positive) and below normal (zero and negative) wild fire activity in the respective regions.
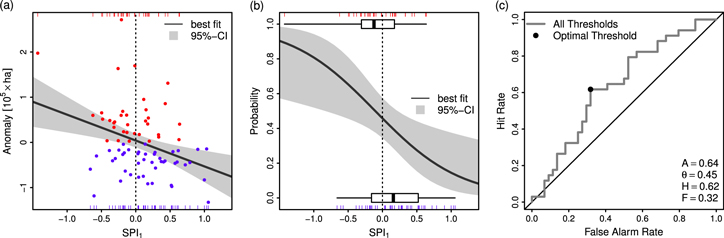
Figure 2. (a) Relation between monthly July, August and September anomalies in monthly areas burned by wildfires and regionally averaged SPI1 in southern Europe. Positive (top, red) and below (bottom, blue) negative anomalies are marked along the horizontal axis. The solid line (shaded area) indicates the best fit (confidence interval) of a linear regression model ( ). (b) Example of a logistic regression, modelling the probability of above normal area burned in July, August and September as a function of SPI1 (line: best estimate, shaded area confidence interval). Boxplots indicate the distribution (median, interquartile range, range) of areal averaged SPI for months with above (top) and below (bottom) average area burned. (c) Receiver operating characteristic (ROC) curves showing the trade-off between hit-rate and false alarm-rate for the predictions for different threshold probabilities of the logistic regression model. The ROC curve is estimated using leave-one-out cross-validation. Curves above the 1:1 line indicate forecasts that are better than random guessing. The black dot marks the location at which the difference between the hit rate and the false alarm rate is maximal. The numbers are: area under the ROC curve (A); the threshold probability that maximizes the difference between the hit rate and the false alarm rate (θ); the hit rate at the optimized threshold probability (H); the false alarm rate at the optimized threshold probability (F).
Download figure:
Standard image High-resolution image3. Modelling above normal fire activity
3.1. Model setup
In the following we aim at modelling the monthly probability of above normal areas burned by wildfires as a function of meteorological drought, characterized by the SPI. For this we rely on logistic regression, an approach that is commonly used for modelling wild-fire risk (see e.g. Thompson and Calkin (2011) and references therein). For the reconstruction, π, the probability of above normal wildfire activity in July, August and September is modelled as function of SPIτ such that:

where the left-hand side is known as the logit transformation. The model parameters a and b are estimated using standard regression techniques within the framework of Generalized Linear Models (GLM) (Venables and Ripley 2002, Zuur et al 2009). SPI accumulation times, τ, ranging from one to 12 months are assessed. Note that only one model is estimated for each (sub) region (figure 1) that is applicable for all three months under investigation. Figure 2(b) shows a logistic regression example, highlighting the models ability to predict the probability of above and below-normal wild fire activity as a function of SPI. This illustrates that the likelihood of above normal wildfire activity increases as meteorological droughts get more extreme and thus highlights the importance of fuel dryness for wildfire forecasting.
The model setup for forecasting the probability of above normal area burned by wildfires is identical, except that SPIτ
of the preceeding one, two, or more months is used. For instance, to predict the probability of above normal fire occurrence in July with one month lead time SPIτ
for June is used. For the same prediction with a two month lead time  of May is used.
3.2. Model selection and validation
An important property of probabilistic models is that they do not predict the occurrence of events (here above normal area burned by wildfires) directly but only the chance that an event occurs. Consequently users are faced with the challenge of deciding at which predicted probability warnings are issued, hereafter referred to as the threshold probability. The nature of probabilistic predictions also implies that the issued warnings capture only a fraction of the observed events, and that some events occur without warning. This fraction of events for which a warning is issued is referred to as 'hit rate' and increases with decreasing threshold probability. On the other hand, decreasing the threshold probability also implies that the 'false alarm rate' i.e. the fraction of issued warnings for which no events occur increases. Depending on the objective, the acceptable hit- and false alarm rates can vary considerably and consequently there cannot be a general recommendation for the threshold probability. To get a comprehensive overview on wildfire predictability in a decision making context we therefore evaluate the hit rate and the false alarm rate for a number of threshold probabilities. The resulting diagram which plots the hit rate as a function of the false alarm rate is referred to as the Relative Operating Characteristics or Receiver Operating Characteristics (ROC) curve (Rego and Machado 1993, Mason and Graham 2002, Wilks 2011) (see figure 2(c)). If the ROC curve is above the identity line the probabilistic forecast is better than random guessing. This can formally be assessed by estimating the area under the ROC curve (later referred to as ROC-Area) which takes values larger than 0.5 in this case and equals 1.0 for the perfect forecast. Interestingly it can be shown that the ROC-Area 'defines the probability that the forecast probability issued for when an event occurs is greater than for when there is no event' (Mason and Graham 2002). In this study ROC curves are estimated at maximum resolution, i.e. that each predicted probability is used once as threshold probability. This allows for a straightforward estimation of ROC-Area (Mason and Graham 2002). In addition, the significance of ROC-Area is tested using a Mann-Whitney U-test (Mason and Graham 2002). The ROC curve can further be used to find the threshold probability, θ, at which the difference between the hit rate and the false alarm rate is maximal (see figure 2(c)). This 'optimal' threshold maximizes the hit rate while minimizing the false alarm rate of the model.
To evaluate predictability independently from the data used for model identification (fitting) we derive the ROC statistics using leave-one-out cross-validation (LOO-CV) (e.g. Hastie et al 2001). For LOO-CV one entry is removed from the data and the statistical model is fitted to the remaining data. The resulting model is subsequently used to predict the value of the entry that has been left out. This procedure is repeated until each entry has been left out once. The ROC statistics are computed from the resulting set of LOO-CV predictions, which is independent from the data used for fitting the model and consequently allows for an unbiased assessment of model performance.
4. Results and discussion
Figure 3 shows the ROC-Area for models predicting the probability of above normal burned area as a function of SPI with different accumulation times and lead times up to 12 months in the three regions under investigation. The best significant models for each region and each lead time are displayed in figure 4 and the corresponding model parameters are shown in table 1. The ROC curves of the selected models, including additional information on model performance are shown in figure 5.
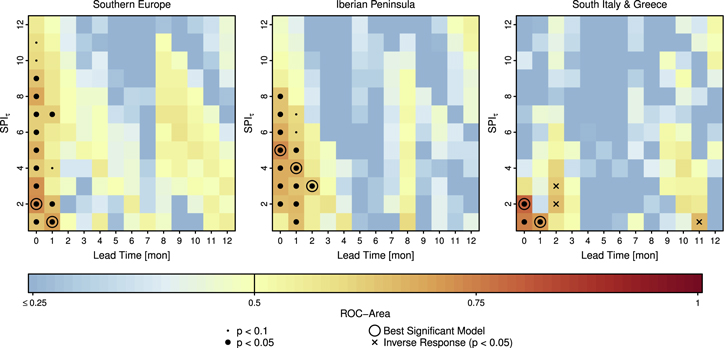
Figure 3. Selection of optimal logistic regression models, using the standardized precipitation index (SPI) at time-scale τ to predict the occurrence of above normal area burned by wildfires in the three regions under investigation and for lead times up to 12 months. Model selection is based on the area under the receiver operating characteristic (ROC) curve, which takes values larger than 0.5 for models that are better than random guessing. The ROC curves are estimated using leave-one-out cross-validation. Large ( ) and small (
 ) dots indicate significance. Circles indicate the best significant model. Crosses indicate significant (
 ) inverse response, i.e. cases where wetter conditions increase the probability of above normal area burned.
Download figure:
Standard image High-resolution image
Figure 4. The best significant logistic regression models, predicting above normal area burned in each region and at different lead times (see figure 3). The individual graphical elements are described in figure 2(b).
Download figure:
Standard image High-resolution image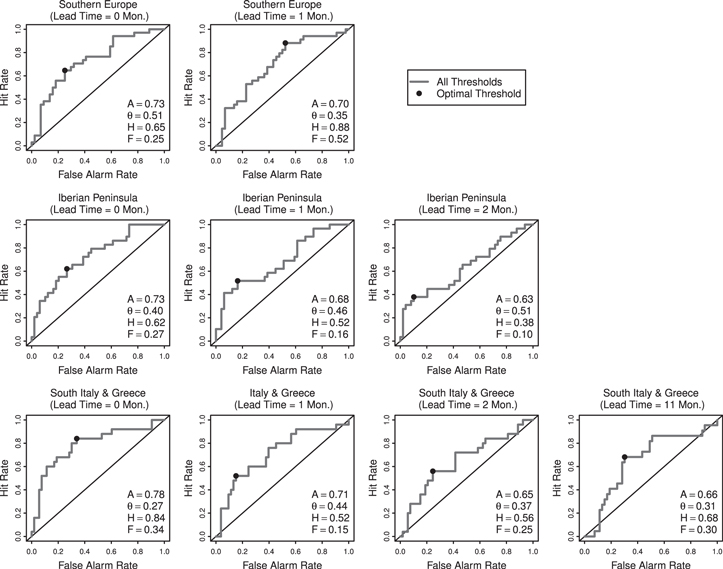
Figure 5. ROC curves of the best significant logistic regression models, predicting above normal area burned in each region and at different lead time (selected in figure 3). The individual graphical elements are described in figure 2(c).
Download figure:
Standard image High-resolution imageTable 1. Parameters of equation (1) for the best significant models (see figures 3 and 4). Values in brackets are the standard errors of the parameter estimates.
| Lead time | a | b | τ |
|---|---|---|---|
| Southern Europe | |||
| 0 |

|

|
2 |
| 1 |

|

|
1 |
| Iberian peninsula | |||
| 0 |

|

|
5 |
| 1 |

|

|
4 |
| 2 |

|

|
3 |
| South Italy & Greece | |||
| 0 |

|

|
2 |
| 1 |

|

|
1 |
| 2 |

|

|
2 |
| 11 |

|

|
1 |
Overall there are significant links between above normal area burned by wildfire and SPIτ
in southern Europe, indicating that information on drought conditions is suitable predictor for wildfire activity. The ROC-Area for reconstruction (lead time: 0 months) is significant for most SPI accumulation times (τ), indicating a robust relation between above normal burned area and meteorological drought. The best performing model is found for  . For forecasts with one month lead time, the ROC-Area decreases slightly and the best performing model is found for
  . For two and more months lead time no significant model is found.
For the Iberian Peninsula, SPI with longer accumulation times have larger effects on the probability of above normal area burned by wildfires. For reconstruction the best significant model if found for  , emphasizing the importance of longlasting drought conditions for wildfire dynamics in this region. This is also reflected in the long SPI accumulation time (
 ) for forecasts with one month lead time. Further, the dependence on prolonged dry episodes is a likely cause for the significant predictability of above normal wildfires in this region up to two months in advance.
In South Italy & Greece the probability of above normal wildfire activity is only significantly related to SPI values with short accumulation times. For reconstruction, the best significant model is found for  and models based on longer SPI accumulations are not significant. Also for this region one month ahead predictions of the probability of above normal burned areas have significant predictability (
 ). Interestingly the logistic regression models for two months lead time in this region exhibit a significant inverse response. In other words, the probability of above normal area burned by wildfires increases if SPI indicates wet conditions two months before the event. This result suggests that a surplus of water in the growing season can cause a larger buildup of burnable biomass, which in turn is a precondition for a large spatial extent of wildfires. Finally the model for eleven months lead time suggests a significant inverse response. This might be related to the fact that low wildfire activity in wet years can lead to a larger buildup of fuel, triggering above normal burned areas in the following year. However, as the interpretation of this forecast with an extremely long lead time is not straightforward we limit further discussions to lead times not longer than two months. While the latter findings are not directly linked to the drought related process of fuel drying, they clearly show that significant predictability of regional wildfire activity can be yielded from antecedent meteorological conditions.
The significant relation of above normal area burned by wildfire and SPI can consequently be used to predict the temporal evolution of the wildfire activity in the near future. Figure 6 exemplifies this, showing predictions of above normal wildfire probabilities in southern Europe with a lead time of one month. Although the temporal evolution of the predicted probabilities and the occurrence of above normal wildfire activity do not match perfectly, the ROC statistics (figure 3(b) and figure 5) clearly show that decisions based on such a forecast are significantly superior to random guessing.

Figure 6. Time series of the probability of above normal area burned by wildfires in southern Europe, predicted with a lead time of one month as a function of SPI1 (see figure 2). Solid lines indicate the predictions in July, August, September; dashed lines only act as visualization aid. Months with above (top, red) and below (bottom, blue) normal area burned are marked along the horizontal axis.
Download figure:
Standard image High-resolution image
5. Summary and conclusions
The presented analysis shows that the probability of above normal wildfire activity in large geo-climatic regions is significantly related to meteorological drought, despite the fact that other factors such as fuel availability or fire suppression also play an important role for wildfire dynamics. We have shown that this relation can not only be used for reconstructing above normal wildfire occurrence in southern Europe, but also to forecast the probability of such occurrences up to two months in advance. Nevertheless it is important to note that these results can only serve as a proof of principle, demonstrating the potential for forecasting wildfire occurrences in southern Europe. Limitations are e.g. the subcontinental perspective, preventing local interpretation and the fact that the fuel availability was not taken into account. Especially the pronounced differences between the Iberian Peninsula and the South Italy & Greece sub regions highlight the fact that different processes contribute to the predictability of wildfires at different locations. Therefore we anticipate that more sophisticated approaches, explicitly considering e.g. the spatial distribution and the buildup of burnable biomass may further improve the seasonal predictability of area burned by wildfires in the considered region. Despite these limitations, the results suggest that predicting the probability of above normal wildfire activity in Southern Europe on the basis of preceding drought conditions is feasible. Such predictions may in turn support regional authorities concerned with wildfire management, in their decision making process.
Acknowledgments
This research contributes to the European Union (FP7) funded project DROUGHT-R&SPI (www.eu-drought.org/, contract no. 282769). We thank the Joint Research Centre of the European Commission, especially Dr Andrea Camia and Dr Jesus San-Miguel, for providing the fire data for the DROUGHT-R&SPI project. We acknowledge the E-OBS dataset from the EU-FP6 project ENSEMBLES (http://ensembles-eu.metoffice.com) and the data providers in the ECA&D project (www.ecad.eu)