
Abstract
Abnormal sea-ice retreat over the Barents Sea during early winter has been considered a leading driver of recent midlatitude severe winters over Eurasia. However, causal relationships between such retreat and the atmospheric circulation anomalies remains uncertain. Using a reanalysis dataset, we found that poleward shift of a sea surface temperature front over the Gulf Stream likely induces warm southerly advection and consequent sea-ice decline over the Barents Sea sector, and a cold anomaly over Eurasia via planetary waves triggered over the Gulf Stream region. The above mechanism is supported by the steady atmospheric response to the diabatic heating anomalies over the Gulf Stream region obtained with a linear baroclinic model. The remote atmospheric response from the Gulf Stream would be amplified over the Barents Sea region via interacting with sea-ice anomaly, promoting the warm Arctic and cold Eurasian pattern.
Export citation and abstract BibTeX RIS

Content from this work may be used under the terms of the Creative Commons Attribution 3.0 licence. Any further distribution of this work must maintain attribution to the author(s) and the title of the work, journal citation and DOI.
1. Introduction
The Barents Sea is an active area for rapid Arctic climate change because of intense air–sea interaction (Smedsrud et al 2013). A significant increase of tropospheric air temperature during fall and winter results from substantial sea-ice retreat and/or change of atmospheric circulation (Serreze et al 2011). It has been thought that an anomaly of turbulent heat fluxes over the Barents Sea induced by the sea-ice reduction during fall initiates remote atmospheric response by triggering stationary Rossby waves (Honda et al 2009). The link between autumn sea-ice extent and atmospheric circulation during winter has been extensively investigated (e.g., Francis et al 2009, Petoukhov and Semenov 2010, Peings and Magnusdottir 2014a). Several hypotheses related to the warm Arctic / cold continent pattern have been summarized by Vihma (2014) (e.g., effects of the stratosphere; Jaiser et al 2013, snow cover; Cohen et al 2012, Orsolini et al 2013, changes of atmospheric circulation; Zhang et al 2012, Liu et al 2012).
Although studies related to the impact of winter sea-ice extent on winter atmospheric circulation are limited, Inoue et al (2012) proposed that the northward shift of storm tracks caused by the sea-ice retreat over the Barents Sea made the Arctic warm and the Eurasian continent cold. Tang et al (2013) showed the same results, and pointed out that the anomalous temperature and sea level pressure (SLP) patterns are sometimes very different from those of the Arctic oscillation. However, the potential remote responses to Arctic sea ice change are hardly identified by atmospheric general circulation models and remain unclear, partly because of model sensitivities and strong intrinsic atmospheric variability (Screen et al., 2013a, 2013b). Peings and Magnusdottir (2014a) revealed that a large number of ensemble members detects a significant signal of cold temperature over midlatitudes, although a linear relationship with the loss of Arctic sea ice was not found. Furthermore, the atmospheric winter response depends strongly on regional and decadal variations of the sea-ice anomalies (Rinke et al 2013). To reduce uncertainties related to the influence of the Arctic sea-ice decline on the weather pattern at northern mid-latitudes (e.g., scatter on the magnitude, timing, and spatial extent of these effects), the recently proposed mechanisms should be assessed quantitatively by focusing on errors arising from observations, reanalyses, and modeling (Vihma 2014). Moreover, the contribution of local and remote effects (e.g., sea ice and sea surface temperature (SST) anomalies) on the Arctic warming is limitedly understood (Screen et al 2012).
Change in atmospheric circulation over the North Atlantic sector is essential to understand causality between sea-ice retreat over the Barents Sea and midlatitude atmospheric circulations in the Eastern Hemisphere, because recent extreme cold weather events in Eurasia are related to weakened cyclones over that sector and high pressure over the North Atlantic Ocean (Zhang et al 2012, Gerber et al 2014). The recent CMIP5 models also revealed that the blocking events, which are likely independent from the sea-ice reduction over the Barents Sea and resultant warming, contributed to occurrence of cold European winters (Woollings et al 2014). Screen et al (2012) suggested that tropospheric warming over the Arctic is remotely driven by SST changes outside the Arctic and resultant increases in poleward heat transport to the Arctic. Peings and Magnusdottir (2014b) showed that the positive Atlantic Multidecadal oscillation (AMO) signal precedes the negative North Atlantic oscillation (NAO) which causes cold temperature over the Europe. The negative NAO is also induced by the positive SST anomaly in the tropics (Ding et al 2014). However, the relationship between atmospheric forcing/response in the North Atlantic and sea-ice variability over the Barents Sea remains uncertain. For example, warm southerly advection is favorable for retreating sea ice over the Barents Sea and warming of air aloft, whereas sea-ice decline would result in warming over the Barents Sea because of anomalous turbulent heat fluxes. In this study, we investigate such a link using a reanalysis dataset and linear baroclinic model (LBM).
2. Data and method
We used 6-hourly reanalysis data of the Climate Forecast System Reanalysis (CFSR) (Saha et al 2010) on a  horizontal grid provided by the National Centers for Environmental Prediction. CFS Version 2 (Saha et al 2014) was used after March 2011. Tropospheric meteorological fields (air temperature, wind fields and geopotential height), SLP, precipitation, latent heat fluxes (LHFs), SST, sea-ice concentration, and ice drift speeds were used. Observed data of daily mean surface air temperature during December at Bear Island (74.52
 N, 19.2
 E), provided by the Royal Netherlands Meteorological Institute (http://eca.knmi.nl), were used to select typical Decembers of anomalously high or low air temperature. In this study, we focus on the December response which represents the early winter condition (autocorrelation between November and December is 0.56). Then composited differences in atmospheric and oceanic fields between warm and cold Decembers were assembled using the CFSR reanalysis.
A LBM, developed by Watanabe and Kimoto (2000), was used to examine steady atmospheric response to a heating anomaly over targeted areas (e.g., Barents Sea). LBM is based on the primitive equations linearized about a basic state on a sphere, at resolution T42L11. Because the dynamical framework is simplified in LBM by removing nonlinearlity in the dynamical atmosphere (i.e., complicated sequence of feedback), the results would be much easily interpreted. This model has been routinely used at the Japan Meteorological Agency to diagnose extreme weather events in Japan (e.g., the Asian winter monsoon (JMA 2012)). In the present study, a spectral primitive equation linearized about the climatological mean state for December 1979–2010, derived from the CFSR reanalysis dataset, was taken as the basic state. As a steady forcing for the LBM, we prepared diabatic heating data  calculated by the CFSR reanalysis (i.e., apparent heat source). Q1 can be estimated through a heat budget analysis based on the thermodynamic equations (Yanai et al 1973).
3. Results
3.1. Atmospheric response to Barents Sea ice
To understand interannual temperature variations in the Barents Sea sector, we focused on time series of surface air temperature anomalies during December at Bear Island (figure 1(a)). Referring to this time series, we selected typical warm and cold Decembers for which the temperature values exceed the 0.8 standard deviation (warm Decembers: 1984, 2004-2009, and 2011; cold Decembers: 1980–1981, 1983, 1987–89, 1995–1996, and 2003). Based on statistics (table 1), the number of the days exceeding 0 C for daily mean air temperature with high cloud cover associated with the southerly warm advection (discussed later) was around three weeks in warm Decembers, whereas in cold Decembers this number was very limited. The difference of daily mean air temperature between warm and cold Decembers is about 10
 C, suggesting that southerly warm advection prevailed during warm Decembers.

Figure 1. (a) Time series of surface air temperature anomalies (deviation from climatology for 1979–2013) in December at Bear Island. Red and blue dots indicate top eight of warm and cold Decembers. Dashed lines show 0.8 standard deviation. (b) Difference map of ice concentration (color) and ice drift (vectors) between warm and cold Decembers defined in (a). (c) Map of correlation coefficients between SST over the Gulf Stream (green box) and air temperature at 950-hPa level (dots indicate area with significance exceeding 99% confidence level).
Download figure:
Standard image High-resolution imageTable 1.
Monthly mean meteorological statistics at Bear Island for warm and cold Decembers. T: mean air temperature, Nday: number of days warmer than 0 C, CC: cloud cover.
T ( C) C) |
Nday | CC (%) | |
|---|---|---|---|
| Warm Decembers | -1.3 | 20 | 80.8 |
| Cold Decembers | -11.2 | 4 | 54.0 |
To compare broad atmospheric circulation patterns, we turn to the difference map of SLP and T950 by subtracting the composites of cold Decembers from those of warm Decembers (figure 2(a)). An anticyclonic anomaly is clearly seen over northern Eurasia. A strong pressure gradient straddles the western Barents Sea and Svalbard, indicating southerly wind anomalies. A positive anomaly of meridional sea-ice drift (southerly component) during warm Decembers likely caused the decrease in sea-ice cover (figure 1(b)). Warming over the Barents Sea sector, which has a pattern reported in previous studies (e.g., Honda et al 2009, Inoue et al 2012), would result from change in horizontal temperature advection in the lower troposphere, but not from change in surface heat flux (figure 3(a)). Although a limited positive LHF anomaly is found along the marginal ice zone of the Barents Sea, a broad negative LHF anomaly extending from that sea to the Norwegian Sea (figure 3(b)) supports the idea that the contribution of sea-ice retreat to the warm anomaly there is small (the horizontal distribution of sensible heat flux is similar to that of LHF). Therefore, it seems that the sea-ice retreat over the Barents Sea is under the control of atmospheric circulation over the Norwegian Sea and upstream region (e.g., North Atlantic sector). The cold anomaly over Eurasia (figure 2(a)) is similar to the pattern found in previous studies (Inoue et al 2012, Outten et al 2013).

Figure 2. Difference maps in (a) sea level pressure (contours) and air temperature at 950 hPa level (shading), and (b) geopotential height at 300 hPa level between warm and cold Decembers. Dotted areas denote significant differences exceeding 90% confidence level. Superimposed arrows indicate horizontal component of wave-activity flux (m2 s−2) at 300 hPa by Takaya and Nakamura (2001).
Download figure:
Standard image High-resolution image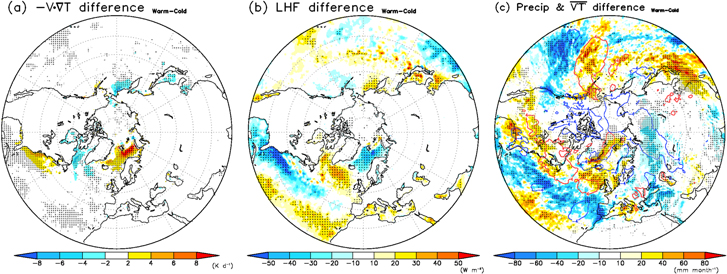
Figure 3. Same as figure 2, but for (a) horizontal temperature advection at 950 hPa over the ocean; (b) latent heat flux over ocean (positive upward); and (c) precipitation (shading) and 8-days high-pass filtered poleward eddy heat flux (contours: ±4 Km s−1) averaged between 1000 hPa and 850 hPa.
Download figure:
Standard image High-resolution imagePositive anomalies of precipitation from the southeast of Greenland to the Barents Sea and negative anomalies over northern Eurasia are consistent with the poleward shift of storm tracks represented by the eight-days high-pass filtered eddy heat flux ( ) averaged between 1000 hPa and 850 hPa (contours in figure 3(c)). Because the cyclones tend to shift poleward (Inoue et al 2012) with less sea-ice coverage over the Barents Sea, it is natural that sea-ice motion contributes to its retreat (figure 1(b)).
3.2. Impact of poleward shift of the Gulf Stream
According to 300 hPa level geopotential height (Z300) anomalies (figure 2(b)), a significant wavelike anomaly from the Barents Sea to Eurasia suggests that stationary Rossby waves are excited around that sea (Honda et al 2009). However, this wave train appears to originate from the east coast of North America, in particular the Gulf Stream and North Atlantic regions, in association with the propagation of wave-activity flux (Takaya and Nakamura 2001) which represents propagation of quasi-stationary Rossby waves (indicated by arrows in figure 2(b)). This pattern has some similarities to the Scandinavian pattern that consists of a primary center of action around the Scandinavian Peninsula, with two other centers of action with opposite sign over the northeastern Atlantic and central Siberia. The importance of SST anomalies over the North Atlantic has been discussed to explain subtle seasonality in the pattern (Bueh and Nakamura 2007).
It has been investigated whether the sharp SST gradient over the Gulf Stream has great impact on tropospheric circulation through diabatic heating over the surface wind convergence zone (Minobe et al 2008). In that study, annual heating over the Gulf Stream was shown to contribute significantly to the westerly jet from North America to Eurasia (figure S5 in Minobe et al (2008)). In winter, strong air-mass modification occurs over the Gulf Stream because of continental cold air (e.g., Bane and Osgood 1989), resulting in a shallow-heating mode there (Minobe et al 2010). Therefore, the possible influence of the SST anomaly over the Gulf Stream on atmospheric circulation over the downstream region would be worth investigating in detail. For example, there is a significant relationship between SST over the Gulf Stream and air temperature in the lower troposphere over the Barents and Norwegian Seas (figure 1(c)). Furthermore, there is a negative correlation over central Eurasia, suggesting that variability of the Gulf Stream influences both areas directly and/or indirectly.
We then focused on the difference of SST over the Gulf Stream between warm and cold Decembers at Bear Island. The composited SST in warm Decembers was clearly higher than that in cold Decembers, especially over the SST front (figure 4(a)). Interestingly, the surface heat flux anomaly (e.g., LHF) was not coherent with the horizontal SST difference pattern (figure 4(b)). A negative flux anomaly (−80 W m−2) was prominent along the eastern US coast, partly because the easterly wind anomaly prevented the cold air mass over the North America from blowing off (vectors in figure 4(b)). The meridional distribution of SST around 41 N (figure 4(d)) agrees with the warming trend from 1950–2008 (Wu et al 2012). Both the poleward shift of SST front but also the increase of SST gradient from 2.9
 C 100 km−1 in cold Decembers to 3.3
 C 100 km−1 in warm Decembers would modify the storm track (contours in figure 3(c)). An upward motion anomaly was anchored over the SST anomaly and was strongest between 900 hPa and 700 hPa (figure 4(c)). This likely caused a difference in formation of clouds and precipitation over the downstream region (figure 3(c)) and consequent condensational heating in the lower troposphere. On the other hand, there was a remarkable downward motion anomaly at the same level over the southern region from 34
 N–38
N–38 N. This anomaly was not statistically significant, partly because of large deviation of the center of action of downward motion among warm Decembers. This descending flow is consistent with reduced precipitation associated with the poleward shift of storm tracks (figure 3(c)). Therefore, a possible reason for the wave train originating from the Gulf Stream region (figure 2(b)) is the poleward shift of the SST front and change of clouds and precipitation.
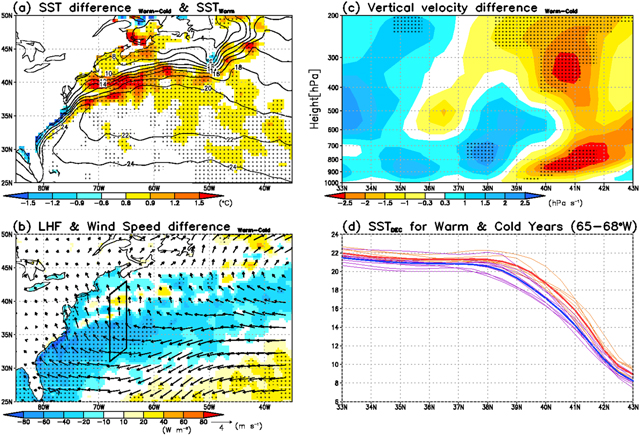
Figure 4. Difference maps of Gulf Stream region between warm and cold Decembers. (a) SST difference over Gulf Stream (color) with SST during warm Decembers (contours); (b) latent heat flux (positive upward) with surface wind (vectors); (c) vertical wind velocity (upward positive color) averaged over rectangular area in (b); and (d) SST as a function of latitude, averaged between 65 W and 68
 W for warm Decembers (thick red) and cold Decembers (thick blue). Each member for warm and cold Decembers is depicted by thin lines.
Download figure:
Standard image High-resolution image3.3. Steady atmospheric responses to forcing over the Gulf Stream
To elucidate the impact of the Gulf Stream heating anomaly on the atmospheric circulation from the North Atlantic to Eurasia, steady atmospheric response was calculated by the LBM. figure 5(a) shows the vertically averaged difference in  from sigma levels 0.9–0.3 between warm and cold Decembers. Although
  includes sensible heat and radiative effects, condensational heating and evaporative cooling are usually dominant in the troposphere. In fact, the distribution over the Gulf Stream is similar to that of precipitation (figure 3(c)), suggesting that the difference in condensational heating was a major factor for the
  difference.

Figure 5. (a) Difference map of vertically averaged diabatic heating ( ) from sigma levels 0.9–0.3 (warm Decembers–cold Decembers). (b) Steady response of SLP (contours) and T950 (shading) to
  difference enclosed by dashed lines in (a). (c) and (d) Same as (b), but for Norwegian and Barents Seas area enclosed by dotted lines, and for Gulf Stream area enclosed by solid lines, respectively.
Download figure:
Standard image High-resolution image
When the  anomaly enclosed by dashed lines in figure 5(a) was entered in the LBM, a strong anticyclonic anomaly developed over the Barents Sea, resulting in a pair of warm and cold anomalies over the Norwegian Sea and Russian coast (figure 5(b)). This pattern is partly similar to its observed counterpart (figure 2(a)), namely the warm anomaly over the eastern US coast and cold anomaly over Eurasia. The experiment forced by the negative
  anomaly only over the Norwegian and Barents Seas (figure 5(c)) suggests that the strong response shown in figure 5(b) came from the cooling anomaly over the Norwegian Sea (-3 K d−1; figure 5(a)). This localized response, however, suggests that the steady response to the heating anomaly does not propagate to the central Eurasia. The other process related to nonlinearlity in the dynamical atmosphere (e.g., blocking), which is not treated in the LBM, would influence the downstream temperature anomaly over Eurasia. When the pair of positive and negative
  anomalies resulting from the poleward shift of storm track was only over the Gulf Steam (area enclosed by solid lines in figure 5(a)), positive SLP and T950 responses were excited over the Gulf Stream and eastern Europa regions (figure 5(d)). They are similar to figure 5(b), although the amplitudes of T950 and SLP are smaller than observations. If the background state is changed from the climatology to the mean state for warm years, as is perhaps more appropriate for the tests being undertaken here, the SLP response increased by over 0.1 hPa over the North Atlantic and Scandinavian regions. This anomalous atmospheric pattern induces southerly wind over the Norwegian Sea, enhancing poleward ice advection as seen in figure 1(b). Further, the cold anomaly over Eurasia was influenced by the Gulf Stream forcing. Therefore, the warm Arctic and cold Siberian pattern was triggered by the change in diabatic heating over the Gulf Stream. From the LBM response, the Barents Sea region is an amplifier of the Gulf Stream remote response.
4. Summary and Discussion
In this study, we showed that the poleward shift of the Gulf Stream influences the increase (decrease) of temperature (sea-ice extent) over the Barents Sea and cooling over Eurasia, through a poleward shift of the storm track over the North Atlantic. Although the relationship between the warm Arctic and cold Eurasia has been discussed in the literature and the Barents Sea is considered a key sector, the impact from the Gulf Stream should be considered for thorough understanding of change in the Barents Sea and consequent cooling over the continent.
Although the sea-ice reduction and change of atmospheric circulation are both important for polar amplification (Screen and Simmonds 2010, Serreze et al 2011), our results have great potential to advance our understanding of the impact of midlatitude ocean variability on the Arctic atmospheric circulation and its feedback to the midlatitude climate system over Eurasia. Because autocorrelation of SST over the Gulf Stream between November and December is greater than 0.95, the SST spatial pattern over the Gulf Stream would be one of the precursors of atmospheric circulations over the North Atlantic sector and sea-ice reduction in the Barents Sea. In this study, we focused on the winter situation, however, the poleward shift of the Gulf Stream might possibly cause extreme events in northern mid-latitudes during other seasons (Barnes 2013, Screen and Simmonds 2013a, 2013b, Screen and Simmonds 2014, Tang et al 2014).
Periods of northerly Gulf Stream paths and warming of the North Atlantic Ocean are associated with the weakening of the Atlantic Meridional Overturning Circulation (AMOC) (Joyce and Zhang 2010, Robson et al 2011). Because the weakening of the AMOC is caused by the negative NAO associated with the positive AMO (Robson et al 2011, Peings and Magnusdottir 2014a), the recent negative phase of NAO would be favorable for weakening of the AMOC, promoting the poleward shift of the Gulf Stream. CMIP5 model output also gives an estimate of 21% reduction in the AMOC strength by year 2100 under the RCP4.5 scenario (Cheng et al 2013). Although several studies have mentioned that the cooling over Eurasia associated with the Arctic sea-ice decline is a transitional response and do not dominate in a warming future climate under very low sea-ice extent condition (e.g., Petoukhov and Semenov 2010, Peings and Magnusdottir 2014a), such a projection could be improved at a certain level if the effect of the poleward shift of the Gulf Stream is taken into account.
Acknowledgements
We thank W Nakanowatari and K Oshima for discussions. The suggestions from two anonymous reviewers and the editor were very helpful. This work was supported by a Grant-in-Aid for Scientific Research (KAKENHI(DC1)2510583) and (KAKENHI(A)24241009) and the Program for Risk Information on Climate Change (SOUSEI program) of Ministry of Education, Culture, Sports, Science and Technology, Japan.