
Abstract
This study contributes to the discussions on the future of the Amazon rainforest under a projected warmer-drier climate from the perspectives of land hydrology. Using IPCC HadGEM2-ES simulations of the present and future Amazon climate to drive a land hydrology model that accounts for groundwater constraint on land drainage, we assess potential hydrologic changes in soil water, evapotranspiration (ET), water table depth, and river discharge, assuming unchanged vegetation. We ask: how will ET regimes shift at the end of the 21st century, and will the groundwater help buffer the anticipated water stress in some places-times? We conducted four 10 yr model simulations, at the end of 20th and 21st century, with and without the groundwater. Our model results suggest that, first, over the western and central Amazon, ET will increase due to increased potential evapotranspiration (PET) with warmer temperatures, despite a decrease in soil water; that is, ET will remain PET or atmospheric demand-limited. Second, in the eastern Amazon dry season, ET will decrease in response to decreasing soil water, despite increasing PET demand; that is, ET in these regions-seasons will remain or become more soil water or supply-limited. Third, the area of water-limited regions will likely expand in the eastern Amazonia, with the dry season, as indicated by soil water store, even drier and longer. Fourth, river discharge will be significantly reduced over the entire Amazon but particularly so in the southeastern Amazon. By contrasting model results with and without the groundwater, we found that the slow soil drainage constrained by shallow groundwater can buffer soil water stress, particularly in southeastern Amazon dry season. Our model suggests that, if groundwater buffering effect is accounted for, the future Amazon water stress may be less than that projected by most climate models.
Export citation and abstract BibTeX RIS

Content from this work may be used under the terms of the Creative Commons Attribution 3.0 licence. Any further distribution of this work must maintain attribution to the author(s) and the title of the work, journal citation and DOI.
1. Introduction
The question of how the extensive rainforests in the Amazon River basin will fare under a changing climate has been a topic of great concern (Shukla et al 1990, Nobre et al 1991, Cook and Vizy 2008, Cox et al 2004, Nepstad et al 2008, Cook et al 2012, Malhi et al 2008, 2009, Huntingford et al 2004, 2008). The Amazon, with a total area of ∼5.4 million km2, is the largest river basin in the world. It holds the world's largest stand of tropical rainforest, provides home to about one quarter of all terrestrial species on earth (Malhi et al 2008), and accounts for ∼15% of global terrestrial photosynthesis (Field et al 1998, Malhi et al 2008). Moreover, evapotranspiration (ET) from the forests is an important driver of global atmospheric circulation (IPCC 2007, Nepstad et al 2008, Malhi et al 2008, Choudhury et al 1998), and the enormous river flow accounts for ∼20% of the total terrestrial freshwater discharge into the world oceans (Nepstad et al 2008). Therefore, the Amazonian forests are an important component of the global terrestrial ecosystem and the climate system (Nobre et al 1991, Cox et al 2004, Betts et al 2004).
Studies have indicated that changes in forest dynamics due to global climate change could threaten the ecological services provided by the forests (Nepstad et al 2008, Davidson et al 2012, Cook and Vizy 2008). In particular, dynamic vegetation models driven by general circulation models (GCMs) suggest that present-day rainforests in the Amazon will be largely replaced by savannah-like vegetation (e.g., Cook and Vizy 2008, Betts et al 2004, Cox et al 2000, 2004, Huntingford et al 2004, Malhi et al 2008, Salazar et al 2007). But the issue of widespread forest dieback in the Amazon (Cox et al 2000, 2004, Oyama and Nobre 2003, Nobre et al 1991, Huntingford et al 2004, 2008, Walker et al 2009) has generated considerable interest as well as controversy in climate and carbon cycle modeling communities and is still under debate (Cook et al 2012).
One of the key mechanisms causing the dieback is the increasing moisture stress associated with projected drying (increased temperature but reduced precipitation) particularly in the eastern and southeastern Amazonia (e.g., Cox et al 2004, Li et al 2006, Cook et al 2012, Malhi et al 2009). The Amazon is one of the major hotspots that may experience warmer but drier dry seasons (Diffenbaugh and Giorgi 2012); based on the previous version of the Hadley Center GCM (HadCM3LC) studies (e.g., Cox et al 2004) have suggested that most of the Amazon will get 8–10 K warmer by the end of the 21st century. Cox et al (2004) suggest that warming will generally lead to temperatures above the optimum for photosynthesis; the higher temperatures combined with substantial decrease in precipitation could reduce ET (e.g., Li et al 2006) resulting in less vegetation growth and decreased biomass even though there are also other factors that contribute to such vegetation carbon reduction mechanism under higher temperatures (Galbraith et al 2010). It is also suggested that the drying-up and dieback are further exacerbated when vegetation feedbacks are represented in the model (Cox et al 2004, Huntingford et al 2004). However, projected future changes in soil moisture in the Amazon vary among different GCMs not only in the magnitude but also in the direction, leading to wide ranging changes in ET (Li et al 2006). In a recent study, Good et al (2013) found that the latest Hadley Center model (HadGEM2-ES) simulates significantly lesser forest dieback compared to its earlier version (HadCM3LC) but they cautioned that the issue of dieback cannot be completely ruled out and remains as a possible scenario of dangerous changes that requires further understanding. Thus, it is still a standing issue as to what extent soil moisture will decrease in response to changes in future climate, and whether it will limit ET and primary production, and lead to fundamental ecosystem shifts.
Increased frequency of extreme events such as long dry-spells and droughts during the past decades (Saleska et al 2007, Lewis et al 2011) and increased dry-season length (Fu et al 2013, Good et al 2013) can worsen plant water stress and further threaten the sustainability of the forests (Nepstad et al 2008, Malhi et al 2009). But it is not clear how susceptible the forests are to such droughts in terms of biomass loss during dry episodes because studies have found that the Amazon forests greened-up during the 2005 drought (Huete et al 2006, Saleska et al 2007) as a result of increased dry-season sunlight which enhances photosynthesis, suggesting that water may not be limiting as trees tap water from deep soil layers (Saleska et al 2007). Even though the idea remains controversial and calls for further investigation (Samanta et al 2010, Tollefson 2010), it is recognized that trees can tap deep water during such dry episodes (Nepstad et al 1994, Hodnett et al 1995, Bruno et al 2006, Jipp et al 1998, Oliveira et al 2005, Juárez et al 2007).
While the forest dynamics and the fate of the Amazon remain poorly understood (Malhi et al 2008, 2009, Phillips et al 2009), climate models indicate that moisture stress will be a dominant feature, particularly in the southern and eastern parts (Phillips et al 2009, Malhi et al 2008). However, the climate models used for future projections treat soil water rather simplistically; soil column is 2–3 m deep and freely drained. It has been suggested that these GCMs tend to overestimate soil water stress (Hasler and Avissar 2007). In fact, most GCMs have the tendency to produce seasonal ET cycle in phase with the seasonal rainfall cycle (see Werth and Avissar 2004) while flux observations and observation-based estimates indicate that ET is not reduced in the dry season over most of the Amazon (e.g., Shuttleworth 1988, Juárez et al 2007, da Rocha et al 2009). The implication of improving land hydrology in GCMs to understanding climate dynamics is further highlighted in a recent study where moisture stress reduction by improving root zone biophysics in a GCM increased precipitation through enhanced moisture recycling and dampened drought intensity during dry seasons in the Amazon (Harper et al 2014).
Our recent synthesis of observations and modeling studies suggest that the groundwater reservoir may play an important role in buffering Amazon soil and surface water stores through the multi-month dry season under present-day climate (Fan and Miguez-Macho 2010, Miguez-Macho and Fan 2012a, 2012b, Pokhrel et al 2013). We found that groundwater is within the top meters of land surface over large regions of the Amazon, which impedes wet-season drainage leading to large soil water stores before the dry season arrives; the shallow groundwater also maintains upward capillary flux to the root zone supporting ET in the dry season; in southeastern Amazonia where the water table is deep (>20 m) under the plateaus, there is a multi-month delay between peak rainy season and peak water table height, the latter drains to the valleys in the dry season and supports valley ecosystems (e.g., gallery forests). These groundwater buffering effects have been widely observed across the Amazon (see review in Miguez-Macho and Fan 2012a, 2012b), and our modeling studies attempted to assess their basin-wide importance.
In this study, we explore whether the groundwater buffering effect under the present climate can help reduce the anticipated water stress under the future climate projected by IPCC (Intergovernmental Panel on Climate Change) climate model simulations for the end of the 21st century. We report our results in two steps. First, using a model that includes the groundwater, we explore the hydrologic response to the future climate, esp. changes in ET and in the controls of ET (atmospheric demand versus soil water supply). Second, we compare the results with those from a model disabling the groundwater and letting soil water drain freely; the latter is a common approach in models used in the future Amazon studies mentioned earlier. This will allow us to isolate the groundwater effect. We seek answers to the following questions: What are the likely hydrologic responses to the projected changes in precipitation and temperature? Where and when will significant soil moisture stress most likely occur across the Amazon? Will there be regime shifts in ET control, e.g., from demand-limited to supply-limited, in parts of the Amazon? And finally, can the groundwater buffering effect offer any relief to the projected water stress?
2. Methods
2.1. The land hydrology model
We use the coupled groundwater-surface water model LEAF-Hydro-Flood (LHF), described in detail in Miguez-Macho and Fan (2012a, 2012b), and briefly highlighted here. Figure S1 illustrates the key physical processes represented in LHF and the history of its development. The core is LEAF (Land Ecosystem-Atmosphere Feedback (Walko et al 2000)), the land model of RAMS (Regional Atmosphere Modeling System), color-coded orange. We developed LEAF-Hydro, color-coded blue, for studies of N. America (Fan et al 2007, Miguez-Macho et al 2007), by adding a prognostic groundwater store and allowing (1) the water table to rise and fall or the vadose zone to shrink or grow, (2) the water table, once recharged by soil drainage, to relax through discharge into rivers within a grid cell, and lateral groundwater flow among adjacent cells, leading to convergence to low valleys, (3) two-way exchange between groundwater and rivers depending on hydraulic difference and river-groundwater contact area, representing both loosing (to groundwater) and gaining (draining groundwater) streams, (4) river routing to the ocean as kinematic waves, and (5) setting sea level as groundwater head boundary condition, hence allowing sea level to influence coastal drainage. In our recent studies over the Amazon (Miguez-Macho and Fan 2012a), we further developed LHF, color-coded green, by introducing a river-floodplain routing scheme that solves the full momentum equation of open channel flow, taking into account the backwater effect (the diffusion term) (e.g., Yamazaki et al 2011) and the inertia of large water mass of deep flow (acceleration terms) (e.g., Bates et al 2010) that are important in the Amazon; this new module allows river discharge to be influenced by river stage downstream or the sea level, slowing down or even reversing flow locally as widely observed (Meade et al 1991). The model was tested with observed water table, river discharge, and seasonal flooding (Miguez-Macho and Fan 2012a), soil moisture and ET (Miguez-Macho and Fan 2012b), and terrestrial water storage (TWS) change using GRACE (Pokhrel et al 2013), over an 11 yr (2000–2010) simulation at 4 min time steps and 1 arc-min grids (∼2 km), forced by ECMWF Reanalysis Interim Product (ERA-Interim).
2.2. Forcing data and simulation settings
Our earlier simulations were forced by ERA-Interim, which is close to observations so that the model can be validated. Here, to assess the likely hydrologic changes over the Amazon from the present to the end of the century, we use model simulated climate from the same GCM for both the present and the future. We use 3 hourly meteorological forcing from the Hadley Center climate model, the Global Environmental Model version 2 (HadGEM2-ES), for the IPCC fifth Assessment Report (AR5). The data are obtained from the archive of the Coupled Model Intercomparison Project phase 5 (CMIP5). We chose the Representative Concentration Pathways Scenario 8.5 (RCP8.5) leading to ∼8.5 W m−2 (∼940 ppm of CO2) by the end of the 21st century (Moss et al 2010, Riahi et al 2011). We select two 10 yr time windows with available 3 hourly model output and about a century apart to represent the end of the 20th and 21st centuries, hereafter denoted as 20C and 21C, respectively. In the present study, we use a single GCM because it was not feasible to conduct multi-model simulations due to high computational demand of our hydrological model.
HadGEM2-ES was selected for several reasons. First, the Hadley Center models have been among the most accurate GCMs in simulating the present-day rainfall and temperature over the Amazonia (see Gedney et al 2000) because modeling climate change and impacts in this region has been a long-standing priority at the Met Office (Cox et al 2004). The recent versions of the Hadley model stand out amongst IPCC fourth assessment report (AR4) and AR5 models in accurately reproducing present-day climate in the Amazon for both dry and wet seasons (Li et al 2006, Yin et al 2013). Yin et al (2013) concluded that the HadGEM2-ES outperforms others especially for the surface conditions; it better captures the spatial distribution of rainfall over the Amazon than other models, which tend to significantly underestimate rainfall during the dry and transition seasons (JJA and SON). Cox et al (2004) noted that the model also reproduces the observed annual mean temperature over central Amazon remarkably well. Second, the use of Hadley Center model allows direct comparisons of our findings with previous studies on the Amazon forest dieback, most of which are based on the same model (e.g., Cox et al 2004, Betts et al 2004, Huntingford et al 2004). Third, the HadGEM2-ES is one of the few GCMs that have archived sub-daily output in the CMIP5 database for time windows selected for this study; the sub-daily data are necessary for adequately modeling land hydrology.
Supplementary figure S2 compares modern-day spatial distribution of annual and seasonal precipitation from HadGEM2-ES with the observations (first column) from the Climate Research Unit (CRU). HadGEM2-ES captures the broad patterns of observed rainfall with certain over-estimation in regions, except for the northeast where the model has a dry bias particularly during wet seasons. To examine the temporal patterns, we compare the precipitation averaged over sub-basins of the Amazon (figure S3) with CRU and Global Precipitation Climatology Center (GPCC) data (figure S4). Over the Amazon upstream of Obidos gauging station, the model over-estimates precipitation particularly in the wet season due largely to the wet bias in the southwest (Madeira, Purus, and Solimoes). In the southeast (Tapajos, Tocantins, and Xingu) the model accurately simulates seasonal precipitation. This fact is important because this region already experiences dry-season water stress and is the center of most of the concerns over the future Amazon; that the Hadley model does reasonably well here at the present lends confidence to its future projections and the resulting hydrologic changes. The model also reproduces the general patterns of annual mean air temperature well but it has a general cold bias (figure S5) in the southern regions and the foothills of the Andes.
Model simulations are conducted over a 10 yr period near the end of the 20th and the 21st century respectively with typical ranges of wet and dry years (figure S6). To isolate groundwater effect, we use two model treatments, LHF with fully coupled groundwater (figure S1), and free drainage (FD) without groundwater allowing free gravity drain at the bottom of the 4 m soil column. This gives a total of four simulations hereafter referred to as LHF-20C, LHF-21C, FD-20C and FD-21C. Simulations are conducted at one arc-minute (∼2 km) grids and 4 min time steps as in Miguez-Macho and Fan (2012a, 2012b). The coarse grid meteorological forcing data from HadGEM2-ES are interpolated into the land model grid and an altitude correction is applied based on local topography. To account for sea-level change, which is the lateral boundary condition for groundwater and river water surface elevation, we adjust the topography by the 0.62 m mean sea-level rise by the end of the 21st century projected by the IPCC-AR5 (Church et al 2013).
The 20C simulations were first initialized with the results from Miguez-Macho and Fan (2012a) forced by ERA-Interim. Because we use different forcing here, we spin up the model to reach a new equilibrium under the new climate by conducting repetitive runs for the year 1990. The water table depth (WTD) requires a longer time to spin up, and we manually accelerated grid cells with large adjustments. The 21C runs also require spin-up as the model climate shifted significantly over the century. We start at the end of the 20C results and run the model repetitively for the year 2090.
We note that the present-day vegetation, as described by Eva et al (2004), is assumed unchanged for the 21C simulations. It is likely that vegetation will shift over the century in response to a warmer and drier climate, most likely toward more draught tolerant or avoidant species. The latter would in general transpire less with reduced need for tapping deep water stores (without changing rooting depth in models), and therefore our simulation assuming unchanged vegetation may over-estimate the groundwater buffering effect. On the other hand, the significant reduction in precipitation in northeastern Amazon as projected by HadGEM2-ES will likely cause a significant drop in the water table (>10 m), as confirmed later, making groundwater inaccessible regardless of model vegetation types. Since the extent and nature of vegetation shift is much debated, to keep the analysis simple and tractable we assume unchanged vegetation for the 21C runs.
2.3. Estimation of potential evapotranspiration
To understand the drivers of future ET changes, we separate ET control by atmospheric demand as quantified by potential evapotranspiration (PET) (Brutsaert 2005), from ET control by soil moisture supply. We estimate PET using the Penman–Monteith equation (Monteith 1965) at daily intervals which are then averaged to monthly values for use in the analysis. All meteorological input data are obtained as daily averages of the 3 hourly forcing used in this study. The ground heat flux is set as zero because it is negligible for daily time steps (Allen et al 1998). The resistance terms are estimated following the PET scheme in the VIC model (Liang et al 1994). The leaf area index and all necessary surface and vegetation parameters are the same as in LHF described in detail in Miguez-Macho and Fan (2012a).
3. Results
3.1. Evaluation of streamflow simulations
The model has been validated against observations in our earlier studies; Miguez-Macho and Fan (2012a) compared with observed daily streamflow at ten gauging stations, seasonal WTD at eight sites, and seasonal flood extent with satellite observations; Miguez-Macho and Fan (2012b) compared with observed plant available soil moisture at seven sites (multiple depths), and ET at six flux-tower sites across the Amazon; Pokhrel et al (2013) evaluated the TWS change with observations from the GRACE (Gravity Recovery and Climate Experiment) satellite at whole basin and sub-basin scales. These comparisons with observations of different hydrologic stores and fluxes at a range of scales suggested that the model well reproduces the spatial-temporal features of hydrologic fluxes and stores, but as expected the results are sensitive to the forcing, particularly precipitation; too much rain translates into too much river flow and ET, because no model parameters are tuned to match observations (Miguez-Macho and Fan 2012a, 2012b).
Since the climate forcing data used here is different than that in our previous studies, we briefly examine how the model reproduces observed streamflow in the LHF-20C run. Figure S7 shows that the simulated daily streamflow agrees well with observations where the Hadley precipitation is accurate, but too high where the former is too high (compare with figure S4). Because our focus is hydrologic changes (differences) over the century, we expect that these biases will matter less to our results.
3.2. Hydrologic responses to changes in Amazon climate
Changes in the climate forcing over the century, particularly in seasonal precipitation and temperature as simulated by HadGEM2-ES, are shown in figure S8 (as 21C minus 20C). Precipitation changes vary among different regions and seasons; the northern and eastern regions are significantly drier throughout the year while the southern and western regions receive more rain during the austral summer and less during austral winter. Up to 8 K warmer temperatures are widespread particularly in Austral spring (SON). These large shifts in Amazon climate will likely result in significant shifts in land hydrology.
Figure 1 plots the changes in seasonal mean ET, PET, top 2 m plant available soil water (PAW), and WTD from LHF-20C to LHF-21C runs (full groundwater, 21C minus 20C). The sharp linear feature reflects the strong gradient in precipitation (increasing east to west) and wind field or drying power (decreasing east to west) over the region. It is simply the result of representing a steep, continuous gradient with a few discrete color bins. We note the following. First, in southwestern Amazon, ET (first row) will increase in response to increased PET (second row) (due to higher temperatures), despite the reduced precipitation and drier soils (third row). This rise in ET in direct response to a rise in PET suggests that the ET in the western Amazon will remain PET or atmospheric-demand limited.

Figure 1. Changes in LHF simulated seasonal evapotranspiration (ET), potential evapotranspiration (PET), 0–2 m plant available soil water (PAW), 2–4 m PAW and water table depth (WTD), calculated as the difference between the climatological mean for 21C (2090–2099) and 20C (1991–2000).
Download figure:
Standard image High-resolution imageSecond, in northeastern Amazon, and in southeastern Amazon dry season, ET will decrease in response to the much reduced precipitation and drier soils (third row), despite the higher PET demand (second row). This drop in ET in response to drops in soil water suggests that here, ET will remain or become more soil–water-supply limited.
Third, some regions may undergo a regime shift in terms of ET control. Figure 2 plots the ET/PET ratio, as a simple measure of relative importance of PET versus soil water control. When ET is less than 25% of PET (ratios of 0–0.25), soil water-limitation is strong and the areas belonging to this regime may expand by the end of 21 century. The same is true for the moderately water-limited regions (0.25–0.5 category), particularly in southeastern Amazon in the dry season.
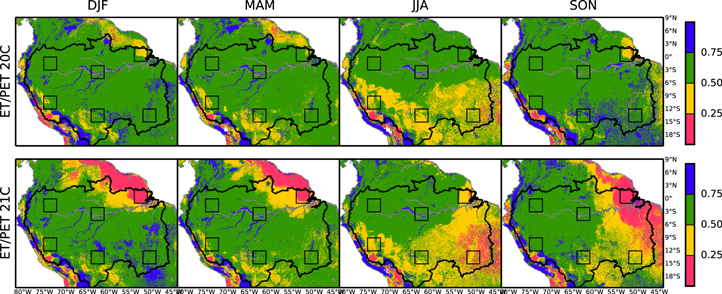
Figure 2. LHF simulated ET/PET ratio for 20C and 21C. Boxes indicate regions for time series in figure 4, which are denoted as NW, CE, NE (top 3 from left to right) and SW, SO, SE (bottom 3 from left to right).
Download figure:
Standard image High-resolution imageChanges in soil-water limitation are further examined as seasonal time series in figures 3–4, as PAW in 0–2 m and 2–4 m soil depths and ET fluxes. Averaged over the Amazon (figure 3), mean monthly ET (green) shifted upward from ∼92 mm to ∼116 mm over the century, despite that PAW shifted downward in both shallow (blue) and deep (red) soil stores. That is, on the whole, Amazon ET remains limited by the atmospheric demand (PET), and the future rise in PET causes a direct rise in ET. However, there are substantial spatial variations across the Amazon. Figure 4 plots the same time series but over six 3° × 3° windows (location in figure 2). ET shifted upward in all regions except NE, which is the only case where ET shifts in the same direction as PAW (all downward) indicating stronger soil–water limitation.
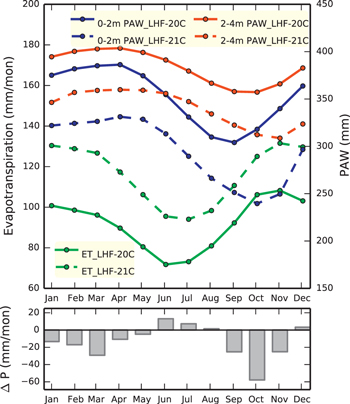
Figure 3. Seasonal cycle of the climatological mean total ET and PAW averaged over the Amazon river basin from the 20C and 21C simulations using LHF. The bottom panel plots the changes in the climatological mean precipitation from HadGEM2-ES, also averaged over the Amazon.
Download figure:
Standard image High-resolution image
Download figure:
Standard image High-resolution imageFourth, as evident in figure 4, across the Amazon, the amplitude of seasonal cycles in soil moisture and ET may become greater in 21C, largely due to a drier dry season. There is also a phase shift in the southeastern Amazon; the 21C (dashed lines) soil water continued to decline in September–October–November, pushing the minimum to a later time. These shifts have been anticipated based on studies of recent trends (e.g., Marengo et al 2011, Fu et al 2013).
Fifth, the water table may drop by as much as 10 m over the eastern Amazon (fourth row, figure 1, actual WTD shown in figure S9), which will directly translate into reduced river discharge in these regions, because little surface runoff occurs in the Amazon and the rivers are largely supplied by groundwater discharge (see review in Miguez-Macho and Fan 2012a). This is shown in figure 5 where we plot the mean seasonal discharge for 20C and 21C at the ten gauging stations in the Amazon (figure S3). Significant river flow reduction may be expected across the Amazon, but the worst reduction may be seen in the southeast (Tapajos and Xingu drainage) where more of the limited rain will go toward meeting the higher PET demand. These changes are summarized in table 1 as differences (mm) and % change.

Figure 5. Simulated mean seasonal streamflow at the ten gaging stations in the Amazon shown in figure S3.
Download figure:
Standard image High-resolution imageTable 1. Simulated 20C to 21C changes in annual ET and river runoff, as differences in mm yr–1 and % change in parentheses.
| LHF 21C-20C | ET | Runoff |
|---|---|---|
| Entire Amazon | 293 (27) | — |
| Above Obidos | 397 (38) | −436 (−28) |
| Above Manaus | 433 (41) | −390 (−23) |
| Japura | 454 (44) | −479 (−22) |
| Madeira | 337 (34) | −291 (−22) |
| Negro | 506 (45) | −726 (−32) |
| Purus | 490 (48) | −248 (−22) |
| Solimoes | 370 (39) | −96 (−6) |
| Tapajos | 320 (28) | −446 (−59) |
| Tocantins | 75 (7) | −201 (−32) |
| Xingu | 193 (16) | −512 (−66) |
3.3. Potential groundwater buffering
We now explore whether the presence of a groundwater reservoir will make any difference to the simulated hydrologic response to future Amazon climate shifts. Groundwater response to climate forcing is known to be delayed and dampened, and through multiple mechanisms it provides a notable buffering effect in the southeastern Amazon (Miguez-Macho and Fan 2012a, 2012b, Pokhrel et al 2013) where dry-season ET is water-limited under the present climate.
We contrast the results between LHF-21C (with groundwater) and FD-21C (without); the latter allows free soil drainage and instant discharge into rivers within a cell. Figure 6 (first row) presents the difference between seasonal mean ET at the end of 21 century (LHF-21C minus FD-21C). We note the following. First, in the western Amazon, the presence of groundwater leads to little or no ET difference (light yellow patches) despite the wetter soils (second and third row), marking areas with no soil water limitation. Second, ET is higher in the FD run over the floodplains (red patches), because in the freely drained model the drained soil water is instantly placed in the rivers causing fast runoff and more flooding (fourth row) and higher open water evaporation in FD. Third, during the respective hemispheric dry season, ET is significantly higher in the groundwater run, marking areas-seasons where soils are wetted from below; groundwater-enabled ET can be up to 50 mm mon−1.
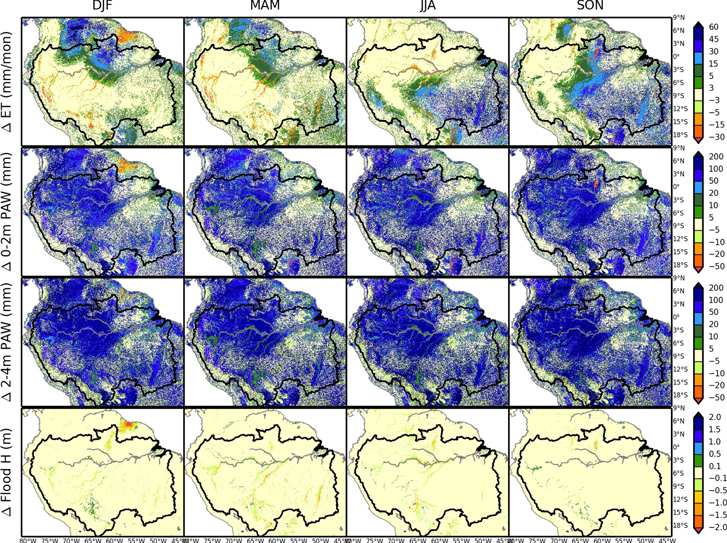
Figure 6. Difference between LHF-21C and FD-21C mean seasonal evapotranspiration, 0–2 m PAW, 2–4 m PAW, and flood height.
Download figure:
Standard image High-resolution imageFigures 7 and 8 compare the mean seasonal time series for LHF (solid lines) and FD (dashed lines) for 21C. Averaged over the Amazon, the difference in ET (green) is particularly large in July through November, the southern dry season and the season of soil water control on ET; these notable differences of up to 10 mm mon−1 come from the large differences in the central and northwestern Amazon (figure 6) associated with the higher PAW in LHF; the differences in both 0–2 m and 2–4 m PAW are the largest during the dry seasons. On an annual scale the Amazon basin average ET in LHF is ∼67 mm (∼5%) higher than in the FD (table 2). Figure 8 shows the same time series over the six windows (location in figure 2). Soils are wetter with the groundwater in all regions, but ET is enhanced only where soil water is limiting such as in the southeastern Amazon.

Figure 7. Seasonal cycle of the climatological mean total ET and PAW averaged over the Amazon river basin from the LHF-21C and FD-21C simulations.
Download figure:
Standard image High-resolution image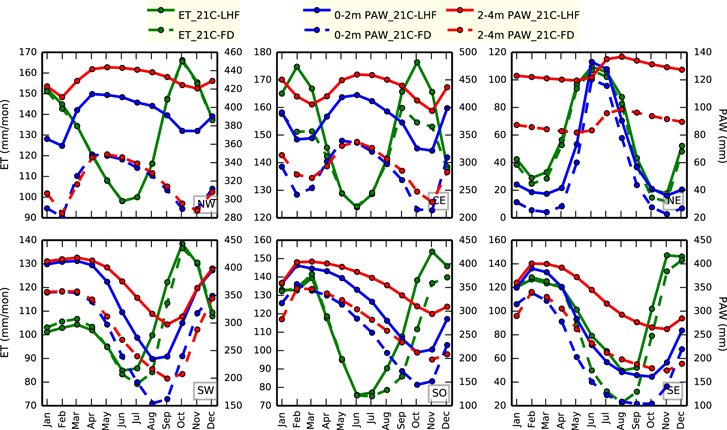
Download figure:
Standard image High-resolution imageTable 2. Differences in ET and river runoff (mm yr–1) as simulated by LHF (with groundwater) and FD (without), with % difference in parentheses.
| 21C LHF-FD | ET | Runoff |
|---|---|---|
| Entire Amazon | 67 (5) | — |
| Above Obidos | 43 (3) | −52 (−4) |
| Above Manaus | 35 (2) | −43 (−3) |
| Japura | 16 (1) | −35 (−2) |
| Madeira | 45 (4) | −40 (−4) |
| Negro | 39 (2) | −75 (−5) |
| Purus | 41 (3) | 10 (1) |
| Solimoes | 4 (0) | 23 (2) |
| Tapajos | 112 (8) | −117 (−28) |
| Tocantins | 146 (14) | −122 (−22) |
| Xingu | 110 (8) | −71 (−21) |
Figure 9 compares river discharge, and again the largest differences are in the southeast where groundwater subsidizes ET at the expense of river discharge in the LHF run. Here, wet-season rain is saved in the groundwater store (less wet-season runoff) and released in the dry season (more dry-season runoff), and annually the reduced river discharge reflects the enhanced ET flux. Table 2 summarizes the LHF and FD differences in ET and runoff (mm).
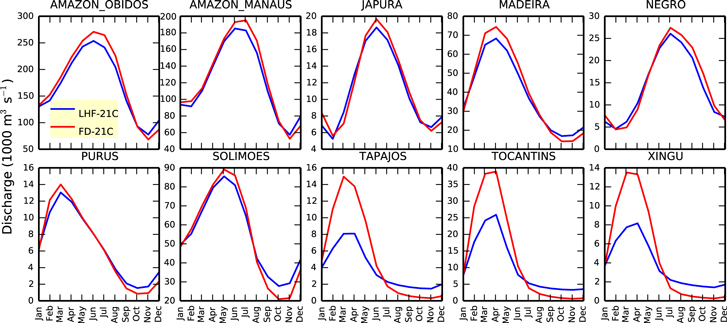
Figure 9. Simulated streamflow by LHF-21C (with dynamic groundwater) and FD-21C (free drainage).
Download figure:
Standard image High-resolution image4. Summary of findings
Using HadGEM2-ES simulations of the present and future Amazon climate to drive our land hydrology model (LHF) we assess the potential changes in the hydrologic conditions including ET, soil water, WTD, and river discharge. We conducted four 10 yr long hydrologic model simulations, at the end of 20th and 21st century, with and without the groundwater.
Our results suggest that, first, over most of the western and central Amazon, ET will increase in response to increased PET in warmer temperatures, despite decreasing soil water; that is, ET in these regions will likely remain atmospheric-demand limited; and this ET increase is accompanied by a widespread reduction in river discharge. Second, in the eastern Amazon, ET will decrease in the dry season in response to decreasing soil water, despite the increasing PET demand; that is, ET in these regions will remain or become more water-supply limited; and here river flow reduction is most pronounced. Third, the spatial extent of water-limited regions will likely expand in the southeast, and the hydrologic dry season, as indicated by the soil water store, will become drier and longer.
We then contrasted the above results (LHF) with the runs without groundwater (FD), to assess if groundwater can provide some relief to the projected water stress. The presence of groundwater will indeed make soil wetter across the Amazon, but it only enhances ET where and when soil water is limiting, such as in the southeastern Amazon. The change in ET over the century differs by only 5% over the whole Amazon between LHF and FD runs, but more notably (8%–14%) in the southeastern basins of Tapajos, Tocantins, and Xingu (table-2).
It is important to note that these results are based on HadGEM2-ES model, which underestimates present-day rainfall in the northeast (figure S2) and projects further decline in the future. There are substantial variations among different models in the magnitude and even the direction of precipitation change in the future Amazon (e.g., Malhi et al 2008, Meehl et al 2007, Cook et al 2012, Yin et al 2013). However, a tendency toward a drier dry-season in the east and wetter wet-season in the west is common (see Malhi et al 2008). Even in the northeastern Amazon, observations have suggested a consistent decline in precipitation since the mid-1970s (Marengo 2004), which if continued into the future could result in significant decline as suggested by HadGEM2-ES, and thus the latter forecast is not entirely inconceivable.
We also note that we assume unchanged vegetation for the 20C and 21C runs. Since the vegetation will likely shift toward more drought tolerant species in the eastern Amazon, we may over-estimate 21C ET and the reliance on groundwater in the dry season using present-day vegetation. However, since the water table declined far below the depth to influence vegetation (water table drop more than 10 m in northeastern Amazon), vegetation types and needs did not affect the results.
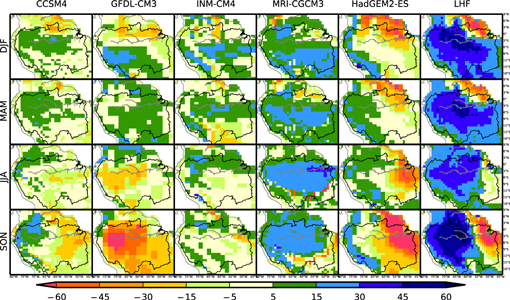
Our results are in general agreement with climate model projections of decreasing soil moisture at the end of the century, but differ from them regarding the degree to which it limits ET. Figure 10 compares the simulated ET changes among five well known GCMs employed by the IPCC AR5 including HadGEM2-ES. Our model (rightmost column) suggests large ET increase over the western and central Amazon, despite that it is forced by the Hadley climate (fifth column). This part of the Amazon is relatively low and flat, and the shallow groundwater in our model prevents fast drainage and allows the rain to stay in the soil longer for later use by plants; and as PET demand increases by the end of 21st century, the wet soil can meet the higher demand. This is also simulated by other models but the magnitude is far less. Our results are in line with that of Harper et al (2014) who concluded that the reduced soil moisture stress in the model with improved soil biophysics significantly increases ET, consequently increasing moisture recycling and stronger precipitation in the region. This large increase in ET as simulated by our model may also have implications to downwind precipitation in the La Plata basin, much of which originates as ET from the Amazon (e.g., van der Ent et al 2010).
Figure 10. Changes in seasonal evapotranspiration from 20C (1991–2000) to 21C (2090–2099) simulated by five different GCMs and our fully coupled groundwater model (LHF), forced by HadGEM2-ES (first column). All model results have been re-sampled/aggregated to one degree grids for comparison.
Download figure:
Standard image High-resolution image
Acknowledgement
Funding comes from NSF (NSF-AGS-1045110), US EPA (EPA-STAR-RD834190) and the European Commission FP7 (EartH2Observe). Computation used the NCAR's Computational and Information Systems Laboratory, sponsored by NSF and other agencies. We thank Haibin Li for the support with GCM data download and processing.