

Abstract
Amazon forests play an important role in the global carbon cycle and Earth's climate. The vulnerability of Amazon forests to drought remains highly controversial. Here we examine the impacts of the 2015 drought on the photosynthesis of Amazon forests to understand how solar radiation and precipitation jointly control forest photosynthesis during the severe drought. We use a variety of gridded vegetation and climate datasets, including solar-induced chlorophyll fluorescence (SIF), photosynthetic active radiation (PAR), the fraction of absorbed PAR (APAR), leaf area index (LAI), precipitation, soil moisture, cloud cover, and vapor pressure deficit (VPD) in our analysis. Satellite-derived SIF observations provide a direct diagnosis of plant photosynthesis from space. The decomposition of SIF to SIF yield (SIFyield) and APAR (the product of PAR and fPAR) reveals the relative effects of precipitation and solar radiation on photosynthesis. We found that the drought significantly reduced SIFyield, the emitted SIF per photon absorbed. The higher APAR resulting from lower cloud cover and higher LAI partly offset the negative effects of water stress on the photosynthesis of Amazon forests, leading to a smaller reduction in SIF than in SIFyield and precipitation. We further found that SIFyield anomalies were more sensitive to precipitation and VPD anomalies in the southern regions of the Amazon than in the central and northern regions. Our findings shed light on the relative and combined effects of precipitation and solar radiation on photosynthesis, and can improve our understanding of the responses of Amazon forests to drought.
Export citation and abstract BibTeX RIS
1. Introduction
The Amazon rainforests are one of the largest, most productive, and most biodiverse terrestrial ecosystems, and account for more than half of the Earth's tropical rainforests (Nölscher et al 2016, Saatchi et al 2011). Amazon forests play an important role in regulating the global carbon cycle and the Earth's climate (Baker et al 2008, Lewis et al 2011). Precipitation and solar radiation are the two most important environmental factors controlling the photosynthetic activity of Amazon forests. Previous studies showed that Amazon forests are sensitive to climate variability and change, particularly drought (Baker et al 2008, Lewis et al 2011). Drought can alter the photosynthesis, leaf area index (LAI), and surface energy exchange of Amazon forests (Saleska et al 2003, Wright and Vanschaik 1994), and these changes can in turn affect the regional and global climate (Alden et al 2016). Therefore, better understanding the responses of Amazon forests to drought is critical for projecting the terrestrial carbon uptake and the Earth's climate.
How the photosynthesis of Amazon forests responds to drought has been highly controversial over the last 15 years. A number of studies have examined the impacts of drought on the photosynthesis of Amazon forests, with some showing positive impacts and others showing negative impacts. A previous study based on eddy covariance data showed that canopy photosynthesis increased in the dry season (Saleska et al 2003), likely because of the increased LAI with higher solar radiation (Wright and Vanschaik 1994) and the access of deep-rooted trees to water in deep soil layers (Nepstad et al 1994). Similarly, using measurements from eddy covariance flux sites, two recent studies also reported increased photosynthesis of Amazon forests in the dry season (Wu et al 2016, Restrepo‐Coupe et al 2017). Using the enhanced vegetation index (EVI) derived from the MODerate resolution Imaging Spectroradiometer (MODIS), two studies showed that the 2005 drought led to 'green up' (i.e. an increase in photosynthetic activity) in Amazon forests (Huete et al 2006, Saleska et al 2007). These two studies suggested that sunlight may exert a larger influence on rainforest phenology and productivity than precipitation, and intact Amazon forests may be less vulnerable to climate variations than many ecosystem models assume. By contrast, some studies based on either site or satellite observations showed that forests suffered from declines in canopy photosynthesis under water stress (Malhi et al 1998, Liu et al 2017). For example, Doughty et al (2015) estimated that the severe drought in 2011 suppressed Amazon-wide photosynthesis by 0.38 Pg C. Several satellite-based studies indicated that the previous results of large-scale greening of the Amazon in drought based on MODIS EVI data resulted from inclusion of atmosphere-corrupted data (Bi et al 2016, Maeda et al 2014, Morton et al 2014, Samanta et al 2010). Based on MODIS EVI data with improved sensor calibration, sun-sensor geometry normalization, cloud detection, and atmospheric correction, these studies indicated that the 2005 drought showed no influence on, or even decreased, the greenness of Amazon forests. Another study indicated that the solar-induced chlorophyll fluorescence (SIF) derived from the Greenhouse Gases Observing SATellite decreased in the dry season over the central and southern Amazon, suggesting a decrease in gross primary productivity (GPP) due to water stress (Lee et al 2013). Therefore, the direction of photosynthesis changes in Amazon forests during drought and the relative effects of solar radiation and precipitation, remain unclear.
In recent years, satellite SIF measurements have opened a new perspective on the monitoring of global vegetation photosynthetic activity (Frankenberg et al 2011, Guanter et al 2012, Joiner et al 2013, Joiner et al 2011, Joiner et al 2014, Li et al 2018). The SIF is essentially a 'glow' of plants under sunlight, which is emitted from plant chlorophyll molecules a few nanoseconds after light absorption in the wavelength range of 600–800 nm (Baker 2008). Light energy absorbed by the leaf chlorophyll molecules takes three different pathways: photochemistry, non-photochemical quenching (NPQ, i.e. heat dissipation), and re-emission as SIF (Baker 2008). Only a small fraction undergoes re-emission. SIF is highly correlated with photosynthesis when NPQ dominates at high light levels (Baker 2008). SIF is strongly correlated with photosynthesis as both are mainly determined by absorbed photosynthetic active radiation (APAR), and are also influenced by temperature and water stresses (Li et al 2018). Compared to traditional vegetation indices such as the normalized difference vegetation index (NDVI) and EVI, the SIF is generated by the photosynthetic machinery itself, and therefore may provide a quick and direct diagnosis of the actual photosynthesis status of vegetation (Meroni et al 2009). The superiority of SIF for monitoring drought stress has already been demonstrated, especially when vegetation remains green while photosynthetic activity weakens (Daumard et al 2010, Joiner et al 2014, Wang et al 2016, Yoshida et al 2015).
Here we examined the impacts of the 2015 drought on the photosynthesis of Amazon forests, and explored the underlying mechanisms of how radiation and precipitation jointly control photosynthesis during severe drought. How this drought affected the photosynthesis of Amazon forests remains unclear. We used a variety of vegetation and climate variables including SIF, photosynthetic active radiation (PAR), fraction of APAR (fPAR), LAI, precipitation, soil moisture, vapor pressure deficit (VPD), and cloud cover to answer the following two questions: (1) how did the photosynthesis of Amazon forests respond to the 2015 drought?; (2) what were the relative effects of solar radiation and precipitation on the photosynthesis of Amazon forests during the 2015 drought? SIF along with PAR and the APAR could provide insight into the component processes that are responsible for the changes in SIF during drought. Our findings can improve our understanding of the responses of Amazon forests to drought.
2. Materials and methods
2.1. SIF
Currently, the GOME-2 instrument onboard Eumetsat's MetOp-A platform provides the global satellite SIF dataset with the longest duration and highest fidelity (Joiner et al 2013, Joiner et al 2011). We used the monthly SIF data retrieved from the GOME-2 red band from 2007–2015 (Joiner et al 2016). The red SIF data were partially filtered for clouds by removing pixels with effective cloud fractions up to 30%, and the pixels with solar zenith angles greater than 70° were also eliminated to avoid possible biases due to rotational Raman scattering (Vasilkov et al 2013). The performance of red SIF was evaluated by a comparison with far-red SIF in different areas. The spatio-temporal anomalies of red SIF and far-red SIF were similar, particularly in drought-prone regions (Joiner et al 2016). There was a larger percentage response in SIF in the red wavelength than in the far-red wavelength in drought-affected regions (Joiner et al 2016). MetOp-A GOME-2 has encountered radiometric degradation over its lifetime (Joiner et al 2016), which leads to a declining trend in SIF in the far-red wavelength. By contrast, the red SIF has been calibrated based on irradiance changes that occurred at 690 nm. The red SIF is therefore likely more reliable than the far-red SIF data for interannual variability or trend analysis. In this study, we used the newly released monthly GOME-2 red SIF data from 2007 to 2015 (https://avdc.gsfc.nasa.gov). Unlike the far-red SIF, the red SIF dataset was produced at a resolution of 1° to reduce the impact of retrieval noise.
GOME-2 SIF products are inherently noisy due to low signal levels, and some negative values owing to imperfect bias correction and noise can be found in the monthly Level 3 data. These negative monthly values were suggested to be either treated as zero for certain applications or retained in other applications such as averaging over a number of years. Amazon forests have a naturally high photosynthetic capacity, and the majority of the pixels have positive monthly SIF values throughout the year. We treated the small percentage of negative values as zero.
2.2. MODIS data products
We used the LAI (Myneni et al 2002), fPAR (Myneni et al 2002), and land cover (Friedl et al 2010) products in this study. These data products were obtained from the Land Processes Distributed Active Archive Center (LP DAAC; https://lpdaac.usgs.gov) for the period 2007–2015.
The fPAR measures the proportion of available radiation in the photosynthetically active wavelengths that is absorbed by vegetation canopies. We used fPAR to examine the effects of the fPAR variations on SIF because it is an important component of SIF. The fPAR is closely related to LAI, which defines the one-sided leaf area per unit of horizontal ground area. The MOD15A2 LAI and fPAR products used in this study are available every eight days and at 1 km resolution.
The Land Cover Type Climate Modeling Grid (MCD12C1) provides the dominant land cover types at a spatial resolution of 0.05°. We used the MCD12C1 land cover map in 2012 with the University of Maryland land cover classification scheme to identify forest pixels.
2.3. Precipitation data, soil moisture, cloud cover, VPD, and solar radiation data
We used monthly Tropical Rainfall Measuring Mission (TRMM) precipitation data at 0.25° spatial resolution over the period 2007–2015 (3B43—Version 7). The TRMM 3B43 data were downloaded from the Goddard Earth Sciences Data and Information Services Center (GES DISC, http://disc.sci.gsfc.nasa.gov). TRMM precipitation data have been widely used to examine the patterns and anomalies of precipitation in tropical regions (Lee et al 2013, Guan et al 2015, Xu et al 2015).
The monthly soil moisture and cloud cover data over the period 2007–2015 were obtained from the Global Land Data Assimilation System (GLDAS) data product GLDAS-2 from the GES DISC (http://disc.sci.gsfc.nasa.gov). The dataset contains a series of land surface parameters simulated from the Noah 2.7.1 model at a 0.25° spatial resolution and a monthly time step. There were four vertical levels for soil moisture in the Noah model: 0–0.1 m, 0.1–0.4 m, 0.4–1.0 m, and 1.0–2.0 m. The Noah model uses a 1 m root depth for grasslands and crops, and 2 m for woodland and forest. Therefore, in this study, we accumulated the soil moisture from the four soil layers to characterize the water variations in the whole root system of Amazon forests. Previous studies showed that the Noah model generally had good performance in simulating soil moisture, but the resulting estimates could have substantial uncertainty (Kim et al 2015, Fang et al 2016). Moreover, the roots of Amazon forests can be as deep as ~18 m (Nepstad et al 1994), and the water availability of these forests is likely not well characterized by the soil moisture of the top 2 m soil layer. Therefore, we also used VPD to measure atmospheric water stress.
The monthly VPD was calculated based on mean temperature and relative humidity data from the Modern-Era Retrospective Analysis for Research and Applications (MERRA-2, Version 2) meteorological reanalysis data. The MERRA-2 data are available at a spatial resolution of 0.5° × 0.625°, and were obtained from the NASA GES DISC (https://disc.sci.gsfc.nasa.gov). We used the anomalies of VPD as a measure of drought severity.
We used the monthly solar radiation data at a 1° spatial resolution over the period 2007–2015 from the Level 3 Monthly Radiative Fluxes and Clouds (SYN1deg-Month Ed3A) products. The solar radiation data were obtained from the NASA Langley Research Center Atmosphere Science Data Center (https://eosweb.larc.nasa.gov). The total surface PAR in all-sky conditions was calculated as the sum of the surface diffuse PAR and direct PAR in all-sky conditions.
2.4. Gridded GPP data
We used gridded GPP data (Xiao et al private communication) upscaled from FLUXNET observations to demonstrate that GOME-2 SIF is a good proxy for the GPP of Amazon forests. This GPP product was upscaled from flux tower GPP data to the global scale using a data-driven approach (Xiao et al 2008, 2010, 2014) along with MODIS data streams and meteorological reanalysis data. A predictive GPP model was first developed at the site level using GPP data, meteorological data, and MODIS data streams for 253 eddy covariance flux sites across the globe. The model was then used to estimate the GPP for each 0.05 degree grid cell over the globe for each eight-day period and each month over the period of 2000–2010. The resulting upscaled global GPP product, EC-MOD (Xiao et al private communication), is highly constrained by GPP estimates from eddy covariance flux towers.
2.5. Rationale for SIF dynamics
The amount of SIF at the top of the canopy can be formulated in a similar form as the GPP model based on the light use efficiency (LUE) logic (Guanter et al 2014, Sun et al 2015, Yoshida et al 2015):

where SIFyield is the emitted SIF per photon absorbed, and is the product of the actual fluorescence yield of the canopy and the fractional amount of fluorescence that escapes the canopy. The actual dynamics of SIF can originate from fPAR, PAR, and SIFyield.
Two important variables can lead to better understanding of their individual contributions to SIF when remotely sensed fPAR and PAR are available. One of the two variables is SIF normalized by PAR, referred to as SIFPAR_norm hereafter. SIFPAR_norm can be expressed as follows:
SIFPAR_norm eliminates the effects of PAR on SIF. The variations of SIFPAR_norm results from changes in vegetation structure that may affect LAI and chlorophyll content, and from changes in vegetation physiological and biochemical states that can affect SIFyield, which is the other important variable. SIFyield is SIFPAR_norm further normalized by fPAR or SIF normalized by APAR. SIFyield can be written as follows:
SIFyield eliminates the effects of APAR on SIF, and indicates the effective fluorescence yield of the canopy.
The use of SIFPAR_norm and SIFyield can help us understand the dynamic processes of SIF during drought because a drought can be accompanied by higher PAR and APAR. Two recent studies have investigated the seasonal cycles of these variables during drought, and revealed the effects of PAR and water stress on SIF during drought (Sun et al 2015, Yoshida et al 2015).
2.6. Data analysis
The data used in this study have different spatial and temporal resolutions. The SIF and PAR data are available at a 1° spatial resolution, precipitation, soil moisture, and cloud cover data at 0.25° resolution, VPD at 0.5° × 0.625° resolution, MODIS fPAR at 1 km resolution, and MODIS land cover at 0.05° resolution. The precipitation, soil moisture, cloud cover, VPD, fPAR, and land cover were spatially aggregated to 1° spatial resolution to match the resolution of SIF and PAR data. For the land cover data, the dominant land cover class, defined as the class with the highest percent cover, was assigned to each 1° pixel (figure 1). In addition, the eight-day fPAR data were temporally aggregated into monthly means to match the temporal resolution of other datasets using a linear weighted method.

Figure 1. (a) Land cover map of the Amazon, obtained from the 2012 MCD12C1 land cover map. The land cover map was resampled to 1° based on the dominant land cover classes. (b) Annual mean precipitation in the Amazon for the period of 2007–2014, derived from TRMM. The outline in the precipitation map line represents the Amazon basin. The four boxes represent (A) the southeastern Amazon (54°–59° W; 8°–12° S), (B) the central Amazon (60°–65° W; 2°–6° S), (C) the northern Amazon (62°–67° W; 1°–5° S), and (D) the east of Brazil (41°–46° W; 6° 7´–14° S). They have different levels of annual precipitation.
Download figure:
Standard image High-resolution imageIt has been reported that the responses of Amazon forests to precipitation and solar radiation can vary from north to south across the Amazon (Bradley et al 2011, Guan et al 2015, Lee et al 2013, Xu et al 2015). Therefore, we identified three regions that have distinct precipitation characteristics: (a) southeastern Amazon, with ecologically dry seasons (EDS; monthly rainfall ⩽ 100 mm) more than three months; (b) central Amazon, with only 1–2 EDS months; and (c) northern Amazon, with everwet areas. These three regions were all affected by the 2015 drought. We made comprehensive comparisons of multiple vegetation and climate variables in 2015 relative to the multi-year means (2007–2014) in the three selected regions (figure 1). This allowed us to examine how SIF responded to the drought across the Amazon. One more region, located in the east of Brazil and dominated by dry savannas (region D in figure 1), was also selected to examine whether the change in photosynthesis of savannas was similar to that of forests during the drought.
Previous studies demonstrated that SIF is strongly correlated with GPP (Frankenberg et al 2011, Joiner et al 2011, Li et al 2018). We first examined the consistency in spatial and temporal patterns between GOME-2 SIF and the upscaled GPP product for the overlapping period of the two datasets (2007–2010). Figure S1 shows the seasonal variations of gridded GPP and GOME-2 SIF throughout the four seasons: January–February–March (JFM), April–May–June (AMJ), July–August–September (JAS), and October–November–December (OND). The annual mean was subtracted from the seasonal mean to show the seasonality in GPP and SIF. The GPP of the forests exhibited different variations across the Amazon, while the SIF could generally capture these variations (in OND, figure S1(d) and (h)). In the central and northern Amazon with a shorter length of EDS, both GPP and SIF exhibited small and similar variations within the year. There were generally higher GPP and SIF values in wetter seasons (figures S1(a), (d), (e), and (h)). The southern counterparts showed clear seasonal variations suggested by GPP and SIF. The GPP and SIF were lowest in the dry season (figures S1(c) and (g)), and highest (figure S1(a), (d), (e), and (h)) in the wet season. We then compared the seasonal cycles of monthly gridded GPP and GOME-2 SIF in the southeastern Amazon (Region A), and found that SIF was strongly correlated with gridded GPP (R2 = 0.58, p < 0.0001; figure S2). This indicates that GOME-2 SIF tracked GPP fairly well in Amazon forests.
The standardized anomalies (anomaly divided by the standard deviation (STD)) of SIF, SIFyield, precipitation, VPD, soil moisture, LAI, fPAR, and PAR were calculated on a pixel-by-pixel basis. The standardized anomaly (henceforth referred to as anomaly for simplicity) in a pixel (i, j) for the drought year 2015 was calculated as a departure from the 2007–2014 mean and normalized by the STD:
The anomalies were calculated at monthly, seasonal, and annual scales. Pixels with anomalies in the range −1 to +1 can be considered as having no significant change. We aggregated the monthly averaged variables to four seasons: JFM, AMJ, JAS, and OND. The JAS season was usually considered as the dry season in the Amazon basin (Marengo et al 2011). We first examined the anomalies of SIF in 2015 relative to the period 2007–2014 for the Amazon basin. We then assessed the seasonal cycles of the eight vegetation and climate variables. The relative effects of solar radiation and water stress on photosynthesis were examined. To understand how precipitation and VPD affected the variation of SIFyield, we calculated the correlations of monthly and annual SIFyield anomalies with precipitation and VPD anomalies in the three selected regions. We also examined the spatial and temporal evolutions of the anomalies of the climate and vegetation variables throughout the year.
3. Results and discussion
3.1. Anomalies of SIF
The drought started from August 2015 and aggravated in the following four months (supplementary figure S3 available at stacks.iop.org/ERL/13/044005/mmedia). This severe drought was comparable to the 2010 drought in terms of precipitation deficit and drought extent. The central and eastern Amazon basins experienced substantial decreases in precipitation and soil moisture during the drought (figures 2(a) and (b)). The total precipitation in JAS (dry season in the Amazon) in 2015 was slightly lower than that in 2010, and the total precipitation in OND in 2015 was much lower than that in 2010 (supplementary figure S4). The soil moisture in 2015 was slightly higher than that in 2010 for JAS, and much lower than that in 2010 for OND (supplementary figure S4). Both precipitation and soil moisture in OND of 2015 were the lowest over the period 2007–2015.

Figure 2. The spatial distribution of anomalies in (a) annual precipitation, (b) soil moisture, (c) VPD, and (d) SIF in 2015 relative to the means over the period of 2007–2014 for Amazon forests.
Download figure:
Standard image High-resolution imageThe SIF anomalies showed inconsistency with the anomalies in precipitation, soil moisture, and VPD in 2015 at the annual scale to some extent (figure 2). Large negative anomalies of precipitation and soil moisture dominated the Amazon basin, suggesting that a large part of the basin was affected by the severe drought. About 54.7% and 39.6% of the forested pixels showed significant decreases in precipitation and soil moisture, respectively. Similar to precipitation and soil moisture, VPD exhibited nearly basin-wide positive anomalies (figure 2(c)), further suggesting that the severe drought led to a large water deficit. However, annual mean SIF did not show extensive negative anomalies despite the drought (figure 2). Only 18.2% of the forested pixels showed significant decreases in SIF, and these pixels were scattered across the Amazon. The spatial patterns of the SIF anomalies did not coincide well with the spatial distributions of precipitation and soil moisture anomalies. This indicates that the photosynthesis of Amazon forests may not have been seriously affected in 2015 despite the severe drought. A recent study found that GPP was substantially lower in 2015 than in 2011 in the tropical South America (Liu et al 2017). They examined the variations of GPP in 2015 (an El Niño year) relative to those in 2011 (a La Niña year), while our study calculated the SIF anomalies in 2015 as a departure from multi-year averages over the period of 2007–2014. Our SIF anomalies in 2015 relative to 2011 were indeed larger and more extensive than those in 2015 relative to the period of 2007–2014 (figure S5).
We examined the seasonal cycles of the eight vegetation and climate variables (precipitation, VPD, PAR, fPAR, cloud cover, SIF, SIFPAR_norm, and SIFyield) in the southeastern Amazon (Region A in figure 1) in 2015 relative to the multi-year means over the period of 2007–2014 (figure 3). The negative anomaly of monthly precipitation in 2015 increased from September to December, and the monthly precipitation in December was about 150 mm lower than the multi-year mean (figure 3(a)). Meanwhile, much higher VPD, PAR, and fPAR, and lower cloud cover, were observed during the drought period (August–December) (figures 3(b), (c) and (e)). SIF exhibited smaller negative anomalies than precipitation (figure 3(f)).

Figure 3. The seasonal cycles of eight vegetation and climate variables in the southeastern Amazon: (a) precipitation, (b) VPD, (c) PAR, (d) fPAR, (e) cloud cover, (f) SIF, (g) SIFPAR_norm, and (h) SIFyield. The red lines with plus symbols stand for the seasonal cycles of these variables in 2015, and the black lines with circles stand for the multi-year means of these variables over the period of 2007–2014.
Download figure:
Standard image High-resolution image3.2. Higher APAR partly offset negative effects of water stress on photosynthesis
The drought had more pronounced impacts on SIFPAR_norm and SIFyield than on SIF (figure 3). The seasonal cycle of SIFPAR_norm largely resembled the SIF curve but with larger anomalies during the drought period (figure 3(g)). The contrast between SIFPAR_norm and SIF curves suggests that the higher PAR partly neutralized the negative effects of drought on SIF. This is generally consistent with the findings of two previous studies. Sun et al (2015) evaluated two drought events with different onset mechanisms in Texas and the Great Plains in the United States using GOME-2 SIF. The drought was accompanied by high PAR, and once the effect of PAR was removed, the net impacts of drought on SIF became more pronounced. Yoshida et al (2015) found negative anomalies in SIFPAR_norm in areas composed primarily of mixed forest, while NDVI anomalies appeared to be smaller and occurred somewhat later. The SIFyield during the 2015 drought had larger negative anomalies than SIFPAR_norm (figure 3(h)) because high fPAR was observed during the drought (figure 3(c)). This coincides with the finding by Yoshida et al (2015) that the negative anomalies were more prominently reflected in SIFyield than that in SIFPAR_norm in areas dominated by mixed forests because of concurrent high fPAR. This phenomenon was not observed in other vegetation types, but possibly related to the different responses of deeper-rooted mixed forests to drought. The SIFyield eliminated the effects of vegetation structural variables (fPAR) on SIFPAR_norm, and could provide important information on environmental stresses that may not be rapidly reflected in vegetation greenness and chlorophyll content but have significant effects on the production of fluorescence (Sun et al 2015).
The seasonal cycle of SIFyield, to a large extent, resembled those of cloud cover and precipitation (figures 3(e) and (h)). The SIFyield immediately dropped when the drought began, and its anomalies became larger in absolute magnitude as the drought aggravated. This phenomenon was not observed for SIF or SIFPAR_norm. The similarity in the seasonal cycle between SIFyield and cloud cover/precipitation demonstrated that water stress in 2015 indeed had large effects on canopy photosynthesis by limiting the production of fluorescence. However, the high PAR and fPAR, and the resulting high APAR partly offset the negative impacts of water stress, leading to the smaller decrease of SIF compared with the large negative anomalies of precipitation and SIFyield (figures 3(a), (f), and (h)). The results of the central and northern Amazon (Regions B and C in figure 1, respectively) and the entire basin are provided in supplementary figures S6–8. All regions exhibited smaller negative anomalies in SIF than in SIFyield during the 2015 drought, although the difference was not as significant as that in the southeastern Amazon. The spatial patterns of PAR, fPAR, APAR, and SIFyield anomalies are provided in figure 4. Basin-wide negative anomalies were observed in SIFyield, while large parts of the Amazon (the central and southern Amazon) were accompanied with high PAR and fPAR, and thereby high APAR.

Figure 4. The spatial distribution of anomalies of (a) PAR, (b) fPAR, (c) APAR, and (d) SIFyield in 2015 relative to the means over the period of 2007–2014 in the Amazon.
Download figure:
Standard image High-resolution imageThe higher PAR during the drought resulted from lower cloud cover (figure 3(e), supplementary figures S6(e), S7(e), and S8(e)). The higher fPAR during the drought could be explained by the variations of LAI (supplementary figure S9). The LAI increased in the majority of the drought-affected areas, which synchronized with the availability of higher solar radiation. This is closely related to the exchange strategy between older leaves that are photosynthetically less efficient and new leaves that are photosynthetically more efficient in Amazon forests with leaf-exchanging evergreen trees, resulting in a gradually increasing LAI over several months during the ascending phase of the seasonal cycle (Goulden et al 2004, Mulkey et al 2012, Myneni et al 2007, Wu et al 2016). This strategy enhances photosynthetic gain when solar radiation is abundant and the deep-rooted trees may not be seriously disturbed by the drought and are still well hydrated (Myneni et al 2007). In contrast to the deep-rooted trees, some dry savannas, located in the east of Brazil (Region D in figure 1), showed declines in photosynthesis during the drought. LAI changes in these savannas were concordant with water variation, and the lower LAI during the drought resulted in lower fPAR (figure 5). A previous study (Myneni et al 2007) reported that the phenological cycle of LAI in Amazon forests was timed to the seasonality of solar radiation, with higher leaf area during the shorter dry season when solar radiation loads were high. The LAI changes in the adjacent grasslands and savannas in Brazil were concordant with rainfall data. It should be noted that the LAI product contains significant uncertainty (Fang et al 2012), and the future availability of LAI data products with higher accuracy will help us better understand the responses of Amazon ecosystems to drought.
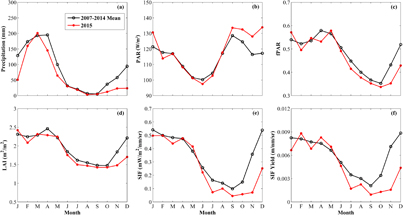
Figure 5. The mean seasonal cycles of (a) precipitation, (b) PAR, (c) fPAR, (d) LAI, (e) SIF, and (f) SIFyield for the dry savanna in the east of Brazil (Region D in supplementary figure 1). The multi-year means over the period 2007–2014 are shown in black lines with circles, and the 2015 values are shown in red lines with plus symbols.
Download figure:
Standard image High-resolution image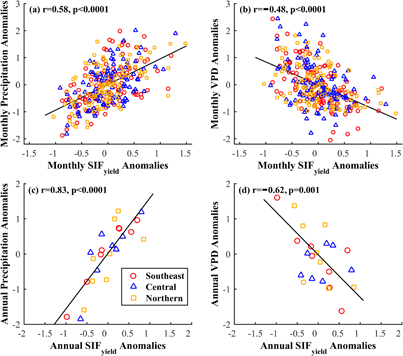
Figure 6. Relationships between the SIFyield anomalies and climate variable anomalies in different regions at monthly and annual scales. (a) Monthly SIFyield anomalies versus precipitation anomalies; (b) monthly SIFyield anomalies versus VPD anomalies; (c) annual SIFyield anomalies versus precipitation anomalies; and (d) annual SIFyield anomalies versus VPD anomalies. The correlation coefficients (r) and associated p values provided in each figure were calculated by pooling together all the data in the three selected regions.
Download figure:
Standard image High-resolution image
Figure 7. Spatial and temporal evolutions of anomalies of four climate and vegetation variables throughout the four seasons in 2015. Anomalies of (a)–(d) precipitation, (e)–(h) VPD, (i)–(l) SIFyield, and (m)–(p) SIF in four seasons. The four columns represent the four seasons: JFM, AMJ, JAS, and OND, respectively.
Download figure:
Standard image High-resolution image
3.3. Spatial variations of SIFyield and SIF across the Amazon during drought
The monthly SIFyield anomalies showed positive correlation with precipitation anomalies in the southeastern (r = 0.57, p < 0.0001), central (r = 0.59, p < 0.0001), and northern Amazon (r = 0.61, p < 0.0001) (figure 6(a)); the monthly SIFyield anomalies showed negative correlation with VPD anomalies in the southeastern (r = −0.61, p < 0.0001), central (r = −0.42, p < 0.0001), and northern Amazon (r = −0.41, p < 0.0001) (figure 6(b)). These results suggested that the water stress could lower the SIFyield to varying degrees across the Amazon. At the annual scale, the SIFyield anomalies showed stronger correlations with precipitation anomalies in all the three regions (southeastern: r = 0.96, p < 0.0001; central: r = 0.83, p = 0.012; northern: r = 0.71, p = 0.048, figure 6(c)). The correlation between SIFyield and VPD anomalies was stronger at the annual scale (r = −0.80, p = 0.018) than at the monthly scale in the southeastern Amazon, and was similar in the other two regions (figure 6(d)). The SIFyield was more sensitive to water stress in the southern Amazon especially at the annual scale. This was similar to the responses of other vegetation biophysical variables (e.g. NDVI, and EVI) to precipitation in the Amazon found in previous studies (Hilker et al 2014, Lee et al 2013, Xu et al 2015). The SIFyield was influenced by temperature and water stresses that control LUE (Meroni et al 2009, Van der Tol et al 2014). In the Amazon region, temperature is generally not considered as a limiting factor of vegetation conditions (Nemani et al 2003), and the LUE therefore largely depends on the variation of water stress. In northern parts of the Amazon with everwet conditions, vegetation phenology is more in phase with radiation, while precipitation is a major driver of vegetation phenology in southern counterparts with different lengths of dry seasons (Bradley et al 2011). Therefore, LUE and SIFyield were more sensitive to water variability in the southern regions.
The impacts of the 2015 drought on SIFyield and SIF were further analyzed by examining their spatial variations and temporal evolutions throughout the four seasons (figure 7). Precipitation showed moderate declines in JFM and AMJ seasons in the central, eastern, and southern Amazon. Precipitation deficit began to aggravate in JAS, and showed the largest negative anomalies in OND when the drought affected nearly the entire Amazon basin. The extensive increase of VPD synchronized with the decline of precipitation throughout the seasons. Consequently, the SIFyield showed moderate declines in the first two seasons and large negative anomalies in JAS and OND due to the severe water stress. The SIF also showed similar spatial patterns throughout the year, but the drought had smaller impacts on SIF than on SIFyield in terms of magnitude and spatial extent of negative anomalies.
4. Conclusions
By making use of satellite SIF products along with other climate and vegetation datasets, we examined the impacts of the 2015 drought on the photosynthesis of Amazon forests to understand how radiation and precipitation jointly control photosynthesis. The SIF integrates information from SIFyield, fPAR, and PAR, and is effective for diagnosing the photosynthesis status of Amazon forests. Satellite-based SIF products not only have significant potential for estimating GPP over large scales, but can also shed light on the relative influences of water and light availability on plant photosynthesis. Our results showed that in spite of severe dry conditions from August to December in 2015, the decrease of photosynthetic activity of the Amazon forests was not as high as expected because the high PAR, LAI, and fPAR partly offset the negative effects of water stress on photosynthesis. Our research indicates functional complementation between precipitation and solar radiation on the photosynthesis of Amazon forests, and also reveals that rainforests and savannas have different vulnerabilities to climate change.
Author contributions
J Xiao and X Li designed the research. X Li processed the data. X Li, J Xiao, and B He analyzed the data. X Li and J Xiao wrote the paper. B He provided comments and suggestions on the manuscript.
Acknowledgments
This study was supported by the National Aeronautics and Space Administration (NASA) through the Carbon Cycle Science Program (Grant No. NNX14AJ18G) and the Climate Indicators and Data Products for Future National Climate Assessments (Grant No. NNX16AG61G), the National Science Foundation through the Macrosystems Biology Program (Grant No. 1065777, 1638688), National Natural Science Foundation of China (Grant No. 41471293 & 41671361), and China Scholarship Council. The authors wish to acknowledge Dr. Joanna Joiner for providing GOME-2 SIF data through http://avdc.gsfc.nasa.gov/. All the MODIS data used in this study were obtained from the NASA LP DAAC. The TRMM 3B43 data were downloaded from the GES DISC. The GLDAS-1 data was generated as part of the mission of NASA's Earth Science Division, and was archived and distributed by the GES DISC. The solar radiation data were obtained from the NASA Langley Research Center Atmosphere Science Data Center. All data generated in this study will be available upon request. We thank the two anonymous reviewers for their constructive and insightful comments on the manuscript.