
Abstract
In the White Mountains of California, eight bristlecone pine (Pinus longaeva) tree-ring width chronologies were developed from trees at upper treeline and just below upper treeline along North- and South-facing elevational transects from treeline to ~90 m below. There is evidence for a climate-response threshold between approximately 60–80 vertical m below treeline, above which trees have shown a positive growth-response to temperature and below which they do not. Chronologies from 80 m or more below treeline show a change in climate response and do not correlate strongly with temperature-sensitive chronologies developed from trees growing at upper treeline. Rather, they more closely resemble lower elevation precipitation-sensitive chronologies. At the highest sites, trees on South-facing slopes grow faster than trees on North-facing slopes. High growth rates in the treeline South-facing trees have declined since the mid-1990s. This suggests the possibility that the climate-response of the highest South-facing trees may have changed and that temperature may no longer be the main limiting factor for growth on the South aspect. These results indicate that increasing warmth may lead to a divergence between tree growth and temperature at previously temperature-limited sites.
Export citation and abstract BibTeX RIS

Content from this work may be used under the terms of the Creative Commons Attribution 3.0 licence. Any further distribution of this work must maintain attribution to the author(s) and the title of the work, journal citation and DOI.
1. Introduction
The width of annually formed tree rings varies from year-to-year because the environmental conditions encountered by the tree also vary from year-to-year. This association forms the foundation of dendroclimatology and underlies all reconstructions of climate from tree-ring widths (Fritts 1976). However, more than one environmental variable can affect tree growth. The environmental factor which is most limiting to growth, and thus most influential in determining the ring-width variability in a given tree, primarily depends on the location of the tree (Fritts 1976). For example, tree-ring width in many dry regions can provide a first approximation of total rainfall over an interval of many months, whereas in high latitudes and in alpine treeline ecosystems tree-ring width can closely follow summer temperature (Schulman 1956).
Bristlecone pine (Pinus longaeva D K Bailey) is an unusual climate proxy in that the long lifespan of individual trees and the persistence of dead wood have enabled the development of annually resolved multi-millennial-length ring-width chronologies. Ring widths from lower-forest-border bristlecone trees have been used as a proxy for reconstructions of precipitation that span many millennia (e.g., Hughes and Funkhouser 1998), while radial growth in upper-forest-border trees has long been considered a proxy for temperature (e.g., LaMarche Jr 1974). These studies used ring-width as the parameter of interest while other research has relied on isotopes of carbon and oxygen to investigate the climate response of bristlecone (e.g., Leavitt 1994, Berkelhammer and Stott 2008, 2009, Bale et al 2010, 2011).
Our recent bristlecone pine research explores the contrast in the signals present in ring widths at the upper treeline and in trees below upper treeline, but not necessarily at the lower-forest-border (Salzer et al 2009, Kipfmueller and Salzer 2010, Bunn et al 2011). These studies noted that near the climatically-determined upper treeline relatively small differences in elevation, on the order of 100–150 vertical meters, altered the environmental factor most limiting to tree-ring growth. Studies on other treeline species have also noted a radial growth response to climate as a function of elevation at relatively small scales, for example in Tasmanian Huon pine (Lagarostrobos franklinii) (Buckley et al 1997). In Western North America, bristlecone trees growing in a narrow elevational band near the treeline showed a pattern of growth consistent with temperature limitation, while trees below this band showed a pattern of growth more similar to lower-forest-border precipitation-sensitive trees. It was also discovered that in a small subset of the trees growing below the upper treeline elevational band, but rooted in particular locations on the landscape vulnerable to cold-air pooling, ring-width patterns were more similar to the temperature-sensitive patterns found in the highest trees (Bunn et al 2011). Thus, it is clear that small scale elevational and micro-topographical differences in tree location at the site level can influence resulting tree-ring width chronologies and subsequent paleoclimatic inferences made from these chronologies. This fine-scale spatial sensitivity in climate response near upper treeline is not well understood. How close to treeline do these trees need to be to show a temperature-limited growth pattern? Here, we examine more closely the climate response of near-treeline bristlecone pine in the White Mountains of California using ring-width chronologies from two aspect-specific elevational transects just below the upper treeline.
2. Data and methods
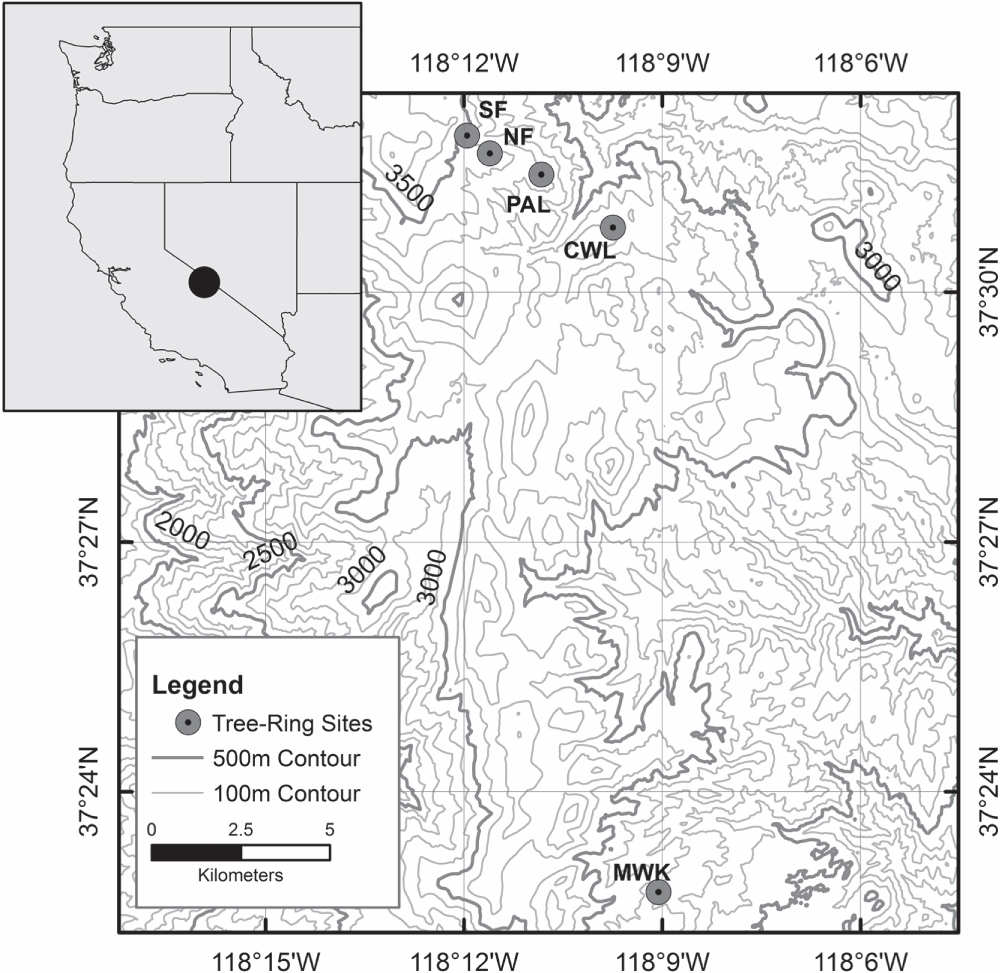
In total, eight ring-width chronologies were developed from living bristlecone pine trees growing in the Sheep Mountain/Patriarch Grove area of the Ancient Bristlecone Pine Forest in the White Mountains of California (figure 1, table 1). Four chronologies are from a South-facing slope (SF) and four are from a North-facing slope (NF). The trees used in the four chronologies from each aspect are separated by approximately 30 m in vertical elevation. We began sampling at upper treeline on the South-facing slope (SFa). Two increment cores were taken from each of four mature trees growing in close proximity and in similar topographic circumstances. We then moved downslope approximately 30 m and took two cores each from a cluster of four more trees (SFb). These steps were repeated two more times (SFc and SFd) until we were roughly 90 m below upper treeline and had collected a total of 32 cores–two cores each from four trees at each of the four elevational increments. The whole process was then repeated on the North-facing slope (NFa, NFb, NFc, and NFd). Two of the trees at SFa had been previously sampled so we used four cores from two of the trees at SFa for a total of 12 series at this site. A few cores had to be split into two or three sections due to excessive resin or small rot pockets. This led to nine total series at SFc and at Sfd, and ten total at NFc. In all cases, the eight near-treeline transect mean tree-ring width chronologies were derived from only four trees each (table 1). We recognize this is a small number of trees that is approaching the lower limit of sample replication that should be averaged in mean time series and processed in dendroclimatic analyses. While the time series statistics suggest a strong common signal (table 1), for future research and subsequent analyses we recommend sampling more trees.

Figure 1. Location of the tree-ring sites used in this study.
Download figure:
Standard image High-resolution imageTable 1. Elevations and descriptive statistics for the tree-ring width chronologies used in this study. Chron: site chronology; Elev m: mean elevation of sampled trees in meters; DTL m: mean distance from upper-treeline of sampled trees in meters; yr min: first year in the chronology; n: number of cross-dated tree-ring series at each site; n1600: n at each site in the year AD 1600 when comparisons begin; rbar: mean series intercorrelation measures the internal coherence of tree-ring data (Cook and Kairiukstis 1990)—higher rbar values can indicate datasets contain a stronger common signal; AR1: first-order autocorrelation; eps: expressed population signal 1600–2009(expressed population signal quantifies how well a chronology based on a finite number of trees represents the hypothetical perfect or true chronology (Wigley et al 1984)).
| Chron | Elev m | DTL m | yr min | n | n1600 | rbar | AR1 | eps |
|---|---|---|---|---|---|---|---|---|
| SFa | 3511 | 0 | 1309 | 12 | 7 | 0.70 | 0.78 | 0.89 |
| SFb | 3477 | 34 | 1422 | 8 | 3 | 0.50 | 0.66 | 0.84 |
| SFc | 3448 | 63 | 1020 | 9 | 8 | 0.74 | 0.69 | 0.90 |
| SFd | 3428 | 83 | 795 | 9 | 8 | 0.69 | 0.63 | 0.88 |
| NFa | 3475 | 0 | 978 | 8 | 3 | 0.52 | 0.69 | 0.77 |
| NFb | 3444 | 31 | 953 | 8 | 5 | 0.52 | 0.73 | 0.79 |
| NFc | 3427 | 48 | 875 | 10 | 8 | 0.61 | 0.71 | 0.87 |
| NFd | 3391 | 84 | 1069 | 8 | 7 | 0.64 | 0.65 | 0.84 |
| PAL | 3320 | 191 | 1400 | 35 | 30 | 0.73 | 0.58 | 0.97 |
| CWL | 3190 | 321 | 1400 | 40 | 29 | 0.64 | 0.64 | 0.95 |
| MWK | 2805 | 706 | 61 | 27 | 26 | 0.63 | 0.59 | 0.89 |
Core samples were air dried, glued into wooden core mounts, and sanded to a high polish following standard dendrochronological procedures (Stokes and Smiley 1968). The polished cores were crossdated and chronologies were developed for each location with absolute calendar dates assigned to the rings of each sample. The dated rings in all samples were measured to the nearest 0.001 mm. Crossdating accuracy was assessed and confirmed using COFECHA software and dplR (Holmes 1999, Bunn 2010). Standardized mean ring-width-index chronologies were developed by fitting each measured series with a modified negative exponential curve, a trend line with negative slope, or a mean line as determined by the dendrochronological software dplR (Bunn 2008). The indexed series were then combined into a robust biweight mean chronology. In addition, as a measure of absolute radial growth in mm by aspect and site, distributions of mean raw ring-width measurements from all cores at each site were collated for the eight sites referred to above. We also refer to three other bristlecone pine chronologies from the White Mountains in our analyses: Methuselah Walk (MWK), Cottonwood Lower (CWL) and Patriarch Lower (PAL). These were developed previously for other studies (Hughes and Funkhouser 1998, Bale et al 2011, Bunn et al 2011) using similar standard dendrochronological procedures as those described above and are from trees lower in elevation than the trees used in the eight near-treeline transect chronologies (table 1).
The indexed chronologies were compared to each other from AD 1600 to the present using correlation analyses (table 2), and compared to spatial fields of climatic variables from KNMI Climate Explorer (Trouet and Van Oldenborgh 2013) including summer Palmer Drought Severity Index (PDSI), warm-season temperature, and cool-season precipitation. The local climate is influenced by the state of the circumpolar vortex, the strength of the subtropical westerlies, and by oceanic-atmospheric interactions linked to the El Niño-Southern Oscillation. Storms moving inland from the Pacific result in large amounts of precipitation falling on the Sierra Nevada, leaving the White Mountains in a rain shadow. Precipitation amounts are low but highly variable from year to year (see Salzer et al 2009 supplemental materials for more detail on local precipitation and temperature).
Table 2. Pearson correlations, A D 1600 to end of series, for the tree-ring width chronologies developed for the aspect-specific elevational transects in the White Mountains of California
| Chrons | SFa | SFb | SFc | SFd | NFa | NFb | NFc | NFd | PAL | CWL | MWK |
|---|---|---|---|---|---|---|---|---|---|---|---|
| SFa | 1 | ||||||||||
| SFb | 0.83 | 1 | |||||||||
| SFc | 0.74 | 0.79 | 1 | ||||||||
| SFd | 0.52 | 0.65 | 0.72 | 1 | |||||||
| NFa | 0.80 | 0.72 | 0.76 | 0.51 | 1 | ||||||
| NFb | 0.67 | 0.69 | 0.61 | 0.56 | 0.66 | 1 | |||||
| NFc | 0.82 | 0.74 | 0.78 | 0.57 | 0.83 | 0.81 | 1 | ||||
| NFd | 0.30 | 0.45 | 0.61 | 0.75 | 0.45 | 0.52 | 0.56 | 1 | |||
| PAL | 0.30 | 0.43 | 0.67 | 0.77 | 0.42 | 0.37 | 0.44 | 0.78 | 1 | ||
| CWL | 0.21 | 0.33 | 0.60 | 0.61 | 0.37 | 0.27 | 0.36 | 0.68 | 0.89 | 1 | |
| MWK | 0.26 | 0.35 | 0.56 | 0.47 | 0.41 | 0.28 | 0.38 | 0.50 | 0.68 | 0.73 | 1 |
3. Results and discussion
3.1. Chronology comparisons
Correlations between the highest elevation chronologies, SFa and NFa, and the other chronologies, showed an exponential decay moving down slope with a strong nonlinear association between correlation with the highest chronologies and distance from treeline (figure 2(A)). Correlations between the six chronologies at the highest elevations (0–63 m below treeline) all remain above 0.66 with a mean correlation of 0.76. On the other hand, the chronologies > 63 m below treeline correlate less well with the treeline chronologies. The r values range from 0.21 to 0.52 with a mean correlation of 0.36. This suggests the possibility of a climate-response threshold between 60 and 80 m below treeline.

Figure 2. Pearson correlations between the different transect chronologies and the two treeline chronologies (South-facing red, North-facing blue) plotted be their vertical distance from the treeline (A). The solid lines (and R2 values) are predicted fits from a nonlinear least squares model of the form y = a* exp(b * x) + k where y is the correlation with the treeline chronology, x is the vertical distance with treeline, and a, b, and k are coefficients. The nonlinear relationship between treeline chronologies and those below treeline is further demonstrated with bar plots that also show the inverse association with the lowest elevation chronology at MWK (green) (B). The tree-ring chronologies also show a strong nonlinear association between elevation and first-order autocorrelation (C), similarly well modeled by a negative exponential function as in (A).
Download figure:
Standard image High-resolution imageThe decreasing correlation between the highest chronologies and lower elevation chronologies was mirrored by a symmetrical increase in correlation between the lower chronologies and the lowest elevation chronology, MWK (figure 2(B)). The two chronologies at 83/84 m below treeline (NFd and SFd), showed signs of being transitional in nature. These chronologies exhibited approximately equal correlation with both the highest and lowest chronologies (figure 2(B)). This transition at about 80 m below treeline is supported by patterns in the autocorrelation structure of the chronologies (figure 2(C)). There are high levels of first order autocorrelation in the chronologies nearest treeline. This is a common feature of temperature-sensitive tree-ring chronologies (LaMarche and Stockton 1974). In contrast, the SFd and NFd chronologies exhibit less autocorrelation and are, once again, transitional in nature between the treeline chronologies and the moisture-sensitive chronologies from PAL, CWL, and MWK. There are a few inconsistencies in these results, for example NFc correlates higher with NFa than the closer NFb does. These small discrepancies are not unusual given the expected amount of noise in the tree-ring chronologies and they do not call into question the overall pattern of the results. These transect data demonstrate that bristlecone pine tree-ring chronologies from this mountain range that are from trees 83 m or more below treeline, and possibly as close as 64 m below treeline, do not strongly correlate with treeline chronologies, suggesting a different environmental variable controlling growth at the differing elevations.
3.2. Climate and tree-ring growth
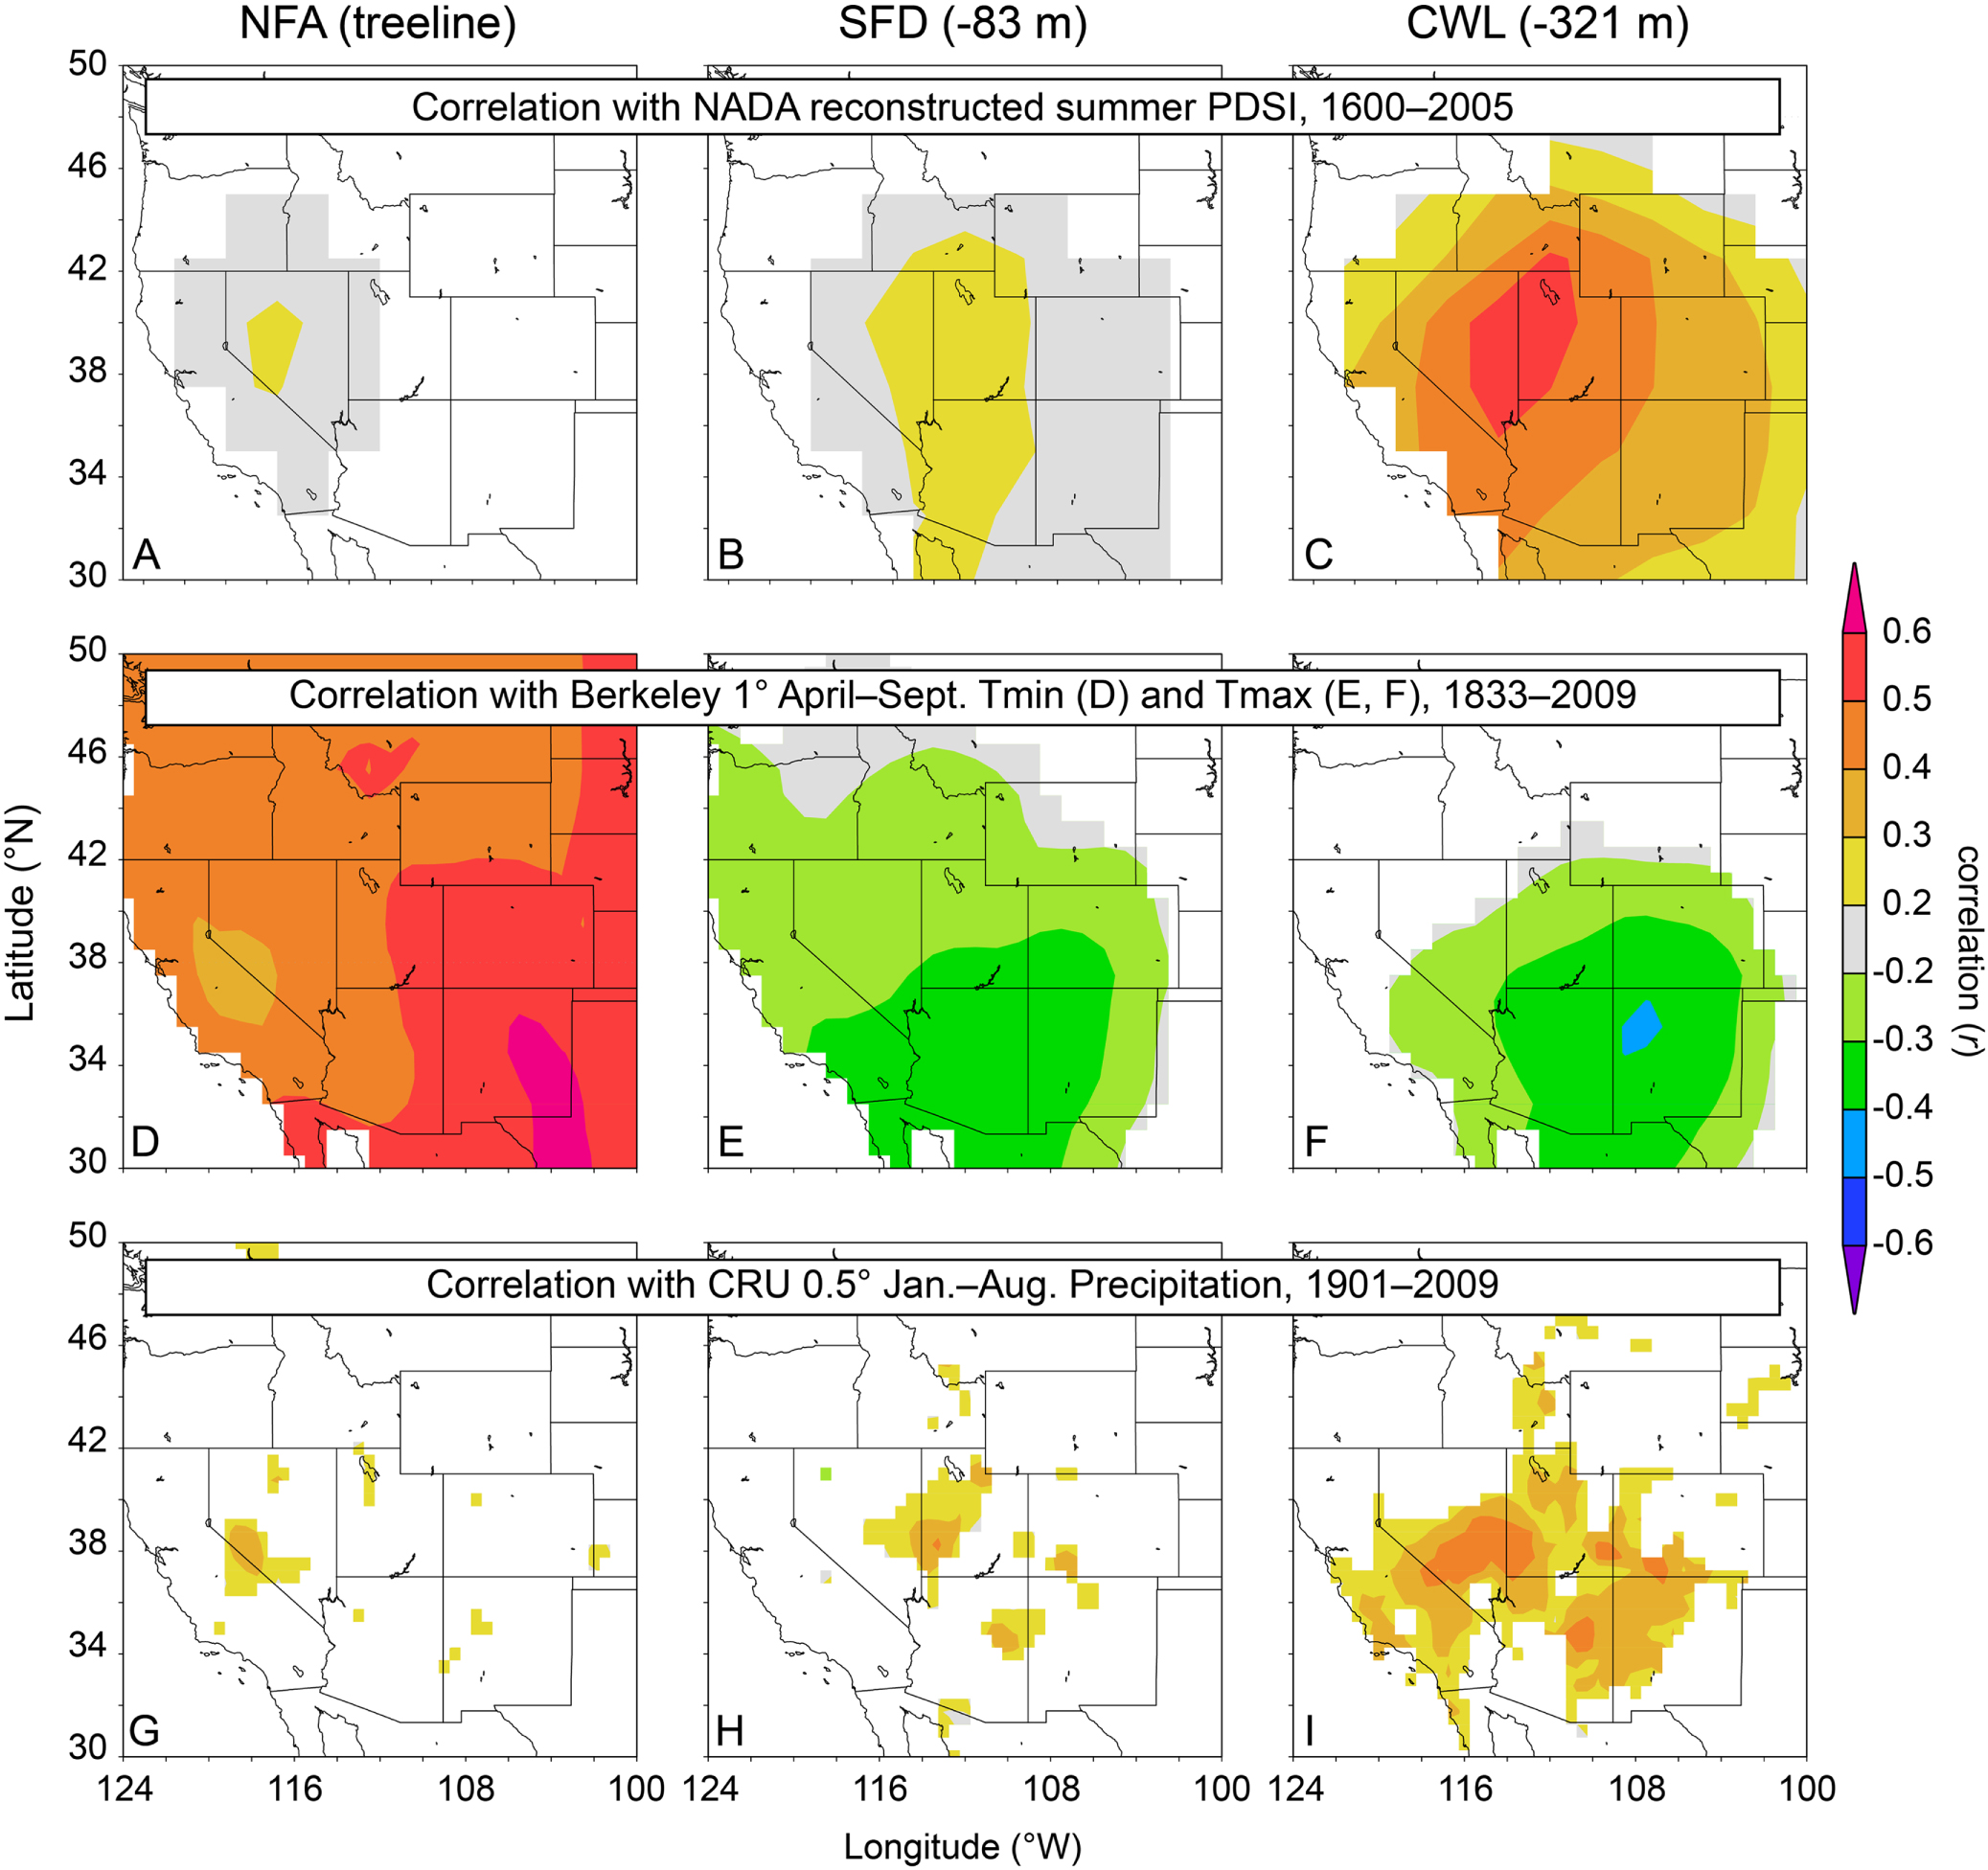
The correlation structure between chronologies most likely varies by elevation because the trees at varying elevations are responding to different environmental conditions. The trees at the highest elevations (coldest locations) have a positive growth response to temperature and a weak association with precipitation and with soil moisture as approximated by the PDSI (figure 3). Trees further below upper treeline exhibit a negative growth response to temperature and a stronger positive response to precipitation and PDSI (figure 3). For example, figure 3 panels (A)–(C) demonstrate that with decreasing elevation there is an overall strengthening of the association between tree growth and reconstructed summer PDSI from the North American Drought Atlas (Cook et al 2004) over the interval 1600–2005. Similarly, panels (G)–(I) show stronger and more widespread correlation with cool-season precipitation from the CRU TS3.21 data set (Harris et al 2014) with decreasing elevation. On the other hand, figure 3 panels (D)–(F) demonstrate a different pattern. The treeline NFa chronology correlates strongly and positively with Western USA gridded warm-season minimum temperature over the interval 1833–2009 (see: http://berkeleyearth.org/data/) figure 3(D), whereas at > 83 m below treeline the chronologies are strongly negatively correlated with maximum temperature over the same interval figures 3(E)–(F). It is interesting to note that the intermediate elevation chronology (SFd) is more similar in its precipitation response to the treeline chronology and in its temperature response to the chronology well below treeline.
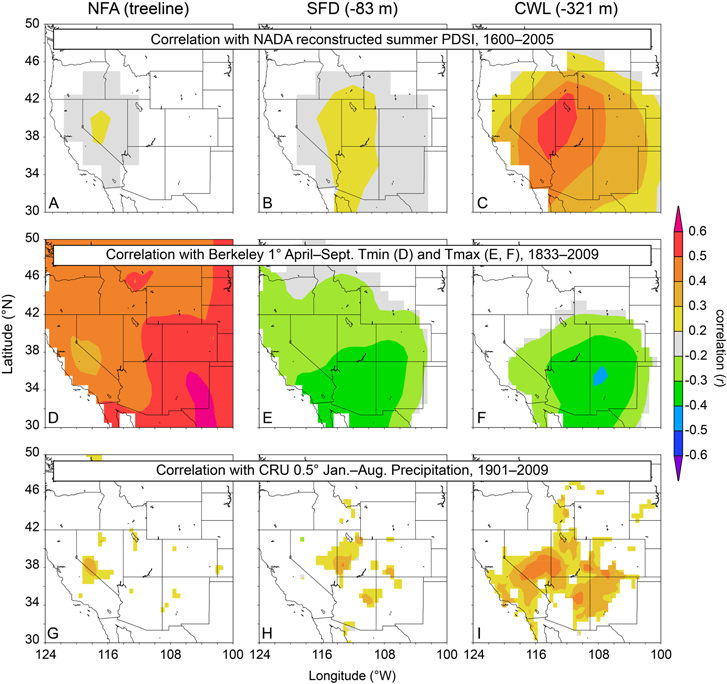
Figure 3. Correlation of three of the tree-ring chronologies used in this study with spatial fields of climatic variables from KNMI Climate Explorer (Trouet and Oldenborgh 2013). Chronologies are correlated with reconstructed summer PDSI (A)–(C) (Cook et al 2004) (1600–2005), with instrumental warm-season temperature (D)–(F) (http://berkeleyearth.org/data/) (1833–2009), and with CRU TS3.21 cool-season precipitation (G)–(I) (Harris et al 2014) (1901–2009).
Download figure:
Standard image High-resolution image3.3. Tree-ring growth rates, aspect, and elevation
At the highest sites, over the entire interval examined (1600–2009), the trees on South-facing slopes have grown faster than the trees on North-facing slopes. When the eight SF and NF raw ring-width chronologies are considered as paired sites (SFa/NFa, SFb/NFb, etc), the South-facing chronologies have a significantly greater mean ring-width (t ≥ 21.8, p < 0.001, Neff ≥ 40) than their North-facing counterpoints at the two highest locations (SFa/NFa, SFb/NFb) (figure 4). Growth rates at the two lower paired sites (SFc/NFc, SFd/NFd) are statistically different (t ≥ 5.1, p < 0.05, Neff ≥ 52) but more similar on the two different aspects. The greater growth on South-facing slopes by near-treeline trees may be indicative of higher energy receipts on these slopes, with more direct sunlight and warmer conditions than on the cooler North-facing slopes that typically receive less direct sun.

Figure 4. Violin plots displaying the kernel density plots (shaded regions: South-facing red, North-facing blue), the inner quartiles (black bars), and the medians (white circles) of paired chronologies, one from each aspect at each of four elevations for the period 1600–2009.
Download figure:
Standard image High-resolution imageThe ring-width index chronologies at the two treeline sites diverge in the late 20th century (figure 5). This modern divergence between the SFa and NFa chronologies begins in 1995 and SFa shows a significantly smaller mean tree-ring index (1.30) than at NFa (1.63) from 1995 to 2009 (t = 3.34, p < 0.01, df = 28). From 1980 to 1994 the two means are not significantly different (t = 0.65, p < 0.52, df = 28) (figure 5). These two treeline chronologies both show strong positive correlation with the Northern Hemisphere temperature reconstruction of Mann et al (2009) over the 407 year 1600–2006 interval (SFa, r = 0.71; NFa, r = 0.69). In addition, both chronologies exhibit a strong century-scale positive trend from approximately 1850 to the late 20th century (figure 6(a)). While this trend continued through the 21st century for the NFa chronology, growth rates in the SFa chronology have declined in comparison to NFa since the mid-1990s, and have become more similar to the non-treeline chronologies downslope. This suggests the possibility that the climate response of the highest trees on the South-facing slope may have changed from a positive growth-response to temperature to a growth-response more limited by moisture availability. Similar, short disjunctions occurred previously in the mid-17th and early-20th centuries (figure 6(A)). Also, it is important to note that opposite differences between the two treeline site chronologies have occurred during earlier periods, for example during the 18th century (figure 6(A)). These differences show the South-facing trees growing faster than the North-facing. Such a circumstance in an upper treeline environment might result from a short-term warm excursion during a typically cool interval. The modern differences, on the other hand, show the North-facing trees growing faster than the South-facing, a condition most likely due to moisture stress associated with higher temperatures. Given that there is sufficient warmth on South-facing slopes to indicate a possible 'switch' in climate response among trees growing at treeline, it also seems likely that conditions above treeline are now warm enough to enable the upslope advance of trees. Evidence of this expanded ecological niche is provided by an abundance of young and newly established bristlecone pine 25–75 m above the current treeline (Salzer et al 2014).
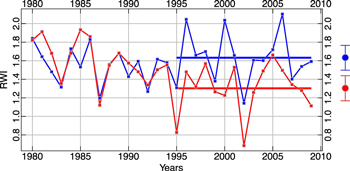
Figure 5. Ring-width index chronologies from the two treeline sites, NFa (blue) and SFa (red) over the 1980–2009 30 year modern interval. The horizontal lines illustrate the different means of the two chronologies over the final 15 years of the chronologies from 1995–2009. 95% confidence intervals based on 100 bootstrapped replicates of the mean are shown on the right.
Download figure:
Standard image High-resolution image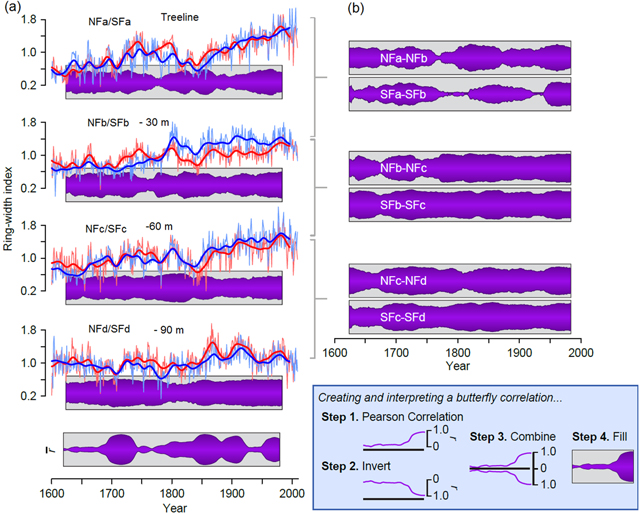
Figure 6. Different patterns of growth for near-treeline bristlecone pine at differing elevations from 1600–2009. Interannual and smoothed (32 year Gaussian filter) standardized ring-width-index chronologies for each site and approximate distance from treeline with butterfly correlations (see figure inset) to illustrate the similarity/difference in growth patterns between paired elevational sites with Pearson correlations over moving 50 year windows (A). The mean correlation among all sites, on both aspects, over centered moving 50 year windows is shown as r-bar at the bottom of (A). Butterfly correlations illustrate the similarities/differences in growth between sites on each aspect (e.g., NFa and NFb) using centered moving 50 year Pearson correlation coefficients (B).
Download figure:
Standard image High-resolution image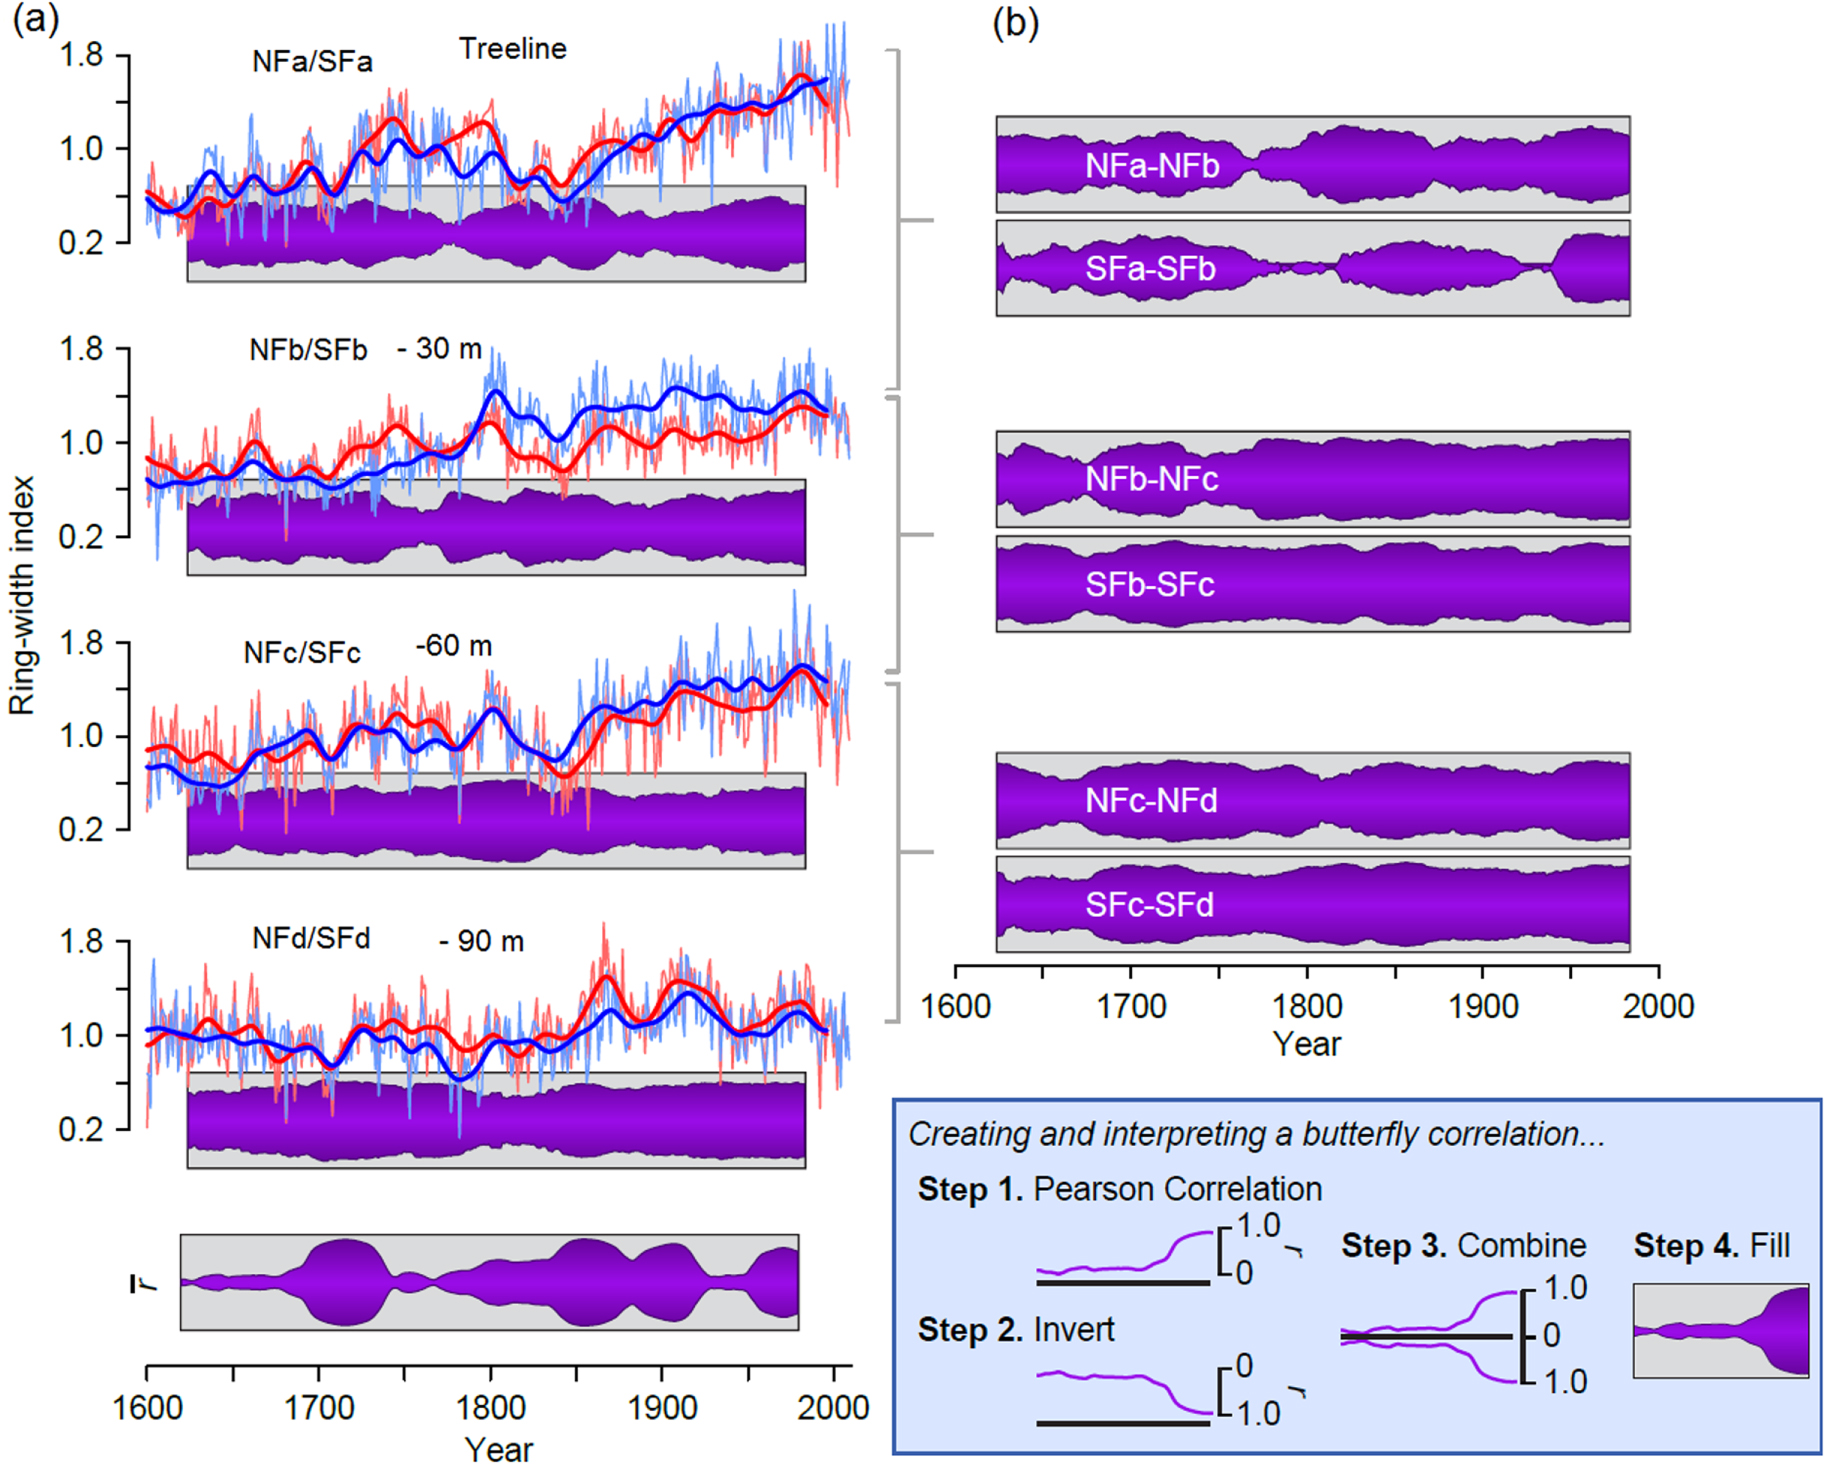
The c and d paired chronologies show less century-scale trend than the treeline chronologies and greater agreement over time and across aspects. For example, the butterfly correlations (figure 6(B)) are consistently high for the NFc/SFc and NFd/SFd comparisons. This agreement across aspect, along with nearly the same growth rates (figure 4) suggests that the trees at these elevations are consistently responding to the same environmental forcing(s).
Overall, there are some periods of strongly similar growth (e.g., ca. 1700–1750, ca 1800–1920s) and some periods of relatively weak coherence across the entire mountain top (e.g., ca. 1600–1700, ca 1750–1800) (figure 6(A) bottom). On the Southern Colorado Plateau, periods of strong coherence in ring-width at differing elevations have been interpreted as representative of either warm/wet (high growth) or cold/dry (low growth) conditions; on the other hand, weak coherence has been interpreted to represent warm/dry or cold/wet circumstances (Salzer and Kipfmueller 2005). The right panel butterfly correlations figure 6(B) indicate that the Northern slope highest chronologies are more similar to each other than the two highest Southern slope chronologies are to each other. It seems likely that both NFa and NFb trees have been primarily temperature limited for most of the last 400 years. However, SFa and SFb have differed more over time. Because these South-facing sites are warmer, the threshold elevation representing a switch in climate signal for them may have shifted up slope further and more often.
3.4. Potential problems with 'divergence' and 'dilution'
When the trees from which a chronology was derived undergo temporal changes or shifts in climate sensitivity, a potential problem can arise when reconstructing climatic variables from ring widths. For example, if annual ring widths were most sensitive to temperature for many years, but this sensitivity differed during a preceding or subsequent interval when tree growth was not limited by temperature, then any reconstruction produced from this chronology would be inconsistently accurate through time. In some high Northern latitude temperature-sensitive sites this has been referred to as a divergence problem (Briffa et al 1998, D'Arrigo et al 2007). The SFa chronology shows some evidence that this may have occurred due to warming in the late-20th century (figures 5 and 6(A)). The cause of this recent divergence appears to be warming. Given that the raw growth rates of upper treeline bristlecone pine have been consistently linked with temperature variability over much of the instrumental record and have not reached current levels in over 4000 years (Salzer et al 2009), it is questionable that such a divergence, or shift in sensitivity, occurred previously in the last few millennia. Rather, it seems likely that the highest upper treeline chronologies have been consistently linked to temperature throughout this interval, particularly on North-facing slopes.
Another potential problem when reconstructing climatic variables from ring widths involves the use of 'noisy' mean ring-width chronologies. This can occur when ring-width data from trees that are not sensitive to the same specific climatic parameter are averaged into a mean chronology. For example, if data from trees predominantly limited by temperature were combined with data from trees predominantly limited by precipitation, the overall climate signal exhibited by the resulting chronology would be muted. Variations not driven by common limiting factors are assumed to behave as noise and averaged out of the site chronology. This process can effectively 'dilute' the climate signal contained in the tree-ring chronology and result in a chronology confounded in terms of its climate signal. Our results indicate that particularly close attention needs to be paid to tree and site selection when building and interpreting bristlecone pine chronologies from near-treeline environments. Elevation, aspect, and topography (see Bunn et al 2011) all seem to influence the climate control of tree-ring variability at smaller scales than previously thought. In lower non-treeline environments this does not appear to be the case and there is a more homogeneous response to climate.
4. Conclusions
Dendroclimatology relies on networks of sites that represent approximations of the shared temporal variability found in collections of tree-ring samples from a particular location (Fritts 1976, Hughes 2011). Sites are areas thought to be similar with respect to the factors determining the climate control of tree-ring variability. The site principle relies on a common signal among all of the samples contributing to the site chronology due to their like responses to the same growth-limiting factor(s). We have shown that approximately 60–80 m of vertical elevation can be sufficient to create a change in the climate response of bristlecone pine. Trees below this elevation are not as effective temperature recorders as trees at treeline. Such fine-scale sensitivity, if present at other treeline sites around the world, would have important implications for chronology development and inferences of past climate variability. Treeline site chronologies should be constructed with this vertical heterogeneity in mind. Samples from upper treeline and from trees below treeline should not be mixed to avoid a 'diluted' or 'mixed-signal' site chronology, particularly at treeline sites that occur in relatively dry environments such as the White Mountains of California. Similarly, treeline samples from differing aspects should not be mixed to avoid problems and uncertainties related to potential 'divergences' and to 'dilution'. Interpretations of existing bristlecone chronologies need to take this into account, particularly when these ring width chronologies are used in climate reconstructions. Furthermore, bristlecone pine dendroclimatological research would benefit from the pursuit of mechanistic studies of bristlecone radial growth and from directly measured temperature and moisture variability in high alpine environments. Such research would help to more accurately describe the species response to climate variability. Millennial-length bristlecone pine tree-ring chronologies are an extremely valuable paleoclimatic resource. New studies that emphasize the importance of precise individual tree location and the measured physiological response of these trees to quantified local values of temperature and moisture will be a step toward using these archives to their full potential.
Acknowledgments
We gratefully acknowledge support from the National Science Foundation's Paleo Perspectives on Climate Change (P2C2) Program (Grants ATM-090227 and ATM-1203749). We thank the US Forest Service for access, and Thomas Wilding, Michael Medler, and John Rybczyk for assistance.