

Abstract
We perform a consequential life cycle analysis of plug-in electric vehicles (PEVs), hybrid electric vehicles (HEVs), and conventional gasoline vehicles in the PJM interconnection using a detailed, normative optimization model of the PJM electricity grid that captures the change in power plant operations and related emissions due to vehicle charging. We estimate and monetize the resulting human health and environmental damages from life cycle air emissions for each vehicle technology. We model PJM using the most recent data available (2010) as well as projections of the PJM grid in 2018 and a hypothetical scenario with increased wind penetration. We assess a range of sensitivity cases to verify the robustness of our results. We find that PEVs have higher life cycle air emissions damages than gasoline HEVs in the recent grid scenario, which has a high percentage of coal generation on the margin. In particular, battery electric vehicles with large battery capacity can produce two to three times as much air emissions damage as gasoline HEVs, depending on charge timing. In our future 2018 grid scenarios that account for predicted coal plant retirements, PEVs would produce air emissions damages comparable to or slightly lower than HEVs.
Export citation and abstract BibTeX RIS
1. Introduction
Plug-in electric vehicle (PEV) technologies, including plug-in hybrid electric vehicles (PHEVs) and battery electric vehicles (BEVs), have the potential to reduce environmental impacts from the transportation system by reducing or eliminating tailpipe emissions. However, the emissions associated with producing PEVs and generating the electricity to charge PEVs affect whether these vehicles have higher or lower life cycle environmental and health impacts compared to efficient gasoline vehicles (Michalek et al [1], Tessum et al [2]). Evaluating the sustainability of different transportation choices thus requires both a consideration of the full life cycle of the technology as well as an analysis of the impacts of the technology choice [3]. While there has been significant research to understand the life cycle environmental impacts of PEVs, most of this prior work has followed an attributional life cycle assessment (LCA) approach to answer the question 'what air emissions are PEV charging responsible for'? Such approaches have assumed that PEV charging produces emissions proportional to the average emissions rate for electricity generation in the political boundary (country, state, etc) or grid region (NERC region, eGRID sub-region, interconnect, balancing area, etc) where the vehicle is charged. Alternatively, some studies have used hypothetical emissions factors to evaluate a broader set of scenarios of the effects of PEV charging [1, 2, 4, 5]. The results from previous work thus vary depending on the researcher's value judgment related to the emissions that a PEV should be responsible for when charging in a particular location.
In contrast, a consequential approach answers 'what are the air emissions implications of PEV adoption in a region' by assessing how grid operations change in response to new charging demand. These consequential effects of PEV charging on grid emissions have been examined using empirical 'top-down' methods and normative 'bottom-up' methods [6]. Top-down empirical models of the power system, like those developed by Siler-Evans et al [7] and Graff Zivin et al [8], use regressions on historical data to estimate marginal emissions rates. Such analysis is grounded in the actual operations of the power system. However, the approach is limited to historical scenarios and is only appropriate for the analysis of small changes in generation or load. It also suffers from error in counterfactual analysis because correlations in past data do not necessarily imply causality. The gap between correlation and causality is particularly evident for the dispatch of hydroelectric plants, which may change generation timing in response to new load but typically will not change total energy generated in response to new load. Alternatively, bottom-up normative models of the power system, such as those used by Sioshansi et al [9], Peterson et al [10], Choi et al [11] and Weis et al [12], use optimization models to estimate how a power system should operate to minimize costs subject to a variety of constraints. These models can assess changes of grid operation in response to new PEV load. Such analysis can model future power plant scenarios and large load changes. While this approach has limited scalability for modeling large systems, and it is typically not possible to model all possible considerations that affect grid operations in practice, there is growing interest in using bottom-up models of the power system in consequential LCA.
Table 1 summarizes prior consequential LCA studies of PEV air emissions. Tamayao et al [6] apply two different top-down regression models [4, 5] to assess consequential greenhouse gas (GHG) emissions in the US, while Ma et al [13] perform their own regression on the operation of the UK grid. Sandy [14] and Onat et al [15] average results from ORNL's analysis of marginal emissions for electric vehicles using a dispatch model and different vehicle charging patterns [16]. Finally, Choi et al [11] construct a bottom-up capacity expansion and unit commitment model to assess consequential GHG emissions. In this paper, we adopt the bottom-up normative approach to model the power system under different scenarios in the PJM system in order to inform a consequential LCA of PEVs. Unlike previous work, our analysis includes the valuation of social damages associated with emissions of criteria air pollutants as well as GHG emissions. PJM (an independent system operator in Pennsylvania, New Jersey, Maryland, Ohio, and several other states) is an interesting power system to examine, as it is the largest independent system operator in the United States by population and has a large installed coal capacity. The supplemental information (SI) includes an expanded comparison of this study with previous life cycle studies of PEVs in the United States.
Table 1. Summary of literature estimating consequential life cycle air emissions from PEVs.
| Study | Location | Air emissions | Model type | Model detail |
|---|---|---|---|---|
| Tamayao et al [6] | US | GHG | Empirical | Applies regression results from [4, 5] |
| Choi et al [11] | Eastern Interconnect | GHG | Normative | Capacity expansion and unit commitment |
| Ma et al [13] | CA, UK | GHG | Empirical | Regression on plant operation to find average marginal emission factor |
| Sandy [14] | US | GHG | Normative | Averages resulting emissions from power plant dispatch in [16] |
| Onat et al [15] | US | GHG | Normative | Averages resulting emissions from power plant dispatch in [16] |
| This study | US PJM | GHG, SO2, NOx, PM2.5, CO, VOC | Normative | Optimal dispatch |
2. Methods
2.1. Life cycle boundary
We estimate the life cycle emissions of CO2, CO, SO2, PM2.5, NOx, and VOCs for conventional, hybrid, and PEVs, including the emissions from vehicle manufacturing, fuel production, and use. The analysis focuses on the region covered by the PJM interconnection, which has the largest electricity market in the US and serves 13 states in the Mid-Atlantic region [17]. For CVs and HEVs, the emissions from fuel production and use include upstream emissions from petroleum drilling and refining as well as the tailpipe emissions during vehicle operations. For BEVs, fuel production emissions include power plant emissions and upstream emissions from coal and natural gas production, but these vehicles do not have tailpipe emissions. Finally, PHEVs have emissions associated with both gasoline and electricity. Figure 1 shows the scope of the life cycle inventory. We do not consider end of life emissions. Further, we assume a total vehicle life of 160 000 miles for all vehicle types, following Michalek et al [1].
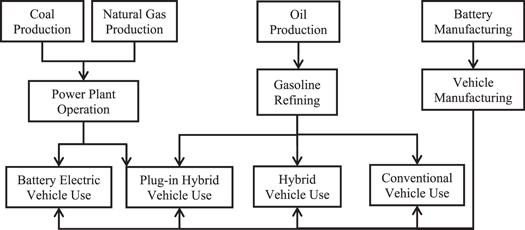
Figure 1. Life cycle inventory for plug-in electric, hybrid electric, and conventional vehicles.
Download figure:
Standard image High-resolution image2.2. Vehicle and power grid scenarios
For this analysis we rely on a unit commitment and economic dispatch (UCED) model previously developed and used to evaluate the costs and benefits of controlled charging of electric vehicles in the PJM system [12, 18]. This model uses a mixed integer linear optimization program to minimize the costs of operating the power system to meet load given constraints, including power plant operating constraints (minimum and maximum load, ramping rates, and minimum up and down time), as well as transmission and operating reserves constraints. Furthermore, the model incorporates vehicle charging by including charging requirements and battery constraints.
In order to account for changes in the composition of the PJM power plant fleet that may result from environmental regulations, renewable energy mandates, and changes in energy prices, we develop three scenarios of the power system. For the first scenario, we use the Environmental Protection Agency (EPA)'s NEEDS database in order to represent the recent PJM system [19]. Our second scenario, meant to represent a future grid, includes retirement of power plants predicted by the EPA [20] and a 3% wind penetration, as described in Weis et al [12]. Finally, in the third scenario we include the power plant retirements EPA predicts, and we add 20% wind. The additional wind generation for the future grid comes from NREL's Eastern Wind Integration and Transmission Study dataset [21]. For each scenario, we add wind sites in order of capacity factor to reach the required wind penetration level (3% for the second scenario and 20% for the third scenario).
We also account for differences in vehicle technology using Argonne National Laboratory's 2013 GREET 1 and 2 models [22, 23]. The base case PEV for the recent grid scenario is a 2010 PHEV-35, sized to represent the Chevy Volt. We also include a smaller battery size based on the Toyota Plug-in Prius and a larger battery size based on the Tesla Model S. The efficiency of the long-range BEV is that of the 2012 Tesla Model S, as measured by the EPA [24] (we examine more efficient BEVs in sensitivity analysis). For the future grid scenarios we use GREET's 2015 PHEV-35 vehicle specifications. Table 2 summarizes the differences across scenarios.
Table 2. Summary of scenarios.
| Scenario | Power system data | Conventional vehicle | Hybrid vehicle | Plug-in electric vehicles |
|---|---|---|---|---|
| 2010 GREET PHEV-10 (Plug-in Prius-sized) | ||||
| Recent (2010) | 2010 PJM | 2010 GREET ICEV | 2010 GREET HEV | 2010 GREET PHEV-35 (Volt-sized) |
| 2012 BEV-265 (Tesla-sized) | ||||
| Future (~2018) | EPA forecasted 2018 PJM with 3% wind penetration | 2015 GREET ICEV | 2015 GREET HEV | 2015 GREET PHEV-35 (Volt-sized) |
| Hypothetical high wind future | EPA forecasted 2018 PJM with 20% wind penetration | 2015 GREET ICEV | 2015 GREET HEV | 2015 GREET PHEV-35 (Volt-sized) |
2.3. Life cycle inventory
We determine the life cycle emissions for each stage shown in figure 1 for each vehicle type based on a 160 000 mile vehicle life. Table 3 provides a summary of the data used for each stage of the life cycle.
Table 3. Data for the life cycle emissions for each stage.
| Stage | Emission rate | Source | Other assumptions | Source |
|---|---|---|---|---|
| Power plant operation | Short Ton/year | Unit commitment model | Driving patterns and vehicle efficiency | NHTS GREET 1, fueleconomy.gov |
| Tailpipe | lb/mile | GREET 1 | Driving patterns | NHTS |
| Vehicle manufacturing | Short Ton/lifetime | GREET 2 | ||
| Battery manufacturing | Short Ton/lifetime | GREET 2 | ||
| Oil production | Short Ton/mile | GREET 1 | ||
| Gasoline refining | Short Ton/mile | GREET 1 | ||
| Coal production | Short Ton/MWh | GREET 1 | MWh produced using coal | Unit commitment model |
| Natural gas production | Short Ton/MWh | GREET 1 | MWh produced using natural gas | Unit commitment model |
2.3.1. Emissions from power plant operations
In order to estimate the change in emissions from the power system resulting from vehicle charging, we solve the UCED model both with and without electric vehicles and compare the difference in the operating schedules of the power plants. We add the charging load to the existing non-vehicle electricity load by assuming electric vehicles make up 10% of the vehicle fleet in PJM. Furthermore, we assume that electric vehicles are distributed throughout the PJM system proportionally to population (we test alternative assumptions in sensitivity analysis).
Using data from the National Household Travel Survey (NHTS) [25] we estimate the vehicle charging load, following Weis et al [12, 26]. The NHTS data provide the distance driven during each trip throughout the day surveyed as well as the time of each trip for approximately 100 000 passenger cars across the US. We use the distance driven in a day, the vehicle efficiency, and the electric range of the vehicle to calculate both the distance driven in charge-depleting versus charge-sustaining mode and the total charging load per day. We assume that all PHEVs drive as far as possible in charge-depleting mode before switching to charge-sustaining mode. We also assume that vehicle charging occurs at home after the last trip of the day and that each vehicle is fully charged by the first trip of the next day. For each fleet/vehicle type scenario, we calculate the hourly charging load for a scenario where charging begins at full power following the last trip of the day ('uncontrolled charging') and a scenario where the utility dynamically controls the rate at which each vehicle is charged in order to minimize generation cost ('controlled charging'). Controlled charging of electric vehicles may provide operational benefits to the grid, but it also changes the emissions associated with electric vehicle charging [12], so it represents an additional scenario for analysis. For the controlled charging scenarios, we use 20 representative vehicle profiles to model the load from the electric vehicles as described in Weis et al [12] and assume that the vehicle is constrained to be fully charged by the first trip of the following day while the charging rate is limited to Level 2 charging (7.2 kW).
2.3.2. Tailpipe emissions
The distance driven using the gasoline engine (all times for the CV and HEV and during charge-sustaining mode for PHEVs) and the vehicle's emission rate determine its tailpipe emissions. We assume that each vehicle travels 160 000 miles over its lifetime. Table 4 shows tailpipe emission rates for GHG, CO, SO2, PM2.5, NOx, and VOCs from the GREET 1 model [22]. While the two PHEVs burn some gasoline in charge-depleting mode, the BEV-265 operates without any tailpipe emissions.
Table 4. Tailpipe emissions in pounds per 1000 miles from GREET 1. The recent grid scenario relies on the data for the 2010 vehicles, while the future scenarios are based on the characteristics of the 2015 vehicles. CS: charge-sustaining mode. CD: charge-depleting mode.
| Vehicle | CO2-eq | VOC | CO | NOx | PM2.5 | SO2 |
|---|---|---|---|---|---|---|
| 2010 CV | 772 | 0.375 | 6.393 | 0.265 | 0.026 | 0.011 |
| 2010 HEV | 551 | 0.265 | 6.393 | 0.220 | 0.026 | 0.008 |
| 2010 PHEV-10 CS (Plug-in Prius) | 529 | 0.265 | 6.393 | 0.220 | 0.026 | 0.008 |
| 2010 PHEV-10 CD (Plug-in Prius) | 265 | 0.088 | 2.205 | 0.079 | 0.006 | 0.004 |
| 2010 PHEV-35 CS (Volt) | 683 | 0.265 | 6.393 | 0.220 | 0.026 | 0.010 |
| 2010 PHEV-35 CD (Volt) | 44.1 | 0.022 | 0.375 | 0.013 | 0.001 | 0.001 |
| 2010 BEV-265 (Tesla Model S) | 0.00 | 0.00 | 0.00 | 0.00 | 0.00 | 0.00 |
| 2015 CV | 705 | 0.375 | 6.393 | 0.265 | 0.026 | 0.011 |
| 2015 HEV | 507 | 0.265 | 6.393 | 0.220 | 0.026 | 0.007 |
| 2015 PHEV CS (Volt) | 573 | 0.265 | 6.393 | 0.220 | 0.026 | 0.009 |
| 2015 PHEV CD (Volt) | 41.9 | 0.016 | 0.397 | 0.014 | 0.001 | 0.001 |
2.3.3. Upstream emissions
Our life cycle emissions include the emissions from the production, processing, and delivery of fossil fuels (either to fuel the vehicles or to generate electricity), as well as the emissions from vehicle and battery manufacturing. Argonne National Laboratory's GREET 1 model [22] provides the emission rates for oil drilling and refining, which are the basis of the upstream emissions estimate for gasoline. Upstream emissions for vehicle and battery manufacturing come from the GREET 2 model [23].
To account for the emissions from the production, processing, and delivery of coal and natural gas for power plants used to charge the electric vehicles, we rely on the GREET 1 model, which provides these emissions on a per MWh basis (as shown in the supporting information). We then apply these emissions factors to the amount of electricity generated from coal and natural gas plants in the UCED model results. We include only the upstream emissions from coal- and natural gas-based electricity as these fuels account for the majority of generation response to additional vehicle charging load [12]. In the high wind scenario, wind power also contributes to vehicle charging, but wind requires no fuel and thus has no upstream emissions (our model does not include the emissions from building physical infrastructure).
2.4. Life cycle damages
Air emissions cause environmental degradation and affect human health. For CO2, we use estimates of the social cost of carbon that the US EPA uses for regulatory impact assessment [27]. EPA reports this social cost of carbon for three different discount rates: 2.5%, 3%, and 5%. We use the 3% discount rate average value for 2010 as our base value for all scenarios.
In order to estimate the damages from SO2, PM2.5, NOx, and VOCs we use the values from the AP2 model [28], which estimates the marginal health and environmental damages for emissions of each criteria air pollutant in each county in the United States. This model has many uncertain parameters, including the value of statistical life, which is used to monetize morbidity and mortality from air pollution. The AP2 model includes results from a Monte Carlo analysis of the damages in each county for the baseline year (2005). As a base case, we assume that these 2005 marginal damages per unit of emission in each location apply also to the recent grid and future grid scenarios. We use the distribution of the results from the Monte Carlo analysis to characterize the uncertainty within the AP2 model. Damages from vehicle charging are based on the change in the annual generation and emissions from each power plant in the UCED model that results from increased charging load. Since the AP2 values are specific to individual counties where emissions take place, we also need to incorporate the location of the vehicle tailpipe emissions. To do so, we allocate vehicles to counties within PJM proportionally to population. We further assume that each vehicle is driven within its respective county.
We allocate the emissions from vehicle and battery manufacturing to US counties identified by the US census as having automobile and parts manufacturing activity, weighted by the number of automotive manufacturing workers, following Michalek et al [1]. We also allocate coal, oil, and natural gas upstream emissions to US counties where mines, oil and gas fields, and refineries are located, weighted by the production in each county. Figure 2 shows the resulting cumulative probability distribution of damages from manufacturing, coal, oil and gas production, and oil refining. The damage calculations assume that all emissions and damages occur in the United States, though in practice some of these processes occur outside of US borders. Marginal emissions in other countries could incur higher or lower damages than in the US, depending on the existing pollutant concentrations and populations in those areas. At this time, however, we are unable to include these damages. We allocate the damages for all life cycle stages except for vehicle and battery manufacturing across the years of the vehicle lifetime, ignoring changes in the electricity grid over the vehicle life. We then used a 3% discount rate to find the present value of these damages, consistent with the calculation of CO2 damages.
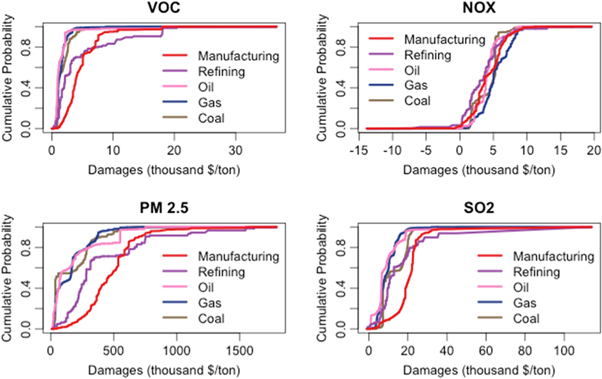
Figure 2. Cumulative probability distribution of damages per ton of pollutant released for assumed locations of upstream production emissions by pollutant type (using AP2 data for 2005).
Download figure:
Standard image High-resolution image3. Results
3.1. Life cycle emissions
Figure 3 shows the breakdown of estimated emissions by life cycle stage for each scenario. In the recent grid scenario, the PEVs have higher GHG, SO2, NOx, and PM2.5 emissions and lower CO and VOC emissions than the HEV. Compared to the CV, PEVs have higher SO2 emissions and lower CO and VOC emissions, while GHG, NOx and PM2.5 emissions may be higher or lower, depending on the PEV characteristics and the charging scenario. Controlled charging of PEVs increases emissions of GHGs, SO2, NOx, and PM2.5 while reducing emissions of VOCs compared to uncontrolled charging, due in part to the increased use of coal-fired power plants available at night. Use of coal generation increases with controlled charging in all scenarios because these plants have lower marginal cost than gas plants and have more excess capacity available in off-peak hours than during uncontrolled charging ours (the hours immediately following the vehicle's first home arrival at the end of the day). For a detailed description of the analysis and assumptions regarding the response of power plant dispatch to additional electric vehicle charging load see [12].
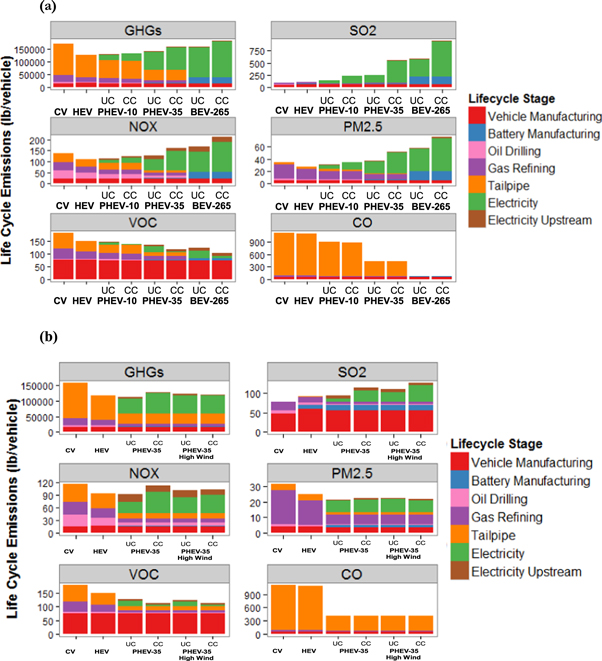
Figure 3. Life cycle emissions by pollutant and life cycle stage for each vehicle type in the recent (a) and future (b) PJM grid. UC stands for uncontrolled charging and CC stands for controlled charging.
Download figure:
Standard image High-resolution imageIn the future grid scenarios, compared to the HEV, the PHEV-35 has higher SO2 emissions and lower PM2.5, VOC, and CO emissions, while GHG and NOx emissions may be higher or lower, depending on the charging scenario and wind power scenario. Compared to the CV, the PHEV-35 has higher SO2 and lower GHG, NOx, PM2.5, VOC, and CO emissions. Controlled charging of the PHEV-35 increases SO2 and NOx while decreasing VOC emissions, but the effect on GHG and PM2.5 emissions depends on the presence of wind, and the effect on CO emissions is negligible.
3.2. Life cycle damages
3.2.1. Expected values
PEVs have higher expected life cycle damages than hybrid vehicles in the recent PJM scenario in all cases examined, as shown in figure 4. Their expected damages are also higher than those of conventional vehicles, except for the case of the PHEV-10 with uncontrolled charging. Long-range BEVs cause two to three times as much air emissions damage as HEVs. The electricity generation damages come largely as a result of the SO2 emissions from the coal plants used to charge the vehicles in off-peak hours. Controlled charging increases life cycle damages relative to uncontrolled charging because of the increases in emissions associated with higher levels of coal generation. Uncertainty is not presented here because common sources of uncertainty create correlated uncertainty across scenarios, so error bars could be misleading in comparing across cases. Instead, section 3.2.2. includes an analysis of uncertainty and robustness in these results.

Figure 4. Expected value of life cycle air emission damages for each vehicle type in the recent PJM grid. UC stands for uncontrolled charging and CC stands for controlled charging for the electric vehicles.
Download figure:
Standard image High-resolution imageIn the future scenarios, shown in figure 5, the PHEV-35 is able to reduce life cycle damages by a few hundred dollars over its lifetime compared to the CV and the HEV. Again, PEVs tend to produce larger damages under controlled charging than under uncontrolled charging, but in the future scenarios the PHEV-35 provides benefits compared to the CV and the HEV regardless of the charging scheme. The high-wind future scenarios do not necessarily imply lower consequential damages than the low-wind future scenarios for PEVs because added wind displaces fossil fuel plants, which can increase the availability of coal on the margin when PEVs charge.

Figure 5. Expected value of life cycle damages in the future PJM grid. The high wind scenario has 20% of demand met by wind. UC stands for uncontrolled charging and CC stands for controlled charging.
Download figure:
Standard image High-resolution image
3.2.2. Uncertainty and robustness
Qualitatively, our key findings are that (1) the PEVs cause more damage than the CV and HEV in the recent PJM grid, (2) the PHEV-35 causes less damage than the CV in the future PJM grid scenarios, but these damages are not much lower than those for the HEV, and (3) controlled charging tends to increase damages compared to uncontrolled charging, though the PEVs provide benefits compared to the CV and HEV in the future grid scenarios regardless of charging scheme. To characterize uncertainty and robustness of these findings, we use the Monte Carlo analysis results from the AP2 model and assess the probability that each vehicle technology has higher life cycle air emissions damages than the HEV. Table 5 reveals that the conclusions above are robust, especially in the recent grid. The uncertainty in the AP2 models does not significantly affect the comparison across vehicle types because most of this uncertainty is a result of uncertainty in the value of a statistical life, which affects damage estimates across all cases. As a result, this uncertainty typically changes only the magnitude of the difference between hybrids and other vehicles, not the sign.
Table 5. Robustness of results for the damage difference between hybrid vehicles and each other vehicle type. CV = conventional vehicle.
| Scenario | Charging | Probability damages are larger than for HEV's | Mean change in life cycle damages compared to HEV's |
|---|---|---|---|
| CV—recent grid | 100% | $650 | |
| PHEV-10—recent grid | Uncontrolled | 81% | $210 |
| Controlled | 98% | $1100 | |
| PHEV-35—recent grid | Uncontrolled | 95% | $1200 |
| Controlled | 99% | $4200 | |
| BEV-265—recent grid | Uncontrolled | 99% | $4800 |
| Controlled | 99% | $8400 | |
| CV—future grid | 99% | $580 | |
| PHEV-35—future grid | Uncontrolled | 4% | −$420 |
| Controlled | 28% | −$60 | |
| PHEV-35—future grid with high wind | Uncontrolled | 17% | −$150 |
| Controlled | 18% | −$150 |
The results in table 5 incorporate only the uncertainty quantified in the AP2 model due to uncertainty in input parameters, such as the value of a statistical life. We examine the effect of some of the other important input parameters and assumptions through sensitivity cases summarized in table 6 and detailed in the supporting information. These include alternative assumptions for (1) emissions damage models, (2) BEV efficiency, (3) power grid characteristics that influence dispatch decisions, (4) PEV adoption patterns, and (5) policy effects on consequential life cycle implications. Our key findings are generally robust, though future fuel prices could affect the consequential emissions benefits of PEVs versus HEVs; binding SO2 caps would likely make PEVs more competitive; and assessing a larger consequential life cycle scope that accounts for the effect of PEV adoption on each manufacturer's vehicle fleet emissions due to US corporate average fuel economy and GHG emission policy results in the conclusion that PEV adoption increases damages in all scenarios modeled (the policy extends through 2025) [29].
Table 6. Summary of findings from sensitivity analysis.
| Sensitivity scenario | Purpose of scenario | Finding |
|---|---|---|
| AP2 2011 damage estimates | Test more recent estimates of damages per ton emissions from each location | Higher estimated damages, but key findings are robust. Increased potential for PEVs to lower damages versus HEVs in future grid |
| EASIUR damage estimates | Test an alternative method for estimating damages | Higher estimated damages, but key findings are robust. PEVs have comparable damages versus HEVs in future grid |
| High efficiency long-range BEV | Test the life cycle damages of a BEV with comparable performance to the other vehicles | Lower estimated damages but key findings are robust. BEVs have higher damages than CVs, HEVs, and PHEVs in the recent grid |
| Future with expensive coal, cheap natural gas | Test effect of possible future fuel prices | PEVs slightly increase damages versus HEVs when uncontrolled, reduce damages when controlled |
| Future with cheap coal, expensive natural gas | Test effect of possible future fuel prices | PEVs slightly reduce damages versus HEVs whether uncontrolled or controlled |
| Additional spinning reserves required for high wind case | Test effect of higher reserve requirements for intermittent wind | Key findings are robust |
| No transmission constraints | Test effect of transmission constraints and location of loads and responding generators | Key findings are robust |
| PEVs in urban areas only | Test effect of location of vehicles | Key findings are robust |
| SO2 cap | Test effect of a binding SO2 cap | SO2 damages likely reduced, but not necessarily to zero since PEV charging may affect location of SO2 emissions. PEVs likely reduce damages |
| CAFE leakage effect | Test effect of vehicle fleet-wide emissions enabled by PEV sales due to CAFE incentives for AFV adoption | PEVs increase overall US damages versus HEVs even in future grid and even with high wind penetration |
4. Discussion and conclusions
Using a consequential LCA approach for the vehicles and scenarios modeled, we find that (1) PEVs cause more damage than HEVs in the recent PJM grid, (2) PEVs cause comparable or slightly lower emissions than HEVs in the future PJM grid scenarios, and (3) utility-controlled (mostly nighttime) PEV charging tends to increase life cycle emissions compared to uncontrolled charging. However, (1) changes in future fuel prices could affect whether PEVs have higher or lower damages than HEVs in a future grid and whether controlled charging increases or decreases emissions, and (2) when the effect of US PEV adoption on automaker fleet emissions is accounted for, PEV adoption could increase emissions in all scenarios due to leakage effects in federal fuel economy standards [29, 34–36]. The SI includes a discussion about the limitations of the model beyond the scope of the sensitivity analysis.
Our results for the recent PJM grid are consistent with those from Tessum et al using the 2007 electricity mix [2]: PEVs have higher damages than gasoline vehicles in the recent grid. Michalek et al [1] found that PEVs with larger batteries cause more damage, which we also observe in our recent grid scenarios. None of the PEVs in our study, regardless of battery size, have lower damages than the HEV in the recent grid due to the large amounts of coal on the margin in PJM compared to the average mix used in Michalek et al [1]. The future of the grid past 2018, which is relevant for future PEV adoption, is expected to be lower-emitting than the recent grid, but consequential emissions from a grid far into the future are difficult to meaningfully project. Both Michalek et al [1] and Tessum et al [2] find that PEVs can reduce damages if charged with zero-emission electricity. This is a useful bounding case but not a scenario likely to occur soon, since even if wind, solar, nuclear, and hydroelectric power make up a much larger portion of the grid mix in the future, the consequential effect of PEV charging (the difference between grid operations when PEVs are present versus absent) is still primarily to increase generation from fossil fuel plants. Since most wind, solar, nuclear, and hydroelectric power is fully used in the absence of PEV load, PEV adoption will not cause an increase in generation from these plants. Only when low-emission plants would have been curtailed in the absence of PEVs can PEV adoption result in increased use of these plants. Thus, the consequential emissions of PEV charging are affected more by the mix of coal and natural gas plants in a region than by the amount of renewable or low-emission generation capacity.
The difference between coal and natural gas generation is significant. We show that even in one of the power systems in the country with the highest coal generation, PEVs could reduce transportation health and environmental damages in the near future, long before a zero-carbon electricity mix is achieved, due primarily to substitution of natural gas for coal on the margin.
While PEVs can double or triple air emission damages in the recent grid relative to HEVs, they could reduce damages in a future grid. However, we estimate that near future (∼2018) potential air emissions benefits from PEV adoption in PJM are small relative to HEVs (or even negative when considering the net effect on the automaker's fleet under federal fuel economy policy). Nevertheless, electrification may offer a promising long term option to significantly reduce air emissions from the transportation sector compared to some other alternative transportation fuels, including biofuels and natural gas, that have been shown to offer small-to-no reductions in GHG emissions and could have unintended consequences like higher global food prices [30, 31]. Indeed, the logistics of regulating emissions from individual vehicles over their functional lives are more difficult than regulation of power plant emissions [37].
Continued regulation of the electricity system can increase the benefits of vehicle electrification, and consequential air emissions implications of PEV charging are already lower in many regions than in PJM [6]. While near-term benefits of PEV adoption in PJM are estimated to be small or negative, a transition of the transportation system could lead to long-term benefits outside the scope of this analysis, including greater benefits in other regions and future emissions savings enabled by a transition to electric vehicles as the electricity grid becomes cleaner and as public policy adjusts [32, 33].
Acknowledgments
We would like to thank to Nick Muller for his support with the APEEP and AP2 models as well as Peter Adams and Jinhyok Heo for their help with the EASIUR model. The Doris Duke Charitable Foundation, the Richard King Mellon Foundation, the Electric Power Research Institute, and the Heinz Endowment provided support for this research through the RenewElec project (www.renewelec.org). The National Science Foundation also provided financial support through a Graduate Research Fellowship, and Toyota Motor Corporation provided support through a financial gift. Findings and conclusions are the sole responsibility of the authors and may not represent the views of the funding entities.