

Abstract
Plug-in electric vehicles (PEVs) are a promising option for greenhouse gas (GHG) mitigation in the transport sector - especially when the fast decrease in carbon emissions from electricity provision is considered. The rapid uptake of renewable electricity generation worldwide implies an unprecedented change that affects the carbon content of electricity for battery production as well as charging and thus the GHG mitigation potential of PEV. However, most studies assume fixed carbon content of the electricity in the environmental assessment of PEV and the fast change of the generation mix has not been studied on a global scale yet. Furthermore, the inclusion of up-stream emissions remains an open policy problem. Here, we apply a reduced life cycle assessment approach including the well-to-wheel emissions of PEV and taking into account future changes in the electricity mix. We compare future global energy scenarios and combine them with PEV diffusion scenarios. Our results show that the remaining carbon budget is best used with a very early PEV market diffusion; waiting for cleaner PEV battery production cannot compensate for the lost carbon budget in combustion vehicle usage.
Export citation and abstract BibTeX RIS

Original content from this work may be used under the terms of the Creative Commons Attribution 4.0 license. Any further distribution of this work must maintain attribution to the author(s) and the title of the work, journal citation and DOI.
1. Introduction
Transport is responsible for about one quarter of global energy related greenhouse gas (GHG) emissions and transport is the only energy-related sector with emissions still growing compared to 1990 [1, 2]. Road vehicles contribute the largest share to these emissions and current projections indicate a doubling of the passenger vehicle fleet until 2050 [3]. Consequently, an increased market share of alternative fuel vehicles, such as plug-in electric vehicles (PEVs), including plug-in hybrid electric vehicles (PHEVs) and battery electric vehicles (BEVs), powered from renewable energy sources seems essential for significant GHG mitigation in passenger road transport. There are already many studies comparing GHG emissions of PEVs to internal combustion engine vehicles (ICEVs) on a life-cycle basis [3–5].
Past studies have shown that life-cycle PEVs emissions depend heavily on the assumed electricity mix, driving patterns and ambient weather conditions [6–9]. These factors vary regionally, so PEV emissions can also vary regionally.
Yuksel et al [6] consider regional differences due to marginal grid mix, ambient temperature, patterns of vehicles miles travelled, and driving conditions. They find that PEVs can have larger or smaller carbon footprints than gasoline vehicles, depending on these regional factors and the specific vehicle models being compared. However, Yuksel et al [6] use fixed historic carbon intensities and mention it as drawback in the discussion themselves. The exact results vary widely depending on the input assumptions and the source of electricity used for recharging. Consequently, the impacts are highly uncertain. Cox et al [4] quantify parametric uncertainty and include changes to driving patterns due to the introduction of autonomous and connected vehicles. They perform a very comprehensive analysis of the uncertainty of many parameters with carbon intensity of the grid electricity in several scenarios. Yet, they use fixed intensity for the vehicle lifetime with 2017 or future 2040 values and neglect the changes in between. Likewise, Tamayao et al [7] study different charging patterns and local grid mixes, but neglect the future evolution of carbon intensity. Xu et al [10] considered the emissions from the whole PEV life cycle by a life cycle assessment (LCA) and combined this with a sophisticated consideration of charging times in the European energy system. They concluded that on the European scale, a reasonable replacement of ICEVs by PEVs can lead to a substantial reduction in GHG emissions, but still depending on some uncertainties such as charging patterns. Kim et al [11] report the first cradle-to-gate emissions assessment for a mass-produced battery in a commercial BEV and compared the cradle-to-gate GHG emissions to an ICEV.
However, a major advantage of PEVs overlooked in most parts of the literature is the fast transformation of the energy system: a reduction in carbon intensity of electricity leads directly to lower upstream emissions and accordingly to lower emissions from the fuel perspective (i.e. well-to-wheel emissions) and lower emissions from vehicle and battery production (i.e. life-cycle perspective). For ICEVs this is only possible if low-carbon fuels, such as biofuels or synthetic renewable fuels are introduced in large quantities, which is highly uncertain [12].
Cox et al [4] show that it is imperative to consider changes to the electricity sector when calculating upstream impacts of PEVs, as without this, results could be overestimated. They included the impacts of changes to the electricity sector on the environmental burdens of producing and recharging future PEVs. Electricity used for charging is the largest source of variability in results. Woo et al [13] state that the reduction of GHG emissions by PEVs is strongly dependent on the country-specific electricity mix. In this regard, Brynolf et al [12] focus on the reduced fossil carbon intensity by the introduction of low-fossil-carbon fuels. Accordingly, we do not consider low-carbon or carbon-free fuels in the following but focus on the indirect emissions from PEV and the changes with respect to the energy transition in electricity generation, i.e. lower GHG emissions for battery production and lower upstream emissions for electricity generation, which impacts the vehicle usage phase of all current PEVs [4, 11].
The overall GHG emission reductions from PEVs are mainly driven by the development of vehicle stock and specific emissions from electricity generation. In the present study, we combine two PEV market scenarios with one electricity generation scenario, all scenarios are taken from the International Energy Agency (IEA) [3]. The first PEV market diffusion scenario is the IEA's EV30@30 market diffusion scenario (i.e. 30% sales share in 2030). This rather ambitious scenario is compared to a second PEV market scenario, the New Policy Scenario (NPS) that includes policies currently in action and policies that have been announced. The PEV sales shares according to these scenarios are translated to absolute sales in the most important markets globally and aggregated to a vehicle stock. Our vehicle stock model for PEVs differentiates between BEVs and PHEVs. Our analysis covers China, the US, Europe, India, and Japan. Jointly, these markets presently cover 80% of global passenger car sales and this share is expected to grow further in the future [9].
The carbon intensity of the electricity is taken from the Sustainable Development Scenario (SDS) 4 . This scenario is consistent with the Paris Agreement, i.e. it respects the 'well-below 2°' target. The carbon intensity of the grid declines in all major regions and is expected to be close to 0 gCO2/kWh in 2050 (cf figure 1). Please note that we have to choose an additional scenario for the carbon content of electricity, as the PEV diffusion scenarios alone do not make statements about the carbon content of the electricity.
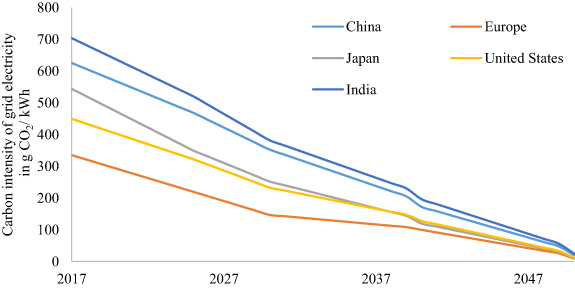
Figure 1. Carbon intensity of grid electricity in gCO2/kWh in major global economies according to the SDS of the IEA's World Energy Outlook [1].
Download figure:
Standard image High-resolution imageEven without low-carbon fuels, ICEVs could improve their fuel efficiency further in the future but the reduction potential seems limited [14]. We assume that tailpipe emissions will decrease to 85 gCO2/km but—even with mild hybridisation—no further [15]. Similar to PEVs, the upstream emissions from fuel production and transport are included in our well-to-wheel emissions of ICEVs.
2. Methods
We applied a reduced LCA approach including manufacturing emissions (for vehicle and battery) of PEVs (cf figure 6). The focus lies on the usage phase, with additional consideration of emission factors from literature resulting from battery and vehicle production [16–19]. As the experience with PEV disposal is still limited we decided not to consider vehicle disposal in our analysis.
Our analysis focuses on the impact from GHG emissions in the electricity sector on the LCA [6]. We investigate a future energy scenario for different global markets (China, Europe, Japan, United States, and India) with high passenger car sales and link them to two different PEV market diffusion models [1, 20–22]. Because of the decarbonisation of electricity generation, PEVs have the potential to emit less GHG than ICEVs with conventional fuels in all countries considered. Therefore, we assess the potential influence of the combined consideration of electricity generation mix and PEV market diffusion in Europe, China, Japan, United States, and India emphasizing the usage phase under consideration of battery and vehicle production.
2.1. Calculation of GHG emissions
2.1.1. GHG emissions from vehicle production
In a first step, the manufacturing GHG emissions for vehicle and battery production were calculated. All vehicles considered were assumed to be identical, with the exception of the addition of the batteries for PEVs. The associated assumptions are explained in the following and are also shown in table 1 in the appendix. The average battery capacity for BEV counts 25 kWh in 2017 and increases to 35 kWh (2030) [1, 3, 23]. Similarly, for PHEVs, the average battery capacity increases from 12 kWh in 2017 to 20 kWh in 2030 [3]. The indirect battery emissions included decline from 140 kgCO2 per kWh in 2017 to 75 kgCO2 per kWh in 2030 [11]. The GHG emissions for vehicle production are assumed 35 gCO2/km in the period from 2017 to 2030. From 2030 on, they decrease linearly to 0 gCO2/km in 2050 [24]. Hence, only emissions from production of batteries and vehicles are covered. In addition, it is assumed that the vehicles have a lifetime of 12 years or 150,000 km of vehicle kilometres travelled for all countries until 2050 and that battery and vehicle production in 2050 will be completely carbon-free [25]. Due to the international production sites, the same emissions for production are assumed in the international comparison.
2.1.2. GHG emissions in the usage phase
In the vehicle usage phase, a distinction is made between emissions from fuel consumption for ICEVs and emissions from the supply of electricity for PEVs. Regarding the emissions from fuel consumption, a well-to-wheel GHG emission factor of 3.183 kgCO2 per litre of gasoline (including upstream emissions) and a fuel economy of 0.07 l per kilometre (7 l/100 km or 33.6 MPG) are assumed [26]. Since the real fuel consumption of new ICEVs is on average about 40% higher than stated by the vehicle manufacturer, a GHG emission factor of 297 gCO2/km was assumed for 2017 [15, 27]. From the year 2030, a GHG emission factor of 85 gCO2/km is used [15]. This assumption remains valid until the year 2050. The relevant calculations of the country-specific emissions of the well-to-wheel phase for PEV are based on the emissions of electricity generation and derived from the SDS [1]. Electricity production efficiency and GHG emissions per kWh electricity differ significantly among countries. This is also true for their development over time. The specific emissions from electricity generation for different countries are given in figure 1.
Including the emissions for each energy source [28], the GHG emissions during the BEV usage phase are derived. Hence, BEV electricity efficiency was assumed to be 0.205 kWh/km, i.e. 20.5 kWh/100 km [29], and fixed over time. Multiplying the specific emissions from electricity generation by the BEV electricity efficiency results in the emissions for BEVs in the usage phase. For the PHEVs, the emissions from the usage phase are calculated using an utility factor, i.e. the share of kilometres driven on electricity. As the PHEV battery sizes increases from 12 to 20 kWh between 2017 and 2030, the utility factor is assumed to increase from 0.5 in 2017 to 0.75 in 2030 in line with existing studies [30].
2.1.3. Overall GHG emissions
Taking into account the emissions from the vehicle production and the vehicle usage phase as well as the mileage of 150,000 km, the overall GHG emissions are obtained (cf figure 2). Here, the emissions from the vehicle use phase are summed over a period of 12 years to take into account the change in emissions from electricity generation. The annual GHG emissions of PEVs in stock are reduced with every year of operation when the generation mix improves. This is fundamentally different from ICEVs - at least when not considering biofuels. This effect might even become stronger when disposal of PEVs is included in the analysis, because current disposal processes are still in an initial phase.

Figure 2. Left: overall GHG emissions for (a) BEVs and (b) PHEVs for different global markets. Right: life-cycle CO2 emissions in gCO2/km for newly sold PEVs over time. The range indicates the range of emission values among major global markets (i.e. China, the United States, European average, India, and Japan).
Download figure:
Standard image High-resolution image
Figure 3. Different mitigation potentials for China by PEV against conventional ICEV.
Download figure:
Standard image High-resolution image
Figure 4. Life-cycle CO2 emissions in gCO2/km for newly sold PEVs over time assuming constant GHG emissions from electricity generation over time. The range indicates the range of emission values among major global markets (i.e. China, the United States, European average, India, and Japan).
Download figure:
Standard image High-resolution image2.2. Market diffusion scenarios of PEVs
At the same time, the uncertainty of PEV market penetration is high. Consequently, we consider an ambitious scenario (EV30@30) and an alternative scenario with a decelerated market take-up of PEVs (NPS). The EV30@30 scenario pursues the ambitious goal of a market share of 30% for PEVs by 2030 [3]. Current and future PEV market share and stock in 2017 up to 2050 for BEVs, PHEVs, and ICEVs are based on these scenarios (cf appendix figures 7 and 8).
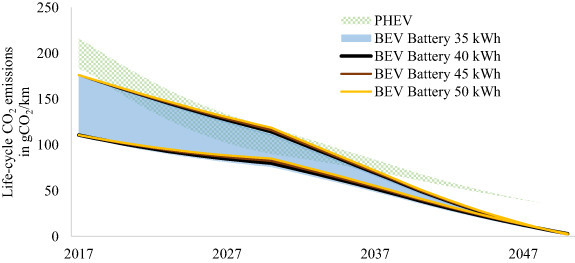
Figure 5. Life-cycle CO2 emissions in gCO2/km for newly sold PEVs over time for different battery capacities for BEVs. The range between two lines of the same colour reflects the range of emission values among major global markets (i.e. China, the United States, European average, India, and Japan).
Download figure:
Standard image High-resolution image
3. Results
We combine the scenarios for future PEV stock in the major car markets with values from literature on their life-cycle GHG balances and the impact from the decreasing carbon intensity of electricity over time. Consequently, the development of specific GHG emissions of PHEVs and BEVs in gCO2/km shows a fast decrease until 2050 (cf figure 2). While we assume that all newly registered PEVs show the same GHG footprint for a given year and for all regions (highly internationalized car market), the overall emissions are lower for those regions with low grid carbon intensities.
Today, these emissions of BEVs are in the range of 111–176 gCO2/km (lowest for the European average and highest for India). For PHEVs, the emissions are slightly higher in the range of 183–216 gCO2/km due to the additional part-time operation of the combustion engine. BEV life-cycle emissions can reach almost zero until 2050 whereas PHEVs are assumed to use conventional gasoline and thus their life-cycle emissions saturate at slightly higher levels in 2050.
Both, the future emissions of BEVs and PHEVs show a note-worthy change and clear decline due to the fast grid decarbonisation in many countries of the world.
Within the ranges of well-to-wheel emissions, the speed of GHG reduction varies among the countries. This becomes obvious even for European countries, where values may differ significantly from the European average (which is considered in figure 2): E.g. while in Germany, current PHEVs and BEVs life-cycle emissions are closer to the European average, Polish emissions show higher values throughout the time-horizon considered.
The remaining emissions in 2050 stem from the usage phase only, which makes the carbon intensity of electricity to the dominant factor. Due to the assumptions from the SDS, the GHG emissions from battery production are close to zero by 2050. Near-zero GHG emissions from all passenger cars are in line with the ambition CO2 mitigation required to limit global warming to well below 2 °C [31].
The results in figure 2 demonstrate that PEVs can lead to the required reduction. However, the full car stock needs to be near zero emission operation. Accordingly, policies have to make sure that full car stock is electric by 2050 or that the remaining fuel used to power ICEVs is carbon neutral. Thus, potential policies need to address the two aspects of (a) PEV diffusion and (b) low-carbon fuels simultaneously. Potential policies to address these topics are CO2 fleet targets and PEV mandates for the first aspect and low-carbon fuel standards for the second aspect [31].
The above-mentioned fast mitigation potentials by PEVs over time should, however, not be interpreted as an argument for postponing the PEV market penetration by hoping to profit from the younger (i.e. less expensive and smaller carbon footprint) fleet in the future. For further investigation of this argument, we constructed two additional scenarios for China, as an example, based on the ambitious EV30@30 scenario. We assumed that the Chinese PEV market diffusion could deviate from the ambitious governmental market plans by postponing the market take-up by 10 years (i.e. the market share of the EV30@30 scenario in 2030 is achieved not before 2040).
After 2040, the market penetration may accelerate significantly to still achieve the same aggregated number of PEVs sold by 2050. We refer to this scenario as 'CHNlagged/ambitious'. In a second scenario, the market penetration may increase smoothly and similarly to the EV30@30 scenario, we refer to this as 'CHNlagged/realistic'. The resulting mitigation potentials compared to a pure ICEV fleet with conventional fuel are calculated and shown in figure 3. In comparison of the two additional scenarios to the original EVS30@30 scenario for China, it is clear that neither the CHNlagged/realistic scenario nor the CHNlagged/ambitious scenario achieve the same mitigation potential as the EV30@30 scenario until 2050. In terms of figure 3, the blue area (150 MtCO2) exceeds the green area (46 MtCO2) significantly. Considering the annual mitigation potentials in figure 3, it seems more than challenging to overcompensate the missed mitigation even until 2060. Calculations for other markets show similar results. Hence, in our analysis the CO2 budgets of accelerated PEV market scenarios always undercut those of lagged market scenarios.
4. Sensitivity analysis
We perform a sensitivity analysis to investigate how changes in electricity mix and battery capacity affect the LCA emissions from PEVs. First, we compare the results from the previous section to a model with constant GHG emissions from electricity generation over time by keeping the current electricity mix (2017) constant. The resulting LCA emissions are flat in the beginning and show a slight decrease after 2030 as the emissions from vehicle production are assumed to decrease linearly from 2030 onwards. This applies to both PHEVs and BEVs. Hence, assuming the constant electricity mix from 2017, the LCA emissions for BEVs results in poor values (between 121 gCO2/km (EU) and 197 gCO2/km (India) in 2030 and in a range of 69–144 gCO2/km (lowest for the European average and highest for India) in 2050). For PHEVs, the emissions are higher in the range of 226–266 gCO2/km for 2030 and between 183 gCO2/km and 221gCO2/km in 2050 due to the additional partial operation of the combustion engine. Consequently, the difference to the scenarios considering rapid decarbonisation of the electricity system (see above) becomes obvious (cf figures 4 and 2).
Second, the impact from battery capacity is analysed. From the current perspective it is unclear how the increasing habit with EV and further automatization of vehicles may have an influence on battery capacities. With increasing battery capacities (i.e. from 35 to 50 kWh), the resulting LCA emissions in the initial year increase, too. This can be explained by the increased manufacturing emissions of the higher battery capacity. However, due to the decarbonizing electricity mix over time, this effect becomes marginal until 2050 (cf figure 5).
5. Discussion
Our findings come with a number of uncertainties and future parameters may evolve other than expected. First, the scenarios and GHG mitigation potentials rely on a set of assumptions, which we based on current literature. However, all relevant electricity scenarios assume a future decarbonisation of electricity generation, although at different speeds. Thus, the observed effect on carbon budget is robust against variation of the chosen scenario, yet the magnitude of the effect may vary. For example, current carbon content of battery production is about 75 kgCO2/kWh. However, the future carbon content of the battery from production is expected to decline further (IEA, 2020) as the share of renewable electricity is growing in major battery producing countries and newer and larger factories have higher utilisation. For the long-term until 2050, several major battery-manufacturing countries (US, China, Japan, and Europe) have declared to achieve climate neutrality by 2050 or 2060. Accordingly, carbon content of battery production will likely be very low in 2050. Interestingly, we identified that the share of emissions from production differs among countries - depending mainly on the national electricity mix. And there is again a dynamic effect: over time the share of emissions during the production phase increases. However, the increase in battery capacities has only a marginal impact on the change in the life-cycle CO2 emissions. This can be explained by the shares of the battery production emissions of the life-cycle CO2 emissions. In 2030, these have a share of between 16% and 22% for a 35 kWh battery and rise to a share of between 21% and 29% for a 50 kWh battery. But there are still some uncertainties about future developments [32, 33]. Hence, while an improve in the national electricity mix (where the car is used) seems more significant today, it might be desirable to focus more on emission reductions for vehicle production later, but far before 2050.
Second, there are other options apart from PEVs to reduce GHG emissions in transportation such as non-motorised or active modes as well as biofuels and synthetic fuels. Our results do not show that PEVs are preferable to these other measures but that if one chooses market diffusion of PEVs as a path for CO2 reduction in passenger cars and expect the decarbonisation of electricity generation, one should not wait but increase market diffusion as soon as possible. Accordingly, any replaced conventional ICEV provides savings in the carbon budget if the energy transition in electricity generation proceeds as expected.
6. Conclusion
GHG emissions from PEVs exhibit a strong temporal change due to grid decarbonisation in many countries. The common assumption of fixed carbon intensity in the grid in many studies highly underestimates this change. Furthermore, if PEVs are chosen as a key option to reduce passenger car GHG emissions, then PEV market diffusion should not be postponed as improvements in electricity carbon intensity can immediately increase the remaining carbon budget. Our results demonstrate that a postponement of PEV market diffusion negatively influences the remaining carbon budgets.
Acknowledgments
The authors acknowledge support from the Profilregion Mobilitätssysteme Karlsruhe, which is funded by the Ministry of Economic Affairs, Labour and Housing in Baden-Württemberg and as a national High Performance Center by the Fraunhofer-Gesellschaft. Patrick Plötz acknowledges support from the Paris Reinforce EU Horizon 2020 project (grant agreement No. 820846).
Data availability statement
All data that support the findings of this study are included within the article (and any supplementary files).
Footnotes
- 4
In the SDS only values for the whole EU are given. We, therefore, consider country specific values from EU Reference Scenario [34] for European countries instead.