

Abstract
The term 'carbon lock-in' refers to the tendency for certain carbon-intensive technological systems to persist over time, 'locking out' lower-carbon alternatives, and owing to a combination of linked technical, economic, and institutional factors. These technologies may be costly to build, but relatively inexpensive to operate and, over time, they reinforce political, market, and social factors that make it difficult to move away from, or 'unlock' them. As a result, by investing in assets prone to lock-in, planners and investors restrict future flexibility and increase the costs of achieving agreed climate protection goals. Here, we develop a straight-forward approach to assess the speed, strength, and scale of carbon lock-in for major energy-consuming assets in the power, buildings, industry, and transport sectors. We pilot the approach at the global level, finding that carbon lock-in is greatest, globally, for coal power plants, gas power plants, and oil-based vehicles. The approach can be readily applied at the national or regional scale, and may be of particular relevance to policymakers interested in enhancing flexibility in their jurisdictions for deeper emissions cuts in the future, and therefore in limiting the future costs associated with 'stranded assets'.
Export citation and abstract BibTeX RIS

Content from this work may be used under the terms of the Creative Commons Attribution 3.0 licence. Any further distribution of this work must maintain attribution to the author(s) and the title of the work, journal citation and DOI.
1. Introduction
Carbon lock-in is an example of the phenomenon of path dependence—'the tendency for past decisions and events to self-reinforce, thereby diminishing and possibly excluding the prospects for alternatives to emerge'[1]—recognized in economics [2] and studies of technology innovation [3–5]. Specifically, carbon lock-in refers to the dynamic whereby prior decisions relating to GHG-emitting technologies, infrastructure, practices, and their supporting networks constrain future paths, making it more challenging, even impossible, to subsequently pursue more optimal paths toward low-carbon objectives. Notably, the International Energy Agency has found that continued near-term (through 2020) investment in conventional technologies instead of low-carbon alternatives would increase investment costs four-fold in the longer term (through 2035) [6]. Others, including the Intergovernmental Panel on Climate Change [7] and academic researchers [8–10], have similarly concluded that the greater carbon lock-in, the less the chance, and higher the cost of achieving ambitious climate goals, such as keeping warming below 2° C relative to pre-industrial levels.
A prime example of carbon lock-in is coal-fired power, for which plants are costly to build, but relatively inexpensive to operate and, over time, they reinforce political, market, and social factors that make it difficult to move away from, or 'unlock' them [11, 12]. By investing in assets prone to lock-in, planners and investors restrict future flexibility and increase the costs of achieving agreed climate protection goals [7, 8]. Policymakers may understand the global risks of delay, yet still face conundrums within their jurisdictions. Shall they further invest in fossil-fuel producing and consuming technologies now, hoping these investments can be 'unlocked' later, if and when low-carbon alternatives are cheaper or political conditions more favorable? Or, shall they increase investment in low-carbon technologies now, even if near-term economic costs and political barriers appear high? Furthermore, there is relatively little understanding of which energy-consuming technologies, apart from coal power plants, most contribute to lock-in [8]. By offering an approach to assess energy technologies that pose the greatest risks of carbon lock-in, this letter provides perspectives that can assist policymakers in facing these questions. Specifically, we develop a straight-forward approach to assess the speed, strength, and scale of carbon lock-in for major energy-consuming assets in the power, buildings, industry, and transport sectors. We then pilot the approach to identify investments with substantial global lock-in risk, by using widely-cited International Energy Agency scenarios [17] to assess the lock-in implications of pursuing a high-carbon path, as opposed to shifting now to a low-carbon path. The approach can be readily applied at the national or regional scale and may be of particular relevance to policymakers interested in enhancing flexibility for deeper emissions cuts in the future, and therefore in limiting the future costs associated with 'stranded assets' [13].
2. Methods
Our approach to assessing carbon lock-in rests on, and develops methods to quantify, four central dimensions of carbon lock-in: equipment lifetime; the scale of increase in CO2 emissions; financial barriers to subsequent replacement with low-carbon alternatives; and 'techno-institutional' mechanisms that further strengthen high-carbon technologies at the expense of low-carbon alternatives. Together, we argue, these four factors, each of which builds from prior literature, illuminate the technologies where near-term investment is most likely to increase carbon lock-in.
The first of the four dimensions , technical equipment lifetime, is central to lock-in, as how long a given technology is typically operated dictates how long it may continue to emit, preventing the adoption of low-carbon alternatives [14–16]. Because opportunities to invest in lower-carbon technologies arise less often for long-lived technologies such as power plants or transport systems than they do for short-lived equipment such as lighting or many appliances, the potential for carbon lock-in increases with equipment lifetime. Data on past power plant lifetimes can be taken from global databases of power plants, estimates of vehicle stock turnover can be adapted from the vehicle industry or energy planning institutions, including the International Energy Agency. Here, we use information from the International Energy Agency, especially their Energy Technology Perspectives and World Energy Outlook publications [17, 18]. Of course, using average lifetimes offers little insight into the variability in equipment duration, much less whether future technologies, or economics, may lead to different lifetimes. In particular, were carbon pricing to be implemented, the economics of high-carbon technologies could shift dramatically, with the higher marginal costs brought on by carbon pricing leading to early retirements [11]. Because of the possibility of early retirements, average equipment lifetime alone is an insufficient indicator of lock-in [13, 16], and an additional metric, concerning the financial barrier to unlocking, is needed, and is addressed further below.
Second, several researchers have suggested that the scale of carbon lock-in relates to the cumulative CO2 committed by energy investments [8, 12]. Here, we adapt the innovation of commitment-based CO2 accounting, wherein future lifetime emissions expected to be emitted by a piece of equipment under full normal operation is assigned to the year in which the equipment becomes operational [14]. While commitment-based accounting provides a valuable indicator of overall contribution to carbon budgets of a set of new investments, it fails to highlight specifically the extent to which this level of investment, and commitment, exceeds carbon budget levels that would be consistent with a climate protection objective. To address this, and following a similar formulation of carbon lock-in as Bertram et al [8], for each technology category, we identify the investments undertaken in the near-term (e.g., over the next 15 years) under a business-as-usual scenario, and the investments that would be consistent with a low-carbon path. We then calculate the CO2 emissions commitments from the BAU scenario investments in excess of the CO2 emissions commitments from the low-carbon scenario investments, which we refer to as over-committed emissions. For example, a jurisdiction investing in two identical coal-fired power plants annually under business-as-usual but one in a low-carbon scenario would be over-committing one coal power plant's worth of CO2 (that plant's annual CO2 output multiplied by its expected lifetime) each year. Analysts applying this approach can define the low-carbon objective or pathway as they see fit, understanding that the choice of the pathway will affect which, and how much, technologies over-commit CO2.
For this analysis, we calculate over-committed CO2 attributed to different technologies as the lifetime emissions resulting from equipment installed between 2015 and 2030 in the IEA's 6DS scenario that would not have been installed in their 2DS (2 degree) scenario, plus the incremental emissions resulting from installing less efficient equipment between 2015 and 2030 in the 6DS than would have been installed in the 2DS [17]. In contrast, the term committed emissions refers to the lifetime CO2 from all investment in the BAU scenario. (For purpose of this analysis, and given lack of information, annual equipment usage, fuel carbon content, and lifetimes are assumed at BAU levels, i.e. 6DS.) We use the IEA's 6DS as a business-as-usual because, as the IEA describes, it is 'where the world is now heading, with potentially devastating results'[17] and therefore seems an appropriate baseline against which to assess carbon lock-in. The IEA's 2DS scenario is designed to be consistent with a remaining carbon budget of 1 133 Gt CO2 from 2012 onward, and so any over-committed emissions could be considered to be in excess of that carbon budget. Using a more stringent 2-degree scenario (e.g., 1 000 Gt CO2, as in IPCC [19]) would increase the estimates of over-committed CO2 here. Using a 2-degree scenario with different combinations of mitigation actions than the IEA's could also change the balance of over-committed CO2 among technologies. For further information, and an equation describing over-committed emissions, see the supplementary material.
Third, conventional technologies might be retired early or 'unlocked' in the future, especially if the full costs of an alternative, low-carbon technology were to fall below the marginal (in this case, the ongoing operating) costs of the conventional technology, accounting for all climate policies (e.g., carbon pricing) and incentives [11, 13]. For each technology, we define the financial barrier to unlocking as the breakeven carbon price needed for early retirement and replacement of a technology with its most promising low-carbon alternative, determined as the predominant substitute under the low-carbon pathway. (See the supplementary material, tables S6–S9, and accompanying text for explanation of how the predominant substitute can be determined.) The price in a given year is driven primarily by the cost of the alternative technology, which in turn will depend on how rapidly its costs decline. For this analysis, we calculate the cost of unlocking as the carbon price at which the all-in levelized cost of the low-carbon technology is equal to the marginal cost—which is mostly fuel cost-- of the existing (high carbon) technology, as is common in modeling and techno-economic analyses of energy technologies [11, 13]. Levelized costs are calculated here as a present value annuity, assuming a 10% discount rate. Capital and operating costs are drawn from the International Energy Agency's World Energy Investment Outlook [20] wherever possible (primarily for the power sector), with additional assumptions drawn from Energy Technology Perspectives, and World Energy Outlook, as above. Fuel costs are based on the BAU (6DS) scenario of Energy Technology Perspectives 2014 [17]. We assume learning rates as in World Energy Outlook and apply the learning rate for n/2 years, from 2015, where n is the technical lifetime of the technology being replaced, to estimate the cost of the low-carbon technology replacing it. For example, if the lifetime of a coal plant is 40 years, we assume 20 years of learning in wind power, the unlocking technology, and therefore assume the cost of wind power in 2035.
Fourth, system-wide 'techno-institutional' effects encompass a broad range of mechanisms linked to the economic, political and social advantages that market-dominating technologies typically enjoy [3, 21–23]. Lock-in, after all, occurs not simply due to the techno-economic characteristics of individual technologies. Rather, the technologies emerge and propagate along with hospitable institutions within a political and social context, together forming a 'techno-institutional complex' [22, 24] that is prone to lock-in. For instance, innovation systems build up tremendous stocks of capital—intellectual and material—that are geared primarily toward incremental improvement and that resist radical technological shifts[23–25]. Highly inertial policies such as subsidies can strongly tilt the economic playing field toward incumbent technologies [26, 27]. Political systems tend to be more responsive to powerful actors representing mature industries and dominant technologies than they are to smaller and less coordinated actors representing nascent industries and emerging technologies [28, 29]. And individuals tend to be inclined toward technologies with which they have become habituated through familiarity, widespread advertising, and broad consumer acceptance [30, 31].
These multiple, complex techno-institutional effects may be reflected in a number of potential indicators. Manufacturing economies of scale might be captured by the total production capacity for each technology. Innovation lock-in might be captured by the amount of R&D investment data for each technology. Political lock-in might be captured by the level of political campaign contributions or voting-age employment generation for each technology. Behavioral lock-in might be captured by the prevalence and strength of technology-specific consumer habits. While a finer-grained, local analysis of techno-institutional lock-in could employ a number of these detailed indicators, this analysis requires a simpler, globally applicable approach.
A common element of each of these techno-institutional lock-in effects is scale: the greater the scale at which a technology has been adopted, the greater the strength of the institutional systems that have co-evolved with it and support its continued use. Thus, we use here a measure of overall scale of a given technology's adoption as a simple proxy for comparing the relative strength of techno-institutional effects along a high-carbon versus low-carbon path.
For a quantitative metric of scale, we have used technology market share (with various alternative metrics of scale considered and compared in the supplementary material). Just as these effects strengthen lock-in of conventional technologies along a high-carbon path, they can also help develop and scale up alternative technologies, reinforcing a low-carbon path. Indeed, an important consequence of pursuing a high-carbon path is the foregone opportunity to strengthen the techno-institutional support for alternative technologies. Thus, we construct our fourth lock-in indicator to reflect both the expansion of market share of the conventional technology that occurs along the high-carbon path, as well as the forgone expansion of market share of the low-carbon technology. Specifically, we consider the same IEA 6DS (high-carbon) and 2DS (low-carbon) scenarios used above. As a measure of the overall relative lock-in effects for each conventional technology, we take its market share in 2030 in the high-carbon compared to the low-carbon scenario, and, conversely, for each alternative technology we take its market share in 2030 in the low-carbon relative to the high-carbon scenario. (For example, coal power reaches a market share of 44% in the high-carbon scenario compared to 23% in the low-carbon scenario, giving it a techno-institutional lock-in indicator of 1.9. Onshore wind reaches a market share of 11% in the low-carbon scenario compared to 5% in the high-carbon scenario, giving it an indicator of 2.1.) Choosing the ratio of scales along the two pathways provides a simple normalized indicator of the relative expansion (or contraction) in adoption of the technology. Analysts could use these indicators directly or use them to inform ratings, such as high, medium, and low determinations based on ranges, as we do here.
With sufficient data and scenarios, policymakers could apply these four metrics to assess lock-in within their jurisdictions. To illustrate application of this approach, here we conduct a global assessment using one widely used set of scenarios—the IEA's Energy Technology Perspectives [17].
3. Results and discussion
Figure 1 presents the results of our assessment. In figure 1, technologies are positioned according to their technical lifetimes (x-axis) and financial barrier to unlocking (y-axis). The area of each bubble is proportional to its over-committed CO2 emissions from equipment installed over the next 15 years. (figure S1 in the supplementary material shows when emissions would be released.) The bubble's shading reflects the degree of the techno-institutional lock-in, from low (light gray) to high (black), based on our assessment of changes in market share, as described above.
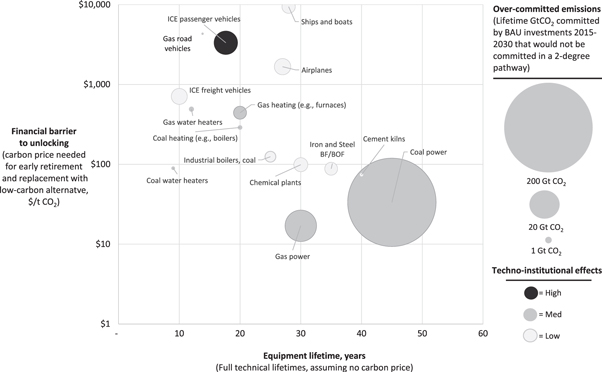
Figure 1. Global assessment of carbon lock-in risks by fuel and sector.
Download figure:
Standard image High-resolution imageThis analysis indicates that, globally, coal-fired power plants are long-lived (averaging 45 years), and large numbers are expected over the next 15 years (over-committing 200 GtCO2), creating further political and institutional entrenchment. Unlocking coal plants would, on average, require a carbon price of about USD 30 per tonne, lower than for most technologies, but still higher than carbon prices in most countries [32]. This barrier to unlocking is driven primarily by coal power's low operating costs, which present stiff competition to newly-built renewables. Accordingly, coal plants present one of the greatest lock-in risks globally, a finding consistent with other recent modeling [8].
This analysis also highlights two other technologies that lock in at least 5% of the 270 GtCO2 of over-committed CO2 in figure 1: gas power plants (25 GtCO2) and internal combustion engine (ICE) passenger vehicles (14 GtCO2).
Our analysis shows that gas power may be overbuilt in the near term, that these plants may last decades, but with a lower carbon price ($20/t CO2) required to unlock them, than for other technologies. Lock-in due to gas power is only beginning to be more widely understood. For example, recent studies have shown that, though gas plants can in the near-term reduce CO2 relative to coal, achieving ambitious climate targets may then require a swift transition away from these gas plants to renewable power [33, 34]. Rather than full retirement, for gas plants, unlocking may entail switching from base-load to less frequent, higher-value peaking or load balancing operation.
Third, and least widely recognized, is the lock-in associated with conventional ICE vehicles. This analysis shows that, despite relatively short lifetimes, overinvestment in less efficient, more carbon-intensive ICE passenger vehicles is significant—yielding 14 GtCO2 over-committed emissions due to vehicle purchases over the next 15 years, and where a carbon price of over $1,000 would be needed to retire them early. (By contrast, it would be more cost-efficient to purchase highly efficient vehicles in the first place, avoiding the capital cost of the less-efficient technology, and therefore incurring a lower overall abatement cost.). Continued investment in conventional ICE vehicles risks further entrenching these technologies at the expense of fostering alternatives, such as electric vehicles, and the systems that support them, such as recharging infrastructure.
Many climate policy efforts, and low-carbon energy analyses, focus on solutions, such as renewable power or efficient vehicles, required for a low-carbon future. Indeed, progress has been made in installing most low-carbon technologies. Yet, the global trend remains toward much higher emissions than needed to meet ambitious climate objectives. Accordingly, there is a need not only to advance low-carbon technologies, but also to slow the rate of installation of technologies that may close off, or make substantially more difficult, the attainment of these ambitious climate objectives. The framework proposed here provides a method to highlight technologies where investment is proceeding too rapidly, where lock-in is strong and long-lasting, and that further bias techno-institutional dynamics toward high-carbon pathways. This approach is timely, as policymakers have displayed interest in moratoria on high-carbon technologies (e.g. coal plants) [35], and as researchers have found that such moratoria or limits may increase the efficiency and effectiveness of climate policy [36].
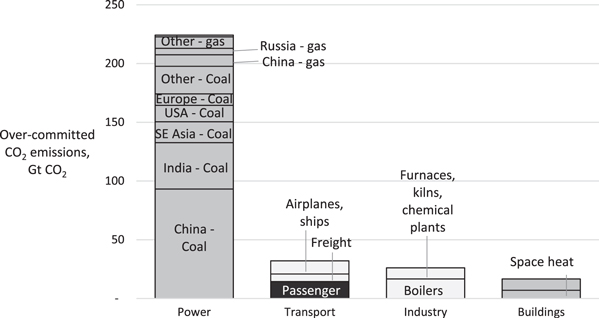
Figure 2 presents an initial assessment, also based on IEA's Energy Technology Perspectives, of the scale of over-committed emissions by technology and region. Coal-fired power investments in Asia represent the largest source of over-committed emissions, and indeed, commentators have made much of this trend, remarking in particular on China's addition of 'roughly 1 gigawatt of coal-fired power every two weeks' [37]. However, this finding does not necessarily indicate where primary responsibility lies for curbing global emissions. Analysis of new carbon lock-in, as here, inherently focuses on developing economies where infrastructure investment is ongoing, as opposed to industrially mature economies where energy needs are already met by existing infrastructure, and where mitigation opportunities tend more toward retrofitting or replacement of existing stock. For example, even building 1 GW every two weeks, it would take China more than 100 years to match current US per capita consumption levels. (See the supplementary material for calculation details.) Given these developmental disparities, global efforts to reduce carbon lock-in should bear in mind the distinction between location of mitigation potential and responsibility for providing the technical and financial resources to exploit that potential. Indeed as the IPCC noted, arrangements 'seen as equitable can lead to more effective cooperation' [1].
Figure 2. Over-committed emissions by BAU investments 2015–2030, by sector and region (shading is as in figure 1).
Download figure:
Standard image High-resolution image
Of course, the results presented here, including in both figures 1 and 2, are highly dependent on the business-as-usual and low-carbon scenarios compared. Different conceptions of business-as-usual and (especially) low-carbon pathways could produce different results, as could differences in expected fuel prices and technology costs. In particular, the extent and strength of carbon lock-in due to gas power represents one of the greatest uncertainties, as its economics are highly sensitive to fluctuations in gas prices, and its role in a low-carbon future (and therefore extent to which it over-commits emissions) is actively debated [38].
4. Conclusions and policy implications
We suggest that policymakers (and, perhaps investors) consider undertaking analyses of lock-in risk within their jurisdictions. The approach presented here can be applied at the multiple scales, using data and assumptions from a combination of in-country modeling exercises and international assessments, depending on availability and relevance. Policymakers could then focus attention on investments that rated highly in all or most indicators—say, those with lifetimes longer than a particular planning threshold (e.g., 10 years), for which the cost of unlocking is beyond reasonably foreseeable carbon prices, and which are subject to high techno-institutional effects. The results of our analysis here provide a start, but results for individual countries may vary, especially if policymakers in those countries see their own vision of low-carbon development differently than do models such as those used by the IEA.
And, of course, avoiding carbon lock-in is only one factor among many that policymakers need to consider, and on its own, is not sufficient to encourage robust development of low-carbon technologies (36). Regardless, assessing carbon lock-in provides a new perspective on decision-making, and suggests that, in addition to pursuing policies to reduce energy demand and install low-carbon power generation, policymakers could also then begin limiting investments in technologies, such as those identified here, that pose the greatest risks of carbon lock-in.
Acknowledgments
The authors would like to thank Steven Davis of University of California—Irvine, Christoph Bertram of the Potsdam Institute for Climate Impact Research, and Christina Hood of the International Energy Agency for helpful review and input. Funding was provided by GIZ on behalf of the Federal Ministry for Economic Cooperation and Development of the Federal Republic of Germany, as well as by the Swedish International Development Cooperation Agency, Sida.
Author attribution
All authors designed the analysis and conducted literature research. KT and PE conducted the detailed analysis of the four metrics here. PE, ML, and SK wrote the manuscript, while KT, PE, and SK documented the assumptions in the supplemental material.
Conflict of interest
The authors declare that they have no conflict of interest.