

Abstract
Cities are hotspots of socio-economic activities and greenhouse gas emissions. The aim of this study was to extend the research range of the urban carbon footprint (CF) to cover emissions embodied in products traded among regions and intra-city sectors. Using Xiamen City as a study case, the total urban-related emissions were evaluated, and the carbon flows among regions and intra-city sectors were tracked. Then five urban CF accountings were evaluated, including purely geographic accounting (PGA), community-wide infrastructure footprint (CIF), and consumption-based footprint (CBF) methods, as well as the newly defined production-based footprint (PBF) and purely production footprint (PPF). Research results show that the total urban-related emissions of Xiamen City in 2010 were 55.2 Mt CO2e/y, of which total carbon flow among regions or intra-city sectors accounted for 53.7 Mt CO2e/y. Within the total carbon flow, import and export respectively accounted for 59 and 65%, highlighting the importance of emissions embodied in trade. By regional trade balance, North America and Europe were the largest net carbon exported-to regions, and Mainland China and Taiwan the largest net carbon imported-from regions. Among intra-sector carbon flows, manufacturing was the largest emission-consuming sector of the total urban carbon flow, accounting for 77.4, and 98% of carbon export was through industrial products trade. By the PBF, PPF, CIF, PGA and CBF methods, the urban CFs were respectively 53.7 Mt CO2e/y, 44.8 Mt CO2e/y, 28.4 Mt CO2e/y, 23.7 Mt CO2e/y, and 19.0 Mt CO2e/y, so all of the other four CFs were higher than the CBF. All of these results indicate that urban carbon mitigation must consider the supply chain management of imported goods, the production efficiency within the city, the consumption patterns of urban consumers, and the responsibility of the ultimate consumers outside the city.
Export citation and abstract BibTeX RIS

Content from this work may be used under the terms of the Creative Commons Attribution 3.0 licence. Any further distribution of this work must maintain attribution to the author(s) and the title of the work, journal citation and DOI.
1. Introduction
The existence of climate change is unequivocal, and human influence has been the dominant cause of these changes since the 1950s [1]; substantial and sustained carbon emission reductions are recognized as one of the most pressing issues for addressing climate change. Cities are hotspots of human activity and the main drivers of greenhouse gas (GHG) emissions, giving cities a crucial role in the fight against climate change [2–4]. China accounted for one-quarter of global carbon dioxide emissions in 2011 and has contributed 80% of the world's rise in CO2 emissions since 2008 [5]. China, furthermore, is now undergoing rapid urbanization, with over half of its population living in cities in 2012, for the first time in its history. Chinese urban areas are now responsible for 75% of the national primary energy demand, and the 35 largest cities, representing 18% of the nation's population, account for 40% of its energy-related CO2 emissions [6]. There is, therefore, a crucial need for a thorough understanding of the emission sources and reduction potentials for Chinese cities.
Carbon footprint (CF) has been recognized as a valuable indicator in carbon emissions management; it provides policy makers with a mechanism for localizing the drivers of climate change [7]. CF is defined as a measure of the total carbon emissions that are directly and indirectly caused by an activity or are accumulated over the life stages of a product or living entity. It has been widely researched in products, individuals/households, organizations, regions, and countries [8–10]. As cities and their global impacts grow in importance and urgency, there has been rising interest in the urban CF.
There are three potential approaches for determining the urban CF [11]:
- The community-wide infrastructure footprint (CIF), which tracks in-boundary and trans-boundary energy use and GHG emissions associated with energy (electricity, cooking and heating fuels), transportation (road, rail, freight), water/sanitation, waste management, food and construction materials that support community-wide activities of homes, businesses, and industry located within the city.
- And consumption-based footprint (CBF) [12], which focuses on life-cycle GHG emissions within and outside the boundary, associated with providing infrastructure and non-infrastructure goods and services for consumption by a subset of the city—its final consumption sector, i.e., homes. Here, industrial and business activities that support exports are not accounted for.
- The third approach—purely geographic accounting (PGA)—accounts for only direct GHG emissions within the boundary, and usually includes the direct (also called Scope 1) component of the community infrastructure footprint.
The community-wide focus of the CIF is similar to the production-based perspective, used in national accounting, with supply chains tracked to account for the fact that the full energy supply chain often transcends the city boundary. Ramaswami et al developed the demand-centered, life-cycle-based methodology for computing the CIF for the city of Denver, Colorado [13]. Hillman and Ramaswami then applied it to eight US cities and found that the cross-boundary activities contributed 47% more, on average, than the in-boundary GHG contributions traditionally reported for cities, indicating significant truncation at city boundaries of GHG emissions associated with urban activities [14]. Chavez and Ramaswami also applied the methodology in the rapidly developing city of Delhi, India [15]. Kennedy and Steinberger et al detailed the accounting methodology and data used to determine GHG emissions, and discussed the CF of ten global cities [16, 17]. Lin used the CIF approach to access the CF of Xiamen City in 2009, and highlighted the importance of management for embodied emissions in developing cities [18]. The CIF is also called the geographic-plus infrastructure supply chain GHG footprint or trans-boundary infrastructure footprints in the above studies. Because energy used in industrial and commercial activities that can be exported is also included, Ramaswami and Chavez analyzed data from 20 US cities, and found that GHGs computed from the CIF approach need to be normalized per unit GDP to compare efficiency across cities [19].
From the consumption-based perspective, Larsen and Hertwich presented an analysis of the CF of municipal services provided by the city of Trondheim [20], and then calculated the CF of all 429 Norwegian municipalities [21, 22]. Heinonen and Junnila presented a detailed analysis of the CF of two metropolitan cities (Helsinki and Porvooin) in Finland from a consumption perspective using the hybrid life cycle assessment (LCA) model [23], and an analysis of the consumption-based CFs was performing in Finland metropolitan areas, including 11 cities [24]. Paloheimo and Salmi presented an input–output (IO) approach to assessing consumer-based GHG emissions at national and municipal levels in Finland [25]. Jones and Kammen used consumption-based life cycle accounting techniques to quantify the CFs of typical US households in 28 cities [26]. Minx used generalized multi-regional IO models for carbon footprinting of UK national and sub-national emission inventories [27]. Lenzen and Peters also used a multi-regional IO model to calculate the CF of Australia's two largest cities—Sydney and Melbourne, and created links to a spatially explicit model [28].
Most of the above urban CF accountings used the IO method or LCA analysis, and highlighted the importance of cross-boundary carbon emissions. The CIF refers to an expanded community-wide geographic inventory, which calculates direct in-boundary GHG emissions (Scope 1), plus indirect GHG emissions from electricity (Scope 2) and from other key trans-boundary infrastructures serving all sectors—residential, commercial and industrial—in the city (Scope 3) [29, 30]. However, it does not account for life cycle GHGs of other non-infrastructure goods and services consumed by urban activities because such data are often proprietary [11].
In contrast, CBF quantifies the full life-cycle GHG emissions of all goods and services (infrastructure and non-infrastructure), but only for a subset of the city, i.e., the economic final consumption sector in a city; this does not account for energy used by businesses and industry in a city that are subsequently exported. Minx et al compared the consumption-based results with extended territorial CO2 emission estimates in the UK [3]. And Chavez and Ramaswami compared mathematical derivations coupled with a case study of three US communities using three GHG emissions accounting approaches for cities: purely-geographic inventory, trans-boundary CIF and CBF [11]. The CIF and CBF provided different types of policy-relevant information: CIF is particularly relevant to future infrastructure planning for the community as a whole, while CBF can make consumers aware of the GHG emissions from their life-style and consumption choices. Trade-offs between the availability, uncertainty, and cost of gathering requisite input data versus the policy insights gained from the two approaches were recognized [12].
In spite of many studies on urban CFs, relatively little attention has been paid to tracking urban carbon emissions embodied in products traded among regions and intra-city sectors. This study, therefore, tried to analyze the CF more deeply, and focused specifically on trade relationships in the interior sector and across urban territories. An IO model was built to calculate CF for Xiamen City from both production/infrastructure and consumption perspectives. This paper is organized as follows: (1) introduction of the methodology used; (2) evaluation of total related CF by urban activities, analyzing the relationships among regions and inter-sectors, and calculating the production and consumption urban CF; (3) conclusions and policy implications.
2. Methodology
2.1. Related carbon emissions by urban activities
Because urban areas are concentrated spots with fluxes of energy, water, material and wastes into and out of the city, the purely geographic GHG accounting cannot truly represent a city's global impact, which must also consider the carbon embodied in imports and exports [31, 32]. The purely geographic GHG accounting (PGA) includes energy use, industrial processes and product use, agriculture, forestry and other land use, and waste, according to IPCC Guidelines [17], and provides a production perspective when applied to large boundaries, such as entire nations where, for example, power generation and use often occur within the boundary. For cities, essential energy and other infrastructures transcend the small city boundary. Hence, the CIF, also called the geographic-plus approach, better represents production [19]. The CIF reports direct in-boundary GHG emissions, plus indirect GHG emissions from imported electricity and steam and from critical imported materials, mainly including water, fuel, food, and cement used by the whole community/city [13, 18]. From a consumption perspective, the CBF accounting (CBF) measures the emissions associated with goods and services consumed only by the final consumers in the city (i.e., primarily households), taking account of the emissions embodied in import and export [11].
Note that neither CIF nor CBF tracks all GHG emissions. CIF does not track the GHGs embodied in non-infrastructure flows to the city (to all sectors), while CBF does not track either direct energy use or energy embodied in supply chains of industries and businesses in a city that export goods elsewhere.
Supply chains to/from Chinese cities can arise from three geographical areas: local (within the city), Mainland China (MC) and rest-of-world (RW). By geographical separation of production and consumption, a framework that captures the embodied carbon flows related to a city is presented as figure 1. The total urban-related carbon emissions can be divided into ten parts, in which LP refers to emissions of local production, LC refers to emissions of local consumption, MC refers to imported or exported emissions of MC to the City, and RW refers to imported or exported emissions of the RW to the City. From the production perspective, these can be grouped as emissions of total local production (TLP), imported from Mainland China (IMC), and imported from rest-of-world (IRW). And from the consumption perspective, they can be grouped as emissions of fuel combustion in local consumption (FC-LC), indirect local consumption (ILC), exported to Mainland China (EMC), and exported to rest-of-world (ERW). FC-LC is the direct emissions from FC-LC, such as household gas and private car fuel. And ILC refers to the indirect emissions for local consumption, such as goods and services, including electricity. Within the total urban-related carbon emissions, total carbon flow embodied among regions or intra-city sectors includes TLP, IMC, and IRW, or ILC, EMC, and ERW. The relationship between urban-related carbon emissions can be expressed as follows:
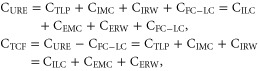
where CURE refers to urban-related carbon emissions; CTCF refers to total urban carbon flow; CTLP, CIMC, and CIRW refer to carbon emissions of TLP, IMC, and IRW, respectively; while CFC-LC, CILC, CEMC, and CERW refer to carbon emissions of direct emissions from FC-LC, ILC, EMC, and ERW, respectively.
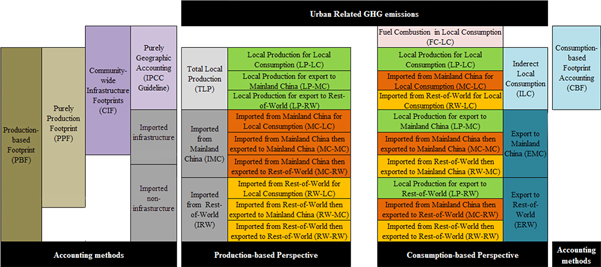
Figure 1. The various components and inter-relationships of urban-related carbon emissions.
Download figure:
Standard image High-resolution imageAccording to accepted accounting methods, the PGA includes TLP and direct emissions from FC-LC, while CIF contains TLP, direct emissions from FC-LC and the imported key materials/infrastructure (IKM) within IMC and IRW. The two-part direct emissions from FC-LC and ILC compose the total local consumption (TLC), also called CBF. In addition to current accounting methods, a production-based footprint (PBF) is proposed from a production perspective, including TLP, IMC and IRW. Furthermore, a purely production footprint (PPF) can be also established to specifically measure production emissions and their related supply chains. PPF include only TLP and production-related supply chains (PSC) within IMC and IRW, excluding final consumption within IMC and IRW. The two new production-based CFs can provide special emission information, benefiting industrial interventions like symbiosis. Hence these accounting methods can be expressed as follows:
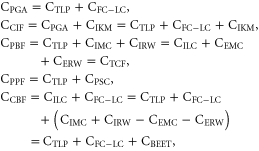
where, CPGA, CCIF, CPBF, CPPF, and CCBF refer to urban carbon emissions by PGA, CIF, PBF, PPF, and CBF methods, respectively; CIKM refers to embodied carbon emissions from IKM (i.e., water, cement and food, etc); CPSC refers to emissions from the supply chain to support local production; and CBEET presents the net balance of emissions embodied in trade (BEET) by both import and export.
2.2. IO analysis for urban carbon flow
The IO model is a widely used method for calculating the embodied environmental impact of trade, and includes the competitive IO model and the non-competitive IO model. The competitive IO model does not distinguish between local and imported intermediate input, and cannot reflect the relationship between imported goods and local industry. To analyze the domestic and imported impacts separately, the competitive IO model must be converted to a non-competitive one. In this study, import coefficient matrices were developed to estimate the imported intermediate input from MC and RW, while the non-competitive IO model was constructed to analyze the local relationship. For the imported goods and services from MC and RW, IO tables were used to estimate the carbon intensities of each region, and the local production CF was accounted using a local non-competitive IO table. More details on the analysis of the total urban carbon flow are as follows.
In an open economy, the production of region r, for example, needs both domestic and imported input. In order to discriminate between locally produced and imported intermediate input, the technical coefficient matrix should be divided into two parts [33]:

where Arr and Asr represent the normalized industrial requirements of locally produced products and the imported products from region s to region r, respectively, and n indicates the quantity of the importing regions (similarly hereinafter). The production of region r provides both local consumption and exports to region s, so the total local output can be written as
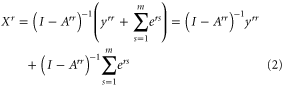
The consumption of region r may be locally produced (the former part, i.e. (I − A)−1yrr, in equation (2)) or from imports (ysr), and ysr can be obtained by splitting the bilateral trade data into intermediate and final consumption

By substituting the deconstructed Xr (equation (2)) into equation (3), the imports for region r can be expressed as
where the former part yields the total imported consumption for region r, and the latter part represents the re-exported products and services after processing.
In adding the environmental impact to extend the model [34], a diagonal matrix F, which represents the regional carbon intensities, should be applied. The basic function of the EIO model is written as:

where C represents the CF caused by final consumption y. The CFs attributable to TLP, export and import can then be calculated. According to the relationship described in 2.1, the CFs of TLP, IMC, IRW, TLC, EMC, ERW and net BEET can be easily obtained.
3. Study case
3.1. Study area
Xiamen is a major city on the Southeast (Taiwan Strait) coast of the People's Republic of China, and lies in Fujian Province. It covers an area of 1573 km2 with a total population of 3.53 million in 2010 [35]. With rapid economic development, Xiamen's regional GDP reached 206.007 billion yuan in 2010, and its ratio of the three industrial structures was 1.1:49.7:49.2. The rapid economic growth and urbanization have resulted in rising energy consumption in Xiamen City, and its total energy consumption reached 10.7696 million tce (tons of coal equivalents) in 2010, whose energy consumption intensity was 0.569 tce/104 yuan. In August 2010, Xiamen was identified as a low-carbon pilot city as part of the NDRC's low-carbon pilot project.
3.2. Data used
The data used in this study include three types: (a) the IO tables of Xiamen City, Fujian Province, China and other major trading partner countries; (b) GHG emissions from Xiamen City, Fujian Province, China and other main trading partner countries by sector; (c) domestic and international trade relationships of Xiamen City with outside regions.
For the IO data, the IO table of Xiamen City for 2007 was updated to the year 2010 using the bi-proportional scaling method [36, 37], because the local IO data for 2010 is still unavailable. The IO tables for Fujian province and China were obtained from the Fujian Statistical Bureau and National Statistical Bureau, respectively. Data for the major importing nations, including Japan, India, Germany, Australia, USA, Brazil and the Taiwan province of China, were obtained from the World Input–Output Database (WIOD). The industries of all these tables were merged into 25 aggregated industries, according to the International Standard Industrial Classification [38], in order to make a systematic comparison; the data are shown in table 1.
Table 1. Aggregated industrial classifications of major countries and regions.
| Num | Industry | Sub-industry | Abbreviation |
|---|---|---|---|
| 1 | Agriculture | Agriculture, forestry and fishing | Agriculture |
| 2 | Mining and quarrying | Mining | |
| 3 | Manufacture of food, beverages and tobacco products | Food | |
| 4 | Manufacture of textiles | Textiles | |
| 5 | Wearing apparel, leather and related products | Clothing | |
| 6 | Manufacture of wood and of products of wood and cork, except furniture; articles of straw and plaiting materials | Wood | |
| 7 | Manufacture of furniture | Furniture | |
| 8 | Manufacture of paper and paper products | Paper | |
| 9 | Printing and reproduction of recorded media | Media | |
| 10 | Manufacture of coke and refined petroleum products | Coke and Oil | |
| 11 | Manufacture of chemicals and chemical products, pharmaceuticals, medicinal chemicals and botanical products | Chemicals | |
| 12 | Manufacturing | Manufacture of rubber and plastic products | Rubber andPlastics |
| 13 | Manufacture of other non-metallic mineral products | Non-metals | |
| 14 | Manufacture of basic metals | Basic metals | |
| 15 | Manufacture of fabricated metal products, except machinery and equipment | Fabri-metals | |
| 16 | Manufacture of machinery and equipment n.e.c. | Machinery | |
| 17 | Manufacture of motor vehicles, trailers and semi-trailers, and other transport equipment | Transport vehicles | |
| 18 | Manufacture of electrical equipment | Electrical | |
| 19 | Manufacture of computer, electronic and optical products | Electronics | |
| 20 | Other manufacturing, repair and installation of machinery and equipment | Other Manufacturing | |
| 21 | Utilities | Electricity, gas, steam and air conditioning supply; water supply; sewerage, waste management and remediation activities | Utilities |
| 22 | Construction | Construction | Construction |
| 23 | Transportation | Transportation and storage | Transportation |
| 24 | Wholesale and retail trade; repair of motor vehicles and motorcycles; accommodation and food service activities | Wholesale | |
| 25 | Other Services | Information and communication and all remaining services | IC services |
And for GHG emission data, those of Xiamen City, Fujian Province, and China were calculated from the IPCC's emission factors, and from activity data from municipal, provincial, and national statistical yearbooks of 2011, which provides sectoral details. The GHG emissions from the Taiwan province of China, USA, Japan, Australia, India, Germany and Brazil were obtained from the WIOD. The emission intensity of each region then can be gained from dividing GHG emission by corresponding total output of each sector from IO table. Trading relationship data were from the Statistical Yearbook of Xiamen Special Economic Zone (2011). According to trade proportion, the trading countries or regions (more than 60) were grouped into nine regions: East Asia; Western, Southern and Southeast Asia; Europe; Australia; North America; Central and South America; Africa; MC and the Taiwan province of China. These areas were respectively presented by eight major trading countries or continents: Japan, India, Germany, Australia, USA, Brazil, MC and the Taiwan province of China, as shown in table 2. For example, East Asia accounts for 9.41 and 8.20% of the total imports and exports, respectively, of Xiamen City, and Japan accounts for 57 and 66% of imported and exported trade, respectively, of East Asia.
Table 2. International trading relationships for Xiamen City.
| Trading region | Delegate country or regions | ||||
|---|---|---|---|---|---|
| Name | Import rate | Export rate | Name | Import rate | Export rate |
| East Asia | 9.41% | 8.20% | Japan | 57% | 66% |
| Western, Southern and Southeast Asia | 8.54% | 16.71% | India | 28% | 10% |
| Europe | 5.39% | 14.70% | Germany | 28% | 25% |
| Oceania | 1.76% | 1.17% | Australia | 89% | 90% |
| North America | 6.05% | 15.32% | USA | 91% | 93% |
| Central and South America | 2.96% | 4.95% | Brazil | 20% | 44% |
| Africa | 0.65% | 2.28% | None | N/A | N/A |
| Mainland China | 51.57% | 34.58% | MC | 100% | 100% |
| Taiwan | 13.67% | 2.08% | Taiwan | 100% | 100% |
3.3. Calculation process
Before using IO analysis (as described in section 2.2) to calculate the CF of Xiamen City, two additional parameters needed to be determined: the relationships with outside trading partners, and an estimation of the imported-from regions' emission factors by sector. In this study, only two trading partners were considered for Xiamen City: MC and the RW, because the IO table for Xiamen City listed only these two partners' column vectors quantifying the trade relationships (both exports and imports) by industry, although more detailed trading relationship data for the RW can be obtained from the Statistical Yearbook of Xiamen Special Economic Zone (2011). For the emission factors of MC, we used the mean coefficients of China and Fujian province, to eliminate the regional diversity attributable to the large differences of carbon intensities and production technologies throughout China. For the emission factors of the RW, we picked the largest trading country from each of the eight trading regions, to represent the region's mean emission standard, because of the ready availability of GHG emissions data by sector for these countries. The exporting emissions, however, were estimated according to the export ratios shown in table 2.
3.4. Uncertainty analysis
There were some uncertainties in the CF accounting process, mainly including data sources, parameter selection and data preprocessing. Firstly, major uncertainties came from the imperfections of existing energy statistics and other related activity statistics in Xiamen City, Fujian Province, and China, such as transportation fuel statistics, solid waste and wastewater data. Secondly, uncertainties were also caused by carbon emission factor selection. For example, IPCC's emission factors were adapted in all the GHG emissions we calculated, which does not fully reflect the real local conditions in different locations. Thirdly, data preprocessing might cause some uncertainties, especially in converting IO table of Xiamen city to a non-competitive one and merging the sectors of all the IO tables into 25 sectors. To improve the result's accuracy, the key lies to improve the accuracy of statistical activity data and local emission factors in the future.
4. Results
4.1. Total urban-related emissions
The urban-related carbon emissions for Xiamen City in 2010 were calculated and the total urban carbon flows further analyzed using the IO model. The total urban-related emissions were 55.2 Mt CO2e/y, of which FC-LC contributed 1.5 Mt CO2e/y, and emissions from the total carbon flow (including TLP, IMC, IRW, or ILC, EMC, and ERW) came to 53.7 Mt  these components are shown in figures 2(a) and (b). From the production perspective, the GHG emissions from TLP accounted for 42% (22.2 Mt CO2e/y), of which only 15% was for local consumption (LP-LC) and the remaining 27% was for exports to MC and RW. GHG emissions for IMC accounted for 34% (18.3 Mt CO2e/y), of which only 12% was for local consumption and 22% was then exported the outsides. And emissions for IRW accounted for 24% (13.2 Mt CO2e/y), of which only 8% was consumed locally and the remaining 16% was exported. Therefore, the imported emissions from MC and RW aggregated to 31.5 Mt CO2e/y, accounting for 59%.
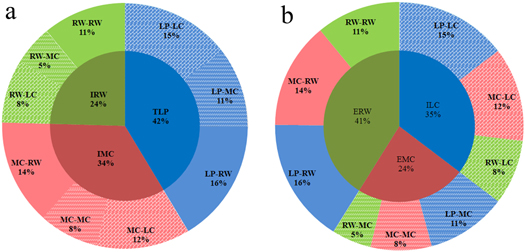
Figure 2. Structure of urban carbon flow by regions. Note: (a). From production perspective; (b). From consumption perspective.
Download figure:
Standard image High-resolution imageFrom the consumption perspective, emissions from ILC accumulated to 19.0 Mt CO2e/y, accounting for 35% of the total related GHG emissions. Emissions for EMC contributed 24% (12.7 Mt CO2e/y), of which 11, 8 and 5% were from local production (LP), MC and RW respectively. And emissions for ERW accounted for 41% (22.1 Mt CO2e/y), of which 16, 14 and 11% were from LP, MC and RW respectively. Considering the trade balance, Xiamen City and MC were net carbon export regions, with exports of 3.2 Mt CO2e/y and 5.6 Mt CO2e/y embodied emissions, respectively, then RW imports came to 8.8 Mt CO2e/y.
According to the international trading relationships (shown in table 2), the GHG emissions embodied between Xiamen City and the major trading regions can be further expressed as figure 3. Besides MC, the top four largest carbon trade regions include North America, Europe, Taiwan, and Western, Southern and Southeast Asia. North America and Europe were net carbon import regions, which respectively imported 4.0 Mt CO2e/y and 4.2 Mt CO2e/y, together accounting for 92% of the net exports to RW. However, Taiwan was the largest net carbon-export region, exporting 4.3 Mt CO2e/y. Western, Southern and Southeast Asia was a small net carbon-import region, as were Oceania, Central and South America, and Africa. Therefore, Xiamen City shows the highest import dependence on MC and Taiwan, and the highest export dependence on the United States and Europe—a common pattern for the coastal China special economic zones.
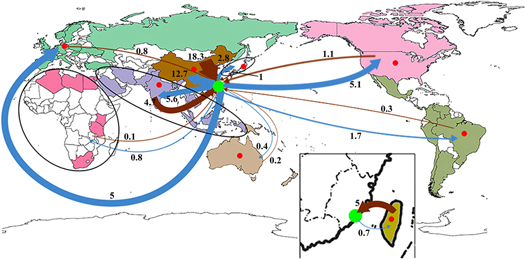
Figure 3. Embodied emissions for Xiamen City by trade relationships (Mt CO2e/y). Note: (1). Red points represent the delegate countries or regions; green point is Xiamen City; (2). Blue arrows are for export flows and brown for import flows.
Download figure:
Standard image High-resolution image4.2. Urban carbon flow by sectors
Considering the GHG intermediate input relationships among urban sectors, the major carbon flows among sectors are illustrated as figures 4, 5 and 6. Figure 4 shows the total urban inter-sector carbon flows, while figures 5 and 6 respectively show the carbon flow from production and consumption perspectives. Figure 4 shows that the largest inter-sector flow was the carbon embodied in the intermediate input from Manufacturing to Manufacturing, followed by that from Utilities to Manufacturing. The above two flows accounted for 72.4% of total production-based emissions (53.7 Mt CO2e/y), and all of the flows to Manufacturing together accounted for 81.9%, making Manufacturing the largest emission-consuming sector. Manufacturing, Utilities and Transportation were also the three largest emission-producing sectors, respectively accounting for 49.4, 33.7 and 9.8%. The intermediate input of Utilities and Transportation mostly flowed into other sectors. However, the flows among other industries were much smaller than those of these 'Top 3'.
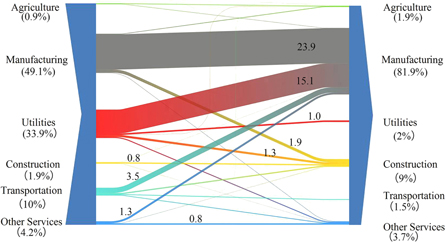
Figure 4. Total urban inter-sector carbon flow (Mt CO2e/y).
Download figure:
Standard image High-resolution image
Figure 5. Inter-sector carbon flow from production perspective (Mt CO2e/y). Note: (a). carbon flow from total local production (TLP); (b). Carbon flow from total import (Mainland China (MC) and rest-of-World (RW)).
Download figure:
Standard image High-resolution image
Figure 6. Inter-sector carbon flows from consumption perspective (Mt CO2e/y). Note: (a). Carbon flow for indirect local consumption (ILC); (b). Carbon flow for total export (Mainland China (MC) and rest-of-world (RW)).
Download figure:
Standard image High-resolution imageFrom the production perspective, figure 5(a) shows the destinations of carbon emissions embodied in local production, which aggregated to 22.2 Mt CO2e/y, while figure 5(b) shows the destinations of both MC- and RW-import-embodied emissions, which totaled 31.5 Mt CO2e/y. These illustrate the same flow trends as figure 4, but the imported flows transferred more to Manufacturing than local production flows did. From the consumption perspective, figure 6(a) shows where the embodied emissions of local consumption come from; these amounted to 19.0 Mt CO2e/y. Figure 6(b) shows the sources of both MC and RW export, which totaled 34.7 Mt CO2e/y. In figure 6(a), Manufacturing and Utilities were the large emission-producing sectors, and Manufacturing and Construction were the large emission-consuming sectors (accounting for 52.5 and 25.6% respectively). Figure 6(b) shows that most carbon export trades were through industrial products, which took 98% of total carbon exports.
4.3. Comparison of different accounting approaches
According to the accounting method discussed in section 2.1, the PGA, CIF and CBF, as well as the newly defined production-based (PBF) and PPF, were applied to evaluate the urban CF of Xiamen City in 2010, and the results are illustrated in table 3. The carbon emissions by PGA were 23.7 Mt CO2e/y according IPCC guidelines, while CIF yielded 29.7 Mt CO2e/y by adding net imports of the infrastructure services of energy, water, food, steel and cement. The CF of local consumption (CBF) was only 20.5 Mt CO2e/y, so 3.2 Mt CO2e/y was net-exported to outside areas compared with the PGA. Both PGA and CIF were 25.2 and 39.2% higher than the CBF, respectively. Furthermore, the newly defined PBF and PPF were 53.7 Mt CO2e/y and 44.8 Mt CO2e/y respectively, which were all much larger than PGA, CIF and CBF. The total upstream supply chain emissions were even larger than the PGA, CIF and CBF. These features indicate a high net production city [11], as has been shown to be the case for Xiamen.
Table 3. Urban carbon emissions of Xiamen City by different accounting methods.
| Items | Values (Mt CO2e) |
|---|---|
| Production-based footprint (PBF) | 53.7 |
| Purely production footprint (PPF) | 44.8 |
| Community-wide infrastructure footprint (CIF) | 29.7 |
| Purely geographic accounting (PGA) | 23.7 |
| Consumption-based footprint (CBF) | 20.5 |
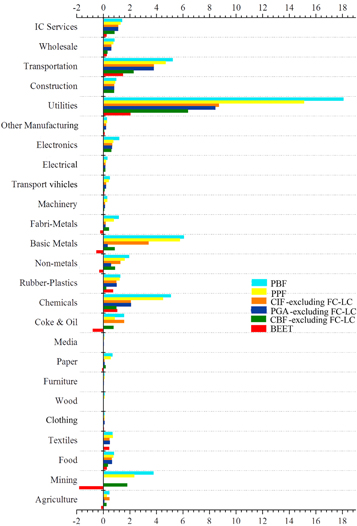
Figure 7 further illustrates sectoral details of the five urban CF accountings, including PBF, PPF, CIF, CBF and PGA, as well as the net BEET by import and export. Utilities, Transportation, Basic Metals and Chemicals had larger CFs than other sectors, by most of the accounting methods. And for most sectors, PBF values are larger than PPF ones, followed by those of either CIF, PGA or CBF. Hence, according to the trading balance by sector, Utilities, Transportation and Chemicals were the three highest net carbon exporters, while Mining, Coke and Oil, and Basic Metals were the three top net carbon importers.
Figure 7. Xiamen's carbon footprint and emissions embodied in trade by sector (Mt CO2e/y).
Download figure:
Standard image High-resolution image
5. Conclusions and discussions
In this study, all the urban-related carbon emissions of Xiamen City in 2010 were evaluated—not only the infrastructure and consumption emissions but also the import- and export-embodied emissions from trade. The import and export carbon flows among regions were tracked by domestic and international trade, while carbon flows among urban sectors were tracked using the urban IO table. Five urban CF accountings were then applied to evaluate the urban CF, including PGA, CIF, PBF, PPF, and CBF. Our research extended the range of policy and research applications considerably to cover sector, region and product analysis. Main research results are as follows:
- (1) The total urban-related emissions of Xiamen City in 2010 were 55.2 Mt CO2e/y, in which total carbon flow among regions or intra-city sectors accounted for 53.7 Mt CO2e/y. Within the total carbon flow, import and export respectively accounted for 59 and 65%, which highlighted the active trade relations of Xiamen City and the importance of emissions embodied in trade. Furthermore, 74% of import emissions were from China (both MC and Taiwan), while 64% of export emissions were transferred to other countries besides China. By trade balance, North America and Europe were the largest net carbon exported-to regions, and MC and Taiwan the largest net carbon imported-from regions. These show the high import dependence on MC and Taiwan, and high export dependence on the United States and Europe.
- (2) Tracking urban carbon flows from production to consumption by sectors indicated that Manufacturing was the largest emission-consuming sector, accounting for 81.9% of the total urban carbon flow. And the two largest carbon flows lay in Manufacturing and Utilities to Manufacturing, accounting for 79.2% of all flows to Manufacturing. From the production perspective, the import flows transferred more carbon to Manufacturing than local production flows did. And from the consumption perspective, Construction, in addition to Manufacturing, was a prominent consuming sector for local consumption flows, while 98% of carbon export was through industrial product trades in export flows.
- (3) Among the five accounting methods, the consumption-based one (CBF) was lower than all of the other four CFs for Xiamen City in 2010, consistent with its being a net carbon-producer city [11]. The most commonly used PGA method totaled 23.7 Mt CO2e/y. The CF of IKM yielded 6.0 Mt CO2e/y, showing the environmental impact of the infrastructure supply chain. The value of CBF accounting was 20.5 Mt CO2e/y, indicating that the per capita CF of Xiamen City in 2010 was 6.4 t CO2e/person. The PBF and PPF methods respectively totaled 53.7 Mt CO2e/y and 44.8 Mt CO2e/y.
Xiamen City, as an active trading city, had more trade-related embodied emissions than either production or consumption carbon. Different calculating methods generate different outcomes and provide different values or policy implications. PGA helps to evaluate the production efficiency within the city and the household consumption pattern of the city dwellers, which could provide information about air quality and the heat island effect of the urban area that affect public health; CIF concentrate on CF of imported key materials, helping to select the cleaner products such as cement and energy that is urgently needed, and make carbon reduction plans for infrastructure supply chain management. CBF reports the per capita metrics and enables comparisons among cities, and provides grounding for ethical arguments of mitigation responsibility. PPF concerns imported products and services used for local production, while PBF concerns all the imported carbon including import for production and import for consumption. The PPF and PBF accounting method would benefit the interventions of industrial symbiosis and optimization of future planning for the entire supply chain.
Further research showed that Xiamen was a net carbon exporter, importing energy and raw materials mostly from China and then exporting industrial products to western countries. Hence from a broader view, urban carbon mitigation must consider the supply chain management of imported goods, the production efficiency within the city, the consumption patterns of urban consumers, and the responsibility of the ultimate consumers outside city. The production-based accounting can inform the producers to seek mitigation measures, while consumption-based accounting might demonstrate more reasonable regional inequity of carbon emissions for an active trading city and promote low carbon lifestyles. However, there are some uncertainties in the calculating parameters and the data preprocessing, such as the IPCC's emission factors, converting IO table of Xiamen city to a non-competitive one and merging the sectors of all the IO tables. These can be further studied in future.
Acknowledgments
This study was supported by the National Natural Science Foundation of China (71003090 and 71273252), and the National Key Technology R&D Program of the Ministry of Science and Technology (2012BAC21B03). In addition, collaboration between Chinese and US research teams was made possible by a grant from the US National Science Foundation PIRE Program.