


Abstract
Carsharing exemplifies a growing trend towards service provision displacing ownership of capital goods. We developed a model to quantify the impact of carsharing on greenhouse gas (GHG) emissions. The study took into account different types of households and their trip characteristics. The analysis considers five factors by which carsharing can impact GHG emissions: transportation mode change, fleet vintage, vehicle optimization, more efficient drive trains within each vehicle type, and trip aggregation. Access to carsharing has already been shown to lead some users to relinquish ownership of their personal vehicle. We find that even without a reduction in vehicle-kilometers traveled the change in characteristics of the vehicles used in carsharing fleets can reduce GHGs by more than 30%. Shifting some trips to public transit provides a further 10%–20% reduction in GHGs.
Export citation and abstract BibTeX RIS

Content from this work may be used under the terms of the Creative Commons Attribution 3.0 licence. Any further distribution of this work must maintain attribution to the author(s) and the title of the work, journal citation and DOI.
1. Introduction
Carsharing1 is growing in popularity [1, 2]. This paper intends to analyze the impacts of this transportation service on greenhouse gas (GHG) emissions. The novelty of approach in this study is the attention paid to the factors and contexts through which carsharing impacts are realized.
The concept of sharing vehicles among multiple users has been practiced for more than three decades [3]; it was invented to provide more affordable access to personal mobility [4]. The popularity of such services has been accelerated by smartphones as platforms for software that facilitates the necessary transaction elements such as: vehicle location, booking and payment for service [5]. Many carsharing platforms allow users the choice of vehicle type as well as pick up locations. Some carsharing services even provide one-way carsharing allowing users not to worry about returning the vehicle to the pickup location or being responsible for pay-parking at their destination. A closer examination of the environmental impact of such convenient personal mobility services is the focus of this paper.
Several studies have already examined carsharing services as a GHG mitigation measure. Martin and Shaheen [6] and Transportation Ecology and Mobility Foundation [7] surveyed members of multiple carsharing services and calculated emission reduction resulted from carsharing participation. Firnkorn and Müller [8], and Cervero and Tsai [9] focused on one specific carsharing organization each. While Firnkorn and Müller [8] surveyed residents who were interested in carsharing, Cervero and Tsai [9] conducted multiple surveys throughout four years to analyze the dynamic changes in user behavior by carsharing.
The focus of these earlier papers has been on how car sharing leads to a reduction in vehicle-kilometers traveled (VKT) and hence GHG emissions. However, Lane [10] and Katzev [11] reported issues in VKT reporting; the responses they got were highly likely inaccurate because few drivers actually knew their VKT.
In this paper, we model the impact of carsharing on GHG emissions through five independent factors beyond VKT reductions. The data used for the model is derived from a travel diary survey in which travel distances were calculated based on trip start and end locations. We use the survey data on trip distances and characteristics of families who are not carsharing members to construct three clusters of household archetypes. We suspect that household characteristics determine flexibility in utilizing carsharing. Our scenario-based approach is designed to assess emission reductions as different household types join carsharing programs.
In this modeling study we consider three factors involving behavioral change:
- Mode shifting—higher use of other modes of mobility (public transit, biking and walking);
- Right sizing—selecting the appropriate vehicle for the task at hand; and,
- Trip planning—aggregation of a number of shorter trips into longer trips.
And two factors arising from fleet composition:
- Newer cars—carsharing fleets are, on average, much newer than owned vehicles. This leads them to benefit from secular improvements in vehicle efficiency;
- Less macho—carsharing fleets, on average, include the more efficient drivetrains offered for each vehicle type in their fleet.
We quantify the effects of each factor and propose future steps to utilize carsharing as a GHG emission mitigation measure.
In section 2 we describe the scope of and data used in this study. In section 3 we explain the scenarios and their rationale. In section 4 a piecewise-linear emission calculator is introduced to explore the impact of trip aggregation on engine temperature and fuel efficiency. In section 5 we present results and discuss their implications. In section 6 we explore the sensitivity of our results to modeling assumptions. We conclude with a summary of findings in section 7.
2. Scope and data
Since vehicle production only accounts for about 10% of the emissions in the lifecycle of a vehicle [12], and the majority of the vehicle exhaust gases consists of CO2 [13], we focus on CO2 emissions due to vehicle operations. Vehicle operations are dependent on household demands for mobility services. Thus, our methodology hinges on patterns of demand for mobility as revealed in detailed travel diary surveys. For this study, we utilized data gathered by Metro Vancouver, the regional authority for the Vancouver region, representing over 21 850 valid surveys from local households reporting their previous day's weekday trips [14].
We rely on data from Transport Canada [15] for vehicle composition and fuel efficiency. Unfortunately, fuel efficiencies of the current fleet are only available at the aggregate national level, so our data is not specific to Metro Vancouver. We also used fleet composition and vintage from Modo, a local car cooperative, and vehicle fuel economy statistics [16] that use the more realistic fuel performance methodology introduced in 2015 [17, 18].
The availability of data on household travel patterns, and characteristics of the fleets of user-owned vehicles and those operated by carsharing services were the reasons for choosing the Metro Vancouver region. We suspect our findings are replicable wherever the characteristic differences between user-owned and carsharing fleets are present.
3. Scenario development
For the purpose of this study, we propose three household archetypes: (1) households with children and at least one person working away from home (hereafter referred to as household with children), (2) households without children and at least one person working away from home (referred to as household without children), and (3) households with neither children nor work away from home (referred to as retiree household). The three households were chosen by following the classification used in the Trip Diary Survey administered for Metro Vancouver, Canada [14].
Trip distances and purposes by household archetypes are presented in figure 1. Mode shares are presented in figure 2. These closely resemble2 data found in Metro Vancouver's Trip Diary survey for families not utilizing car sharing services [14, 19]. Our working assumptions are that (1) these households have travel patterns and modes which are no different from that of general public prior to carsharing participation, and (2) these households own a single vehicle before participating in carsharing services3 , and once they become carsharing members, they use only cars offered by carsharing services.
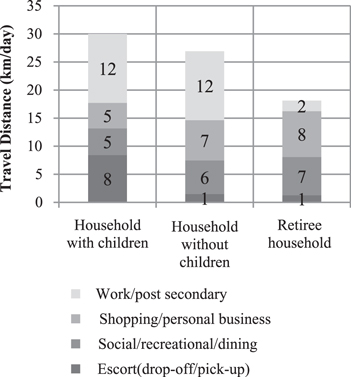
Figure 1. Average weekday travel distance by trip purpose (baseline).
Download figure:
Standard image High-resolution image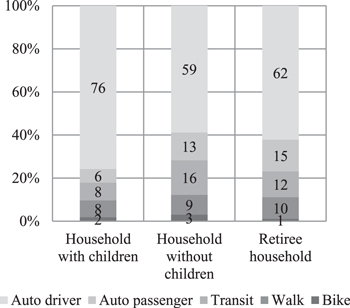
Figure 2. Mode of transportation by distance (baseline).
Download figure:
Standard image High-resolution imageThe working assumption that households switching to carsharing are representative of the general public is an over-simplification that we revisit in the sensitivity analysis. The second simplifying assumption can be scaled to reflect actual patterns of access to carsharing on car ownership and trip characteristics. For example, 80% of people who join Modo4 sold or donated their cars [22]. More recently, Metro Vancouver's carsharing survey [23] revealed that 28% of households who gained access to carsharing relinquished their privately owned vehicle, and 70% of them became zero vehicle households, meaning that access to carsharing fully substituted private car ownership [24].
3.1. Newer vehicle factor
Modo owns 340 vehicles [23], and the average age of their fleet is three years [25]. On the other hand, the average age of privately owned vehicles in British Columbia is 11 years5 [26]. Given the secular trend to higher fuel efficiency [13], this gap in vehicle vintage plays a significant positive role in reducing the GHG emissions from households who use a carsharing vehicle instead of their own. This newer vehicle effect is present whenever carsharing is used. Thus the other factors impacting GHG such as vehicle optimization and trip planning are additional to the shift in baseline emission that result from the higher efficiency of carsharing fleets.
3.2. Transportation mode change factor
Greater use of public transit, walking and biking has often been singled out as the main benefit from implementing carsharing services [27–30]. The magnitude of this effect varies depending on user demographics, geographic conditions, and public transit service characteristics [6]. In this study, we assumed that carsharing participation and the absence of vehicle ownership leads to changes in mode of transport chosen, depending on the nature and distance of trip in question. However, we are not aware of any systematic study of how transportation mode is changed by participation in carsharing. For the purposes of this study, we relied on informal interviews with carsharing households, data on travel patterns from the Trip Diary, and other carsharing reports [6, 7, 29, 31] to develop the trip pattern scenarios. The scenario assumptions for post carsharing participation are: trips of 1 km or less will be completed by walking; walking and biking will be used twice as frequently as before to complete trips of 1–5 km; and, regardless of distance, use of public transit is doubled6 . In addition, since carsharing is mainly used for shopping and social trips [10, 24, 32, 33, 36, 37], commuting is also assumed to be completed using public transit alone.
3.3. Vehicle optimization factor
In this study, we reflected vehicle optimization as an aspect of how households would meet their transport needs after switching away from car ownership. In general, car owners purchase vehicles that are too powerful and too large for their daily needs. Vehicle optimization means using a vehicle of sufficient in size and performance to complete a trip with a specific purpose. For example, trips that do not involve large loads can be completed in a sub-compact vehicle, while trips involving large loads would be completed using a light duty truck (LDT).
A comparison of the privately owned and carsharing fleets (see table 2) revealed the latter to have far fewer sport utility vehicles (SUV) and LDT. The odometer readings from the carsharing fleets showed that the various cars had roughly equivalent use. This gives us the justification to assert that members of carsharing services choose the vehicle they use to match their need for that specific trip. In addition, the most prevalent vehicles in the carsharing fleets of Vancouver are 700 car2go's Smart ForTwo 2-seater sub-compacts [31].
3.4. Trip aggregation factor
Despite the lower barriers for securing carsharing services today, vehicle availability where and when needed is still inferior to privately owned vehicles. We hypothesize that limited temporal and spatial availability cuts down on ad hoc trips and encourages 'trip planning' by users. Trip planning is assumed to involve aggregation of shorter trips into fewer longer trips. This has two effects: (a) shorter distance (SD)—by combining many trips, the return legs of some trip could be avoided, leading to fewer km traveled7 , (b) warm start (WS)—if many trips are combined into sequential short stopover trips, the engine will remain warm. Engines have significantly higher fuel consumption (and emissions) below their operating temperature (cold starts) [32]. In this study, we assumed that households might decide to aggregate half of the trips shorter than 5 km.
A summary of key assumptions about shifts in household trip patterns used in this study is presented in table 1.
Table 1. Summary of scenario assumptions when relying on carsharing.
| Household with children | Household without children | Retiree household | ||
|---|---|---|---|---|
| Mode change | Trips of Less than 1 km | The share of walking in travel distance increases from 31% to 100%. | The share of walking in travel distance increases from 23% to 100%. | The share of walking in travel distance increases from 25% to 100%. |
| Trips of Less than 5 km | The shares of walking, biking, and transit in travel distance increase from 9%, 3%, and 6% to 19%, 6%, and 20%, respectively. | The shares of walking, biking, and transit in travel distance increase from 16%, 5%, and 14% to 32%, 11%, and 30%, respectively. | The shares of walking, biking, and transit in travel distance increase from 18%, 2%, and 5% to 36%, 3%, and 11%, respectively. | |
| Trips of more than 5 km | The share of transit in travel distance increases from 12% to 57%. | The share of transit in travel distance increases from 19% to 65%. | The share of transit in travel distance increases from 20% to 47%. | |
| Vehicle optimization | Commuting | Sub-compact | Sub-compact | Sub-compact |
| Escorting | Compact car | Sub-compact | Sub-compact | |
| Short recreational trips | Compact car | Compact car | Compact car | |
| Long recreational trips | Station wagon | SUV | Mid-size | |
| Other | Sub-compact | Sub-compact | Sub-compact | |
| Trip aggregation | Shorter distance | The half of trips with less than 5 km travel distance is aggregated and overall trip distance is reduced by 30%. | ||
| Warm start | The half of trips with less than 5 km travel distance is aggregated while traveling the same distances. | |||
| Newer vehicles | Newer vehicles are used in all auto-driving trips. The vehicle efficiency is based on the carsharing companies' fleets. | |||
4. Emission calculator
The annual CO2 emissions for each archetypal household prior to enrollment in carsharing participation (pre-carsharing) were calculated using energy efficiency data by vehicle class [33], emission factors [16], and the emission data of the public transportation system operating in our case-study region [34]. Since fuel efficiency of a vehicle is dependent of engine temperature [32], and about 30% reduction in fuel consumption can be achieved by warming up engines [32], we assumed a piece-wise linear efficiency model where fuel efficiency rises as the engine comes into its intended operating temperature. Thus, the fuel efficiency rises from a cold start to the optimal based on cold-start and overall fuel efficiency values reported in Canadian Vehicle Use Study 2014 [33]: vehicle efficiencies were categorized for nine trip distances (<1 km, 1–5 km, 5–10 km, 10–15 km, 15–20 km, 20–30 km, 30–50 km, 50–100 km, and >100 km). The same methodology was used for calculation of CO2 emissions for both the baseline and the carsharing travel patterns. We used the average energy efficiency of all on-road vehicles by category [33] for the baseline case while the efficiency data based on the actual vehicle inventories of Modo and car2go were used for the carsharing scenarios (see table 2).
Table 2. Fuel efficiency values used in the calculator.
| Vehicle composition (%) | Fuel efficiency (L/100 km) | |||
|---|---|---|---|---|
| Carsharing fleet | Canada | Carsharing fleet | Canada | |
| Data source | Modo | Canadian Vehicle Survey 2009 | Modo + Fuel Consumption Guide 2014 | Canadian Vehicle Use Study 2014 |
| Sub compact | NAa | 7 | ||
| Compact | 44 | 55 | 8.7 | 9.7 |
| Mid-size | 19 | 8.8 | ||
| Full size | 1 | 5.5 (hybrid) | ||
| SUV | 6 | 13 | 12 | |
| Station Wagon | 16 | 3 | 9.4 | 12.6 |
| Pickup truck | 3 | 13 | 13.2 | |
| Van | 11 | 16 | 13.7 | 16.3 |
| Average | NA | NA | 9.7b | 12.2c |
aModo does not provide any sub compact cars; however, car2go provides more than 700 Smartfortwo vehicles in Vancouver. bThis averaged vehicle efficiency was used to calculate baseline emissions. cThis averaged vehicle efficiency was used to calculate post-carsharing emissions except vehicle optimization case, in which different vehicle types were assumed depending on trip purpose.
5. Result and analysis
CO2 emissions before and after participation in carsharing are shown in figure 3. Note that newer vehicle effects are present for all cases except pre-carsharing. The emission reduction effects by using newer vehicles vary depending on other factors at work especially mode change where use of other modes renders the fleet effect to be much smaller.
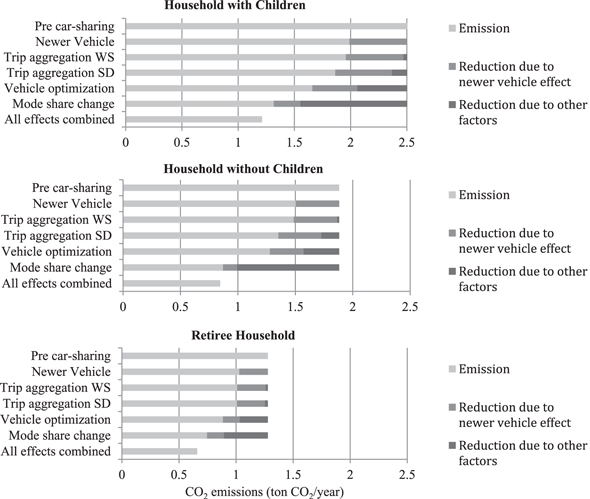
Figure 3. Modeled CO2 emissions by scenario and household.
Download figure:
Standard image High-resolution imageOverall, households with children had both the highest emission baseline and the largest emission reduction potential in absolute terms through carsharing. In terms of emission reduction ratio compared to baseline, households without children had the highest reduction potential (55% reduction of emission when all five factors are active). All household archetypes showed the same pattern of emission reductions from the five factors considered here. The quantitative emission reduction effects by carsharing can be summarized as falling into two categories. Using carsharing services without changing transportation modes, reduces emissions by 19%–20% due to the newer fleet; and a further 16%–19% due to vehicle optimization. Trip aggregation using the newer fleet delivers another 2%−8% GHG reduction. Trip aggregation to ensure WS delivers a marginal 1% reduction in GHG emissions8 . If, on the other hand, households were to use the new fleet and rely more on other transportation modes (as specified in table 1), a 42%–54% reduction in emissions can be realized. When all factors are considered, the maximum emission reduction potential of carsharing is expected to be in the range of 48%–55%.
The effect of transportation mode change was the largest of the five factors considered here, and accounted for total 42%–54% of reduction depending on the type of the household (including newer vehicle effect). However, it is important to recognize the assumptions leading to this outcome. We assumed that households would switch to public transit for commuting, but this is possible only if they have access to desirable public transportation services. Vancouver is a city well regarded in North America for its public transportation services; however, currently, one-third of the jobs in the Metro region are located beyond normal walking distance from its frequent transit network [35].
While realizing full effects of the transportation mode change requires a huge investment in infrastructure, vehicle optimization only requires a carsharing membership with vehicles at convenient pickup locations. Carsharing is financed by users and municipal governments help their adoption through convenient parking areas. Emission reductions due to vehicle optimization consist of two independent effects: effects caused by using newer vehicles and effects resulting from using right-sized vehicles. Combining the two effects leads to a privately funded GHG reductions of 31%–34%.
6. Sensitivity analysis
We conducted two types of sensitivity analysis to confirm the robustness of the model: (1) modifying fuel efficiency of pre-carsharing vehicles, and (2) modifying travel pattern prior to the carsharing participation. For simplicity's sake, we focused on the household without children because (1) there was a consistent emission reduction trend among the three household types, and (2) existing studies confirmed that the majority of carsharing users were younger professionals without children [9, 10, 28, 36, 37].
Table 3 shows the CO2 emissions by assuming different fuel efficiencies. The original assumption of the efficiency was 12.2 L/100 km, equal to the average Canadian vehicle9 [15]. Carsharing members motivated by environmental concerns are likely to be using a more efficient personal vehicle. A study covering 11 carsharing organizations in North America reported that the average fuel efficiency of vehicles shed by carsharing participation was 10.1 L/100 km [38]. By applying this number, the emission reduction effects by mode share change and vehicle optimization effect would be 45% and 19%, which are 9% and 13% lower than the baseline calculation respectively. For those motivated to join carsharing for economic grounds, it is likely that their current vehicle is older and less fuel efficient than the fleet average [39]. This would result in a higher emission reduction potential by carsharing as shown in table 3.
Table 3. Sensitivity of emission reductions to the fuel efficiency of vehicle shed.
| Emission reduction (%) due to | ||||||
|---|---|---|---|---|---|---|
| Mode share changea | Vehicle optimizationa | Trip aggregation SDa | Trip aggregation WSa | Newer vehicle | ||
| Assumed fuel efficiency of vehicle shed (L/100 km) | 8.0 | 30.6 | −2.0b | −17.9b | −18.5b | −19.9b |
| 9.0 | 38.0 | 8.9 | −5.3b | −5.8b | −7.1b | |
| 10.0 | 44.0 | 17.7 | 4.9 | 4.4 | 3.3 | |
| 11.0 | 48.9 | 25.0 | 13.2 | 12.8 | 11.8 | |
| 12.0 | 53.1 | 31.1 | 20.3 | 19.9 | 18.9 | |
| 13.0 | 56.6 | 36.2 | 26.2 | 25.9 | 25.0 | |
| 14.0 | 59.6 | 40.7 | 31.4 | 31.1 | 30.2 | |
| 15.0 | 62.2 | 44.5 | 35.9 | 35.6 | 34.8 | |
| 16.0 | 64.6 | 47.9 | 39.8 | 39.5 | 38.8 | |
| Originally assumed fuel efficiency of vehicle shed (L/100 km) | 12.2 | 53.7 | 32.0 | 21.4 | 21.0 | 20.1 |
aNewer vehicle effect is included. bNegative values mean an increase of emissions.
The second sensitivity analysis was conducted in order to see the relationship between travel pattern and emission reduction by carsharing. A hypothesis assumed here is that households who join carsharing and shed their cars have different travel patterns compared to the general public. Unfortunately, as far as we are aware, there is no quantitative report comparing travel patterns of households who join carsharing and do not. However, multiple studies and reports confirmed that most trips done by carsharing cars were non-commuting trips [7, 29, 36, 37, 40, 41], showing a possibility that commuting trips were originally done by non-car trips, such as public transit. In this sensitivity analysis, we re-allocated commuting trips that were originally assumed to be done by cars to public transit. Table 4 shows the results. The more reallocation, the less emission reduction effects are expected. Note that trip aggregation effects were excluded because of their marginal emission reduction potential. When all commuting trips were reallocated to transit, the emission reduction effects range between 15% and 33%.
Table 4. Sensitivity of emission reductions by commuting trip reallocations (% emission reduction).
| Reallocation of commuting from cars to transita | ||||||
|---|---|---|---|---|---|---|
| 0% | 20% | 40% | 60% | 80% | 100% | |
| Newer vehicle | 20.1 | 19.4 | 18.6 | 17.6 | 16.5 | 15.2 |
| Vehicle optimization (incl. newer vehicle effect) | 32.0 | 30.0 | 27.6 | 24.8 | 21.6 | 17.7 |
| Mode share change (incl. newer vehicle effect) | 53.7 | 50.6 | 47.1 | 43.0 | 38.2 | 32.6 |
aFor example, 30% of reallocation means 30% of commuting trips originally done by auto-driver are done by transit alternatively. 0% reallocation means no reallocation, equal to the original assumptions.
7. Conclusion
In this study, we explored the GHG emissions of different household archetypes switching to carsharing. The study characterized and quantified five contributing factors to a change in GHG emissions: mode shift, newer fleet, right sizing, more efficient drivetrains and trip aggregation. The first three factors led to significant reductions in GHG emissions regardless of the household archetype (42%–54%, 19%–20%, 31%–34%, respectively). Transportation mode change had the highest emission reduction potential; 42%–54% reduction of CO2. The GHG mitigation effects compared to baseline in relative term were highest for households working away from home and without children, and lowest for households working at home (or retired) and without children. The highest impact group is the most likely to adopt carsharing as their daily routines can be accommodated to being without a personal vehicle. However high GHG reductions are conditional on the provisioning of an attractive public transportation option. Since many households do not have access to such public transportation services, it is unrealistic to assume all households with external employment shift from cars to public transit to commute to work.
Carsharing advocates have emphasized the GHG savings arising from the increased use of public transit when users forego their personal vehicles for carsharing. Here, we have shown that regardless of mode shifts, access to a newer and optimized fleet of vehicles through carsharing leads to more than 1/3 GHG reductions without any mode shift. This effect may be more compatible with personal preferences that prefer private transport and does not entail large public outlays to expand and maintain public transit. Public policies that support carsharing through minimally impactful measures such as special parking arrangements, are critical in expanding carsharing services [1]. Our findings emphasize the environmental benefits of increased effort to enhancing access and use of carsharing at little or no cost to the public purse.
We close with limitations of this study and suggestions for future research. First, the scenarios used for this study were not based on actual data on how carsharing impacts trip mode choices and patterns. Second, we assumed that households who join carsharing and shed their cars, are no different from general public. The sensitivity analyses shows how the GHG savings are affected when this assumption is relaxed. Third, those who choose to abandon their private cars when joining a carsharing service for economic reasons, may not continue to eschew private car ownership as their circumstances change. More detailed longitudinal data are needed to assess the population-wide long-term effects of carsharing on car ownership, travel patterns and GHG emissions. Fourth, we focused on households owning private cars, which are expected to be the standard household archetypes in this region. However, the environmental impact caused by households who gain access to cars through carsharing needs to be examined to develop a full picture of the effects of carsharing. Fifth, while this paper is focused on GHG emissions; many other environmental effects should also be studied—most notably emissions of criteria pollutants and noise. Finally, casual observation suggests that actual driving behavior of per-minute carsharing drivers may be more aggressive than the average. This may be motivated by operators' desire to minimize rental payments, but its impacts on fuel efficiency, safety and collision rates need to be assessed.
Carsharing is relatively new and many private companies are entering this market [42]. We believe that developing an appropriate data sharing platform open to analysis for public interest purposes is an important step towards development of evidence-based public policies to maximize the benefits from carsharing services.
Acknowledgments
We would like to thank Milind Kandlikar and Hisham Zerrifi at the University of British Columbia for their careful review and suggestion of how to improve this paper. We also greatly appreciate data and support from Karen New at Modo, Aaron Ludmer at Transport Canada, and Klaas-Pieter Marinesse at Moovel. M Namazu is grateful for support from the Takenaka Scholarship Foundation from Japan. This project was also supported by Carnegie Mellon's Climate and Energy Decision Making Center (CEDM) under a subcontract from the US National Science Foundation (SES-0949710).
Appendix:: Travel behavior by household type
We assumed trip frequencies by trip purpose, travel distance and transportation mode for each household type in order to accurately assume CO2 emissions. In order to assume such detailed travel behavior, we presumed (1) the frequency distribution of trips by trip distance and purpose, and (2) transportation mode share by household type, trip purpose and travel distance. Metro Vancouver Trip Diary Survey 2011 [19] is the main source to develop the travel behavior. Since the Trip Diary data is not detailed enough, we made the following adjustments; first of all, travel patterns of household with children, household without children, and retiree household were adopted from travel patterns of households with grade-school or pre-school aged children, households without grade-school or pre-school aged children, and over 65 years old elderly residents. We also took into account the dissimilarities of trip behavior between weekday and weekend. The Trip Diary examined trips on a weekday [19], and it is known that there is about 10% decrease of trip frequency during weekend compared to weekday [43]. The reductions in commuting and escorting trips are likely key reasons for this observation. We assumed that during weekend, work/post secondary trips were eliminated, and the frequencies of the other trips were adjusted to satisfy a 10% decrease of the total trip frequency. The assumed travel behavior is summarized in figures A1 and A2.

Figure A1. Trip distance distribution by travel purpose. This distribution was commonly used for all household types.
Download figure:
Standard image High-resolution image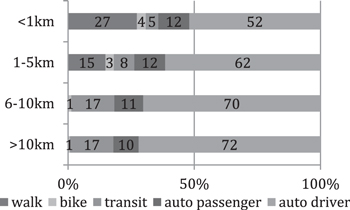
Figure A2. Transportation mode share by travel distance. Different transportation mode shares were assumed for each household in the calculation. This graph shows the averaged share.
Download figure:
Standard image High-resolution image
Footnotes
- 1
More accurately, very short term car rentals.
- 2
See appendix for the modifications made to the Trip Diary data.
- 3
- 4
Founded in Vancouver in 1997 and previously known as Cooperative Auto Network, CAN.
- 5
Note that this average is based on mathematical calculations. Beyond a certain age, vehicles might be more for leisure than a merely transportation option.
- 6
This mode shift might differ among different population (e.g. younger and elderly populations); however, insufficient data kept us from taking into account those insights in this study. This data availability issue is discussed in the conclusion.
- 7
For example when two destinations are combined into one trip, on average, the total distance covered is 30% shorter.
- 8
The impact of warm restarts is far more significant for criteria pollutants.
- 9
Canadian average fuel efficiencies of passenger car, minivan, pick-up truck, and SUV were 9.7, 13.6, 16.4 and 12.9 L/100 km [15].