

Abstract
The urban transport sector is one of most significant contributors to greenhouse gas (GHG) and air pollutant (AP) emissions. To achieve co-benefits of GHG and AP emission reductions, a synergistic mitigation approach targeting both climate change and air pollution has gained more attention. In this study, we evaluate mitigation synergy and policy implications for GHGs and nine APs, namely, sulfur dioxide (SO2), nitrogen oxides (NOx), carbon monoxide (CO), particulate matters (PM10 and PM2.5), black carbon (BC), organic carbon (OC), volatile organic compounds (VOCs) and ammonia (NH3), in the transport sector of Xiamen, China, during the 2013–2060 period using the Low Emissions Analysis Platform model and quantitative analysis methods. Results show that light-duty vehicles, river boats, buses and heavy-duty trucks are significant common sources of GHG and AP emissions. Road sector abatement during 2013–2020 was most prominent, especially for CO, NOX, VOCs and GHGs. In this sector, guide green travel (GGT) and adjust energy structure (AES) are dominant measures for mitigation synergy between GHGs and APs. From 2021 to 2060, emission pathways for GHGs, SO2, CO, VOCs and NH3 under optimize transport structure (OTS), AES and GGT scenarios will decrease markedly. Their emissions will peak soon relative to those under business as usual scenario. Additionally, the potential of mitigation synergy may mainly be attributed to the road and shipping sectors under AES scenario, which is the most effective in reducing PM10, PM2.5, BC and OC emissions; the mitigation potential under the AES scenario for GHGs and other APs is nearly 1–4 times as high as that under OTS and GGT scenarios. Therefore, mitigation synergy, especially in adjusting the energy structure for the transport sector, is essential for achieving the simultaneous goals of the 'blue sky' and 'carbon peaking and neutrality'.
Export citation and abstract BibTeX RIS

Original content from this work may be used under the terms of the Creative Commons Attribution 4.0 license. Any further distribution of this work must maintain attribution to the author(s) and the title of the work, journal citation and DOI.
1. Introduction
Global climate warming and air pollution are severe challenges that urgently need to be addressed worldwide. With rapid economic development and urbanization, the urban transport sector is becoming one of most significant contributors to greenhouse gas (GHG) and air pollutant (AP) emissions (Axsen et al 2020, McDuffie et al 2020). CO2 emissions in the transport sector grew at an annual average rate of nearly 1.7% from 1990 to 2021, faster than emissions from any other sector (IEA 2022). Additionally, PM2.5 and ozone (O3) attributed to transportation tailpipe emissions were linked to approximately 7.8 million years of life lost globally in 2015 (Anenberg et al 2019). In China, the transport sector is the third-largest emission source of GHGs, with 8.5% in 2019, and it is responsible for a large share of air pollution, accounting for 35.1%, 24.4%, 18.5% and 16.7% NOX , BC, CO and volatile organic compound (VOC) emissions in 2017, respectively (Zheng et al 2018, Guan et al 2021). Therefore, there are considerable benefits of reducing GHG and AP emissions from urban transport sector for both climate change mitigation and air quality improvement. Previous studies suggest that clean air measures promote GHG emission mitigation by affecting local energy systems even when the original policy objective is not related to climate change (Tibrewal and Venkataraman 2021). GHG emission mitigation-oriented low-carbon energy policies also help reduce AP emissions (Xing et al 2020).
Synergistic mitigation has gained more attention for addressing both climate change and air pollution (Scovronick et al 2019). Such synergy is essential, particularly for developing countries suffering the dual burdens of air pollution and massive GHG emissions. In China, the simultaneous goals of the 'blue sky' and 'carbon peaking and neutrality' are proposed (Wang et al 2019, Cheng et al 2021). However, air pollution problems, particularly in PM2.5 and O3 (Bian et al 2019, Wang et al 2020), are still a major concern although a portfolio of clean air measures has been launched (SCPRC 2013, 2018). It follows that further improving air quality become challenging because advanced end-of-pipe control technologies have already been applied in power generation and industrial sectors unless considering low-carbon policies (Zheng et al 2018, Xing et al 2020). Hence, integrated co-controls for GHG emissions and air pollution should be advocated.
Recent research evaluates mitigation synergy of reducing GHG and AP emissions for the entire sector, from global, national, regional and even city-level scales (Xing et al 2020, Jiang et al 2021, Xu et al 2021). These results confirm the co-benefits of GHG and AP abatement measures, providing practical support for synergistic mitigation. However, as emission reductions progress, accurate measures are essential. Some research has also focused on specific sectors, such as the industrial sector and power sector, exploring their potential for mitigation synergy (Mao et al 2014, Zhang et al 2015).
The mitigation synergy between GHG and AP emissions in urban transport sector is an inevitable topic. Here, the Low Emission Analysis Platform (LEAP) model is widely used in predicting emissions from the transport sector (Heaps and C G 2022). Feng et al (2021) used the LEAP model to analyze the co-benefits of CO2, NOX and PM2.5 emission controls in the Chinese transport sector during 2015–2050, identifying the carbon peaking year and the co-benefits of emission reductions under different scenarios. Similarly, Jiao et al (2020) established the LEAP framework to analyze the co-benefits of CO2 and AP mitigation (SO2, NOX , CO, PM10, PM2.5 and hydrocarbon compounds) under the sustainable scenario in the Guangzhou's transport sector in 2017 and 2035. Results highlight adjusting transport modes and electrification are effective measures for achieving the co-benefits. Additionally, many researchers find the co-benefits of GHG and AP abatement for a single sub-sector of urban transport sector, such as passenger transport, electric private cars and transport fleets (Peng et al 2015, Alam et al 2018, Alimujiang and Jiang 2020), ranging across nations and megacities. Although some studies examine the co-benefits of lowering CO2 and several APs, they do not fully cover the regular nine APs in China (namely, SO2, NOX, CO, PM10, PM2.5, BC, OC, VOCs and NH3). Yet missing APs in previous studies are significant (MEEPRC 2015). For example, BC is mostly derived from mobile sources (i.e. road and shipping sectors) and has a detrimental impact on climate change (Zhou et al 2020). Climbing NH3 emissions from road sector may contribute crucially to NH3 pollution (Wang et al 2023). Furthermore, while several studies have conducted ex post analyses to evaluate the mitigation effect (Wang et al 2016, Qiu et al 2020), hindcasting historical emissions using the LEAP model is rarely seen, much less in urban transport sector.
To conduct research on the quantitative analysis of mitigation synergy in the entire urban transport sector, this study attempts to answer three core research questions: (1) how do GHG and AP emissions share root origins in the whole urban transport sector? (2) To what extent do past AP-induced control measures drive GHG mitigation? (3) What are the prospective emission pathways and synergistic mitigation potential by scenarios? As these questions are answered, the mitigation synergy of urban transport sector between GHG and AP emissions is identified. Accordingly, we provide comprehensive insights into the co-benefits of mitigation under scenarios for urban transport sector in China.
Xiamen is a coastal city located in Southeast China (figure S1). It combines comprehensive transportation modes, including road, shipping, aviation and rail. The civilian vehicle population shows a rapid increase from 1.1 in 2013 to 1.8 million in 2022 (XMBS 2022). Xiamen's transport sector reported has become the major sector of GHGs (∼18%) and several AP (i.e. SO2, NOx , VOCs, CO, PM10 and PM2.5) emissions (Zhou et al 2011, BEEXM 2022). Furthermore, under a business-as-usual scenario, the emissions from urban transport sector are projected to continue increasing due to the urban sprawl and rising transport demand in Xiamen. Thus, co-reducing GHG and AP emissions in Xiamen's transport sector is a pressing concern, with limited existing direct evidence on the Xiamen context. This paper selects Xiamen as the case study to conduct an empirical investigation.
In this work, the mitigation synergy between GHG and nine AP emissions from 2013 to 2060 is quantified in Xiamen's transport sector using the LEAP model as an emission analysis tool. First, the historical emission trend is developed from 2013 to 2020 because clean air actions were thoroughly carried out during this period. Second, the co-benefits of GHG mitigation from clean air actions are analyzed by combining the LEAP model and quantified index, namely, the coordinated control system and emission reduction cross elasticity (Els). Third, urban transport emission pathways and synergistic mitigation potential of GHGs and APs are explored under different scenarios. Finally, policy implications are analyzed to highlight further opportunities for mitigation synergy.
2. Methods and data
2.1. Emission calculation
The LEAP model is applied extensively for setting energy-related carbon emission scenarios (Cai et al 2013, Wu et al 2021). It is basic framework is shown in figure S2. Recently, the LEAP model has been extended to energy-related AP emission projections (He et al 2010, Jiang et al 2021). However, there are still incomplete AP emissions in urban transport sector because the emission factors of fuel by different emission standards are not embodied. Hence, we establish a customized LEAP model for GHGs and nine APs in Xiamen's transport sector by adopting local AP emission factors and referring to the AP emission inventory for Chinese cities (MEPC 2017). Our study period established in the LEAP model from 2013 to 2060. The emissions from 2013 to 2020 are considered historical, with 2020 serving as the baseline year for future predictions.
As seen in table 1, we first unify and establish sector classification, including four sector categories (i.e. road, shipping, aviation and rail) and sixteen sub-sectors, to make GHG and AP emissions comparable. The detailed classification in the LEAP model is shown in figure S3. The estimates of GHG emissions from urban transport sector include three types (i.e. CO2, CH4 and N2O), and the final results are presented by GHGs due to the small proportion of CH4 and N2O. Nine APs (i.e. SO2, NOX , CO, PM10, PM2.5, BC, OC, VOCs and NH3) are individually analyzed. For GHGs, an energy consumption-based method based on the IPCC guidelines is used to estimate historical GHG emissions, as shown in equation (1)

Table 1. Emission sector categories for Xiamen's transport sector.
| Sector | Sub-sector | Sector | Sub-sector |
|---|---|---|---|
| Road | Bus | Motorcycle | |
| Heavy-duty truck | Taxi | ||
| Heavy-duty vehicle | Shipping | River boat | |
| Light-duty truck | Ocean vessel | ||
| Light-duty vehicle | Aviation | International flight | |
| Low-speed truck | Domestic flight | ||
| Medium-duty truck | Rail | Freight | |
| Medium-duty vehicle | Passenger |
where  denotes the emissions of a specific GHG type i on energy j (i.e. gasoline, diesel, natural gas, fuel oil, jet kerosene, electricity, hydrogen and sustainable aviation fuel) consumed in sector/sub-sector k.
  denotes the corresponding energy consumption based on a bottom-up survey provided by local government departments.
  denotes the associated factors obtained from the IPCC guidelines (IPCC 2006).
  denotes the global warming potential of GHG type i referring to the IPCC fifth assessment report (IPCC 2014), that is, 1, 28 and 265 for CO2, CH4 and N2O, respectively.
Except for road sector, APs include eight types (i.e. SO2, NOX , CO, PM10, PM2.5, BC, OC and VOCs). We apply a dynamic technology-based approach to the multi-year AP emission inventory following previous studies (Streets et al 2006, Bian et al 2019), as shown in equation (2). Specifically, the emission factor of SO2 is estimated by equation (3), and S represents the sulfur content in fuel

where  and
and  denote the emissions and activity level n (i.e. energy consumption and flight movements) of a specific AP type m in emission sector/sub-sector k. Activity-level data are from government departments and the yearbook of Xiamen's special economic zone (XMBS 2014–2014-2021).
  denotes emission factors based on the guidelines for the development of an AP emission inventory for Chinese cities (MEPC 2017).
  denotes the removal efficiency due to technological penetration and emission controls.
Additionally, road sector emissions (RE) are calculated by vehicle populations (P), annual average vehicle kilometers traveled (VKT) and vehicle emission factors (EF) using equation (4). Here, m represents a specific AP in nine types; p and q represent the vehicle type and emission standard, respectively. Data are from the yearbook of Xiamen's special economic zone and field investigation (XMBS 2014–2014-2021)
2.2. Quantification of mitigation synergy
To quantify the effect and degree of mitigation synergy for GHG and AP emissions under different clean air measures, the coordinated control system and pollutant reduction cross elasticity (Els) are employed in Xiamen's transport sector during 2013–2020. These are two methods ordinarily used in previous studies (Alimujiang et al 2020). Clean air measures during 2013–2020 are summarized in table 2.
Table 2. Seven scenarios for Xiamen's transport sector during 2013–2060.
| Scenarios | Sectors | Detail descriptions | Periods | References | |
|---|---|---|---|---|---|
| Before 2020 | After 2020 | ||||
| BAU | All | Equal to actual historical emissions during 2013–2020. | 2013–2020 | — | — |
| All | Set parameters based on historical trends from 2013 to 2020 with limited intervention measures during 2021–2060. | — | 2021–2060 | — | |
| ERT | Road | Eliminate yellow label cars. | 2014–2020 | — | 1,2,3 |
| Water | Carry out vessel pollution controls. | 2014–2017 | — | 1 | |
| Strengthen management of old fishing boats and accelerate the upgrading of fishing boats. | 2019- | — | 7,9 | ||
| Implement management of control area for AP emissions from vessels, and reduce the AP emissions, such as SO2, NOX , PM and VOCs. | 2019- | — | 7 | ||
| GGT | Road | Carry out green travel initiatives. | 2014–2017 | 2022- | 1,8,1 |
| UOQ | Road | Accelerate the upgrading of oil quality. | 2014–2018 | — | 1,3,4,6,7 |
| Road, Shipping | Since 2019, supply motor diesel that meets National VI standards, stop selling ordinary diesel and motor diesel lower than National VI standards, and realize integration of motor diesel, general diesel and some vessel oil. | 2019- | — | 4,7 | |
| IVE | Road | Improve National VI emission standards for diesel trucks, and accelerate the elimination of diesel trucks with National III emission standards and below. | 2014–2017 | — | 2,7,9 |
| AES | Road | Promote the construction of fast charge networks in highway service areas, and encourage the application of power change modes. | — | 2022- | 8 |
| Road | Improve energy efficiency standards for fuel vehicles. | — | 2022- | 8 | |
| Road, Shipping | Popularize clean energy and new energy vehicles. | 2014–2020 | 2020- | 1,2,3,4,7,8,9 | |
| Shipping | Promote the use of electricity, natural gas vessels; explore the application of methanol, hydrogen, ammonia and other new power vessels, and promote the application of liquefied natural gas powered vessels. | 2018–2020 | 2022- | 4,8 | |
| Shipping | Promote the use of port shore power by moored ships and constantly increase the utilization rate of shore power. | 2018–2020 | 2022- | 4,7,8,9 | |
| Rail | Improve railway electrification. | — | 2022- | 8 | |
| Aviation | Promote actively the use of sustainable aviation fuel. | — | 2022- | 8 | |
| OTS | Road, Shipping, Rail | Promote vigorously Rail-Water combined transportation, and continue to achieve 'road to rail' and 'road to water' for bulk goods, medium—and long-distance goods. | — | 2022- | 8,9 |
| Road | Promote the establishment of urban green freight delivery demonstration projects, and encourage the development of joint, centralized and night delivery modes. | — | 2022- | 8 | |
| Road, Aviation | Build a freight hub and its supporting logistics concentration area, strive to build a multimodal transport demonstration base, and promote the construction of a comprehensive freight hub. | 2018–2020 | — | 5,7 | |
| Shipping, Rail | Promote Sea-Rail combined transport, and accelerate the construction of Xiamen Port Railway, with the annual growth rate of container Rail-Water combined transport at Xiamen Port exceeding 10%. | 2018–2020 | — | 4,5 | |
| Rail | Improve gradually the proportion of railway transport for bulk cargo such as Xiamen Port, and the proportion of railway ports and important ports will exceed 60%. | 2019–2020 | — | 7 | |
a Scenarios are named after the type of measures, the abbreviations for these scenarios also represent certain types of measures. For example, AES scenario also refer to AES measures. b References are mainly from released policy; 1–9 represent the number of file names and their information shown in table S2.
A coordinated control system is a two-dimensional coordinate system that intuitively manifests the co-benefits of GHGs and APs. We use the abscissa and ordinate to represent cumulative emission reductions of GHGs and APs, respectively, during this study period. Under different clean air measures, a specific AP and GHG abatement can fall on a point in the coordinate system (figure 1(a)). For a given constant level of AP emissions reductions, a smaller angle α indicates a better effect on GHG mitigations.
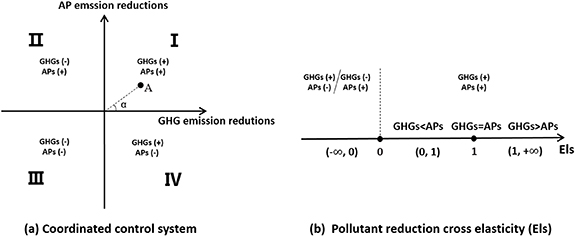
Figure 1. Quantification of mitigation synergy between GHG and AP emissions. (a) Coordinated control system, (b) pollutant reduction cross elasticity (Els). If the point (such as point A) is located in the first quadrant, the measures can co-reduce AP and GHG emissions. Note the mitigation synergy is considered to have no impact on AP and GHG emissions if points are located on or close to the x/y axis. '+' and '−' represent emissions increase and decrease under abatement measures, respectively. When Els = 0, the abatement measure has no synergy. When Els > 0, the abatement measure has positive synergy, and the degree of mitigation have three cases, namely Els > 1, Els = 1 and 1 > Els > 0 suggest the degree of GHGs are higher, equal and lower than that of APs, respectively.
Download figure:
Standard image High-resolution imageFurthermore, we utilize Els to evaluate which matters between GHGs and APs have a larger abatement degree under co-mitigation measures based on the range of Els. The Els estimates are obtained by equation (5). Additionally, figure 1(b) displays the positive/negative synergy and co-reduction degree
Here,  is the cross-elasticity of a specific AP with GHGs, and
  and
and  represent the GHG and AP change rates, respectively.
2.3. Emission scenarios
Based on existing emission policies and regulations released by Chinese and local governments, the emission scenarios, which are associated with control measures executed during 2013–2060, are set in the aforementioned LEAP model, assessing mitigation synergy effects and potential. There are seven emission scenarios, namely, the business as usual (BAU), eliminate and renew transportation (ERT), guide green travel (GGT), upgrade oil quality (UOQ), improve vehicular emission standards (IVE), adjust energy structure (AES) and optimize transport structure (OTS) scenarios (all abbreviations are listed in table S1). The scenario descriptions are shown in table 2, and the main references are summarized in table S2. Considering the timeline for scenario implementation (table 2), it can be observed that all scenarios cover the 2013–2020 period, and four scenarios (i.e. BAU, GGT, AES, and OTS) are considered from 2021 to 2060. The key parameters set in the LEAP model are shown in table S3.
3. Results
3.1. Trends in emissions from 2013 to 2020
GHG and AP emissions of Xiamen's transport sector from 2013 to 2020 are estimated. Figure 2 shown both GHG and AP emissions have similarities and differences. For GHGs, emissions increased steadily from 5.4 Mt in 2013 to 8.6 Mt in 2019, yet GHG emissions dropped to 8.2 Mt in 2020 due to the influence of the COVID-19 pandemic, especially GHG emissions from international flights in 2020, which decreased by approximately 15% compared to 2019. Additionally, emissions from taxis and buses have also declined in recent years and varied considerably in 2020, which benefits from the vehicular fuel transition from oil to electricity and natural gas. Light-duty vehicles are the dominant sector driving the emission variations, and their contribution accounted for 31% in 2013 and increased to 46% in 2020.
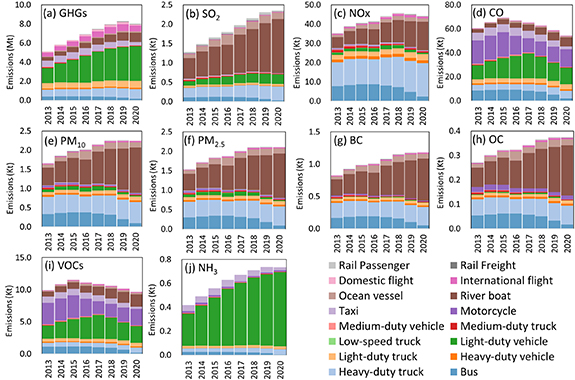
Figure 2. Emission trends and source contributions of transport sector in Xiamen between 2013 and 2020.
Download figure:
Standard image High-resolution imageSimilar to GHGs, emissions from light-duty vehicles are also important for CO, VOCs and NH3, especially for NH3. NH3 emissions originate from road sector and mostly come from light-duty vehicles, with contributions increasing from 64% in 2013 to 84% in 2020. The agricultural sector is the largest contributor to NH3 emissions (Huang et al 2012), whereas its emissions are concentrated in rural areas, and vehicular NH3 emissions elevate with urbanization and increasing transport populations. With a high urbanization of 90% in 2021 (XMBS 2022), Xiamen's NH3 emissions from the transport sector were the third-largest source (figure S4). Thus, it is imperative to continually pay attention to vehicular NH3 emissions in Xiamen. Regarding CO and VOCs, these emissions increased from 2013 to 2015 and declined after 2015. For VOCs, VOC emissions increased from 10.0 kt in 2013 to 11.5 kt in 2015 and decreased to 9.7 kt in 2020. Motorcycles and light-duty vehicles are two major contributors to VOC emissions in the transport sector, with emissions decreasing after 2015 and 2017, respectively, as a result of the ban on motorcycles and the strengthening of vehicular emission standards.
Due to the lack of strict regulations on vehicular NH3 abatement, its emissions climbed during 2013–2020. SO2 emissions also increased from 1.3 kt in 2013 to 2.4 kt in 2020. Unlike NH3, the reasons for the rising SO2 emissions are attributed to shipping sector; river boats are the dominant SO2 emitter, with a 161% increment. In addition to SO2, shipping sector emissions are prominent and growing, with annual average contributions of NOX , PM10, PM2.5, BC and OC of 28%, 45%, 46%, 48% and 48%, respectively, during the 2013–2020 period. Notably, although shipping sector GHG emissions are minor, their contributions grew from 9% in 2013 to 14% in 2020. Therefore, Xiamen should focus efforts on shipping sector emissions to yield co-benefits for reducing GHG and AP emissions, especially for SO2, NOx , PM10, PM2.5, BC and OC.
NOX emissions in the transport sector increased from 35 kt in 2013 to 46 kt in 2018 and decreased to 44 kt in 2020. Heavy-duty trucks are the largest contributor to NOX emissions, with an average contribution of 35%, followed by river boats (23%). NOX emissions from buses have evidently dropped since 2017 at a 71% rate. The characteristics of PM10, PM2.5, BC and OC emissions are in accordance. For PM2.5, emissions grew from 1.5 kt in 2013 to 2.1 kt in 2018 before a plateau. PM2.5 emissions from heavy-duty trucks are also important, with an average contribution of 23%, second to river boats (39%). Similar to NOX , PM2.5 emissions from buses also decreased after 2017.
3.2. Mitigation synergy analysis
To evaluate clean air actions to co-reduce GHG emissions during 2013–2020, we estimate reductions in nine APs and GHG emissions from the road, shipping, aviation and rail sectors by comparing the cumulative difference between six scenarios (i.e. ERT, GGT, UOQ, IVE, AES and OTS) and BAU, as shown in figure 3(a). According to estimations, the implementation of clean air measures for Xiamen's transport sector were able to avoid emissions of GHGs, SO2, NOX, CO, PM10, PM2.5, BC, OC, VOCs and NH3 with 5.3 Mt, 1.5 kt, 32.5 kt, 45.4 kt, 2.2 kt, 2.1 kt, 1.1 kt, 0.4 kt, 7.3 kt and 0.7 kt, respectively. Overall, road sector abatement is the most prominent, especially for CO, NOX , VOCs and GHGs. In this sector, GGT and AES are major measures for mitigation synergy between GHGs and APs, and UOQ only helps reduce APs, especially NOX , PM10, PM2.5 and BC. Following shipping sector emissions, OTS is the principal scenario for GHG and AP mitigation. The reduction in emissions from the aviation and rail sectors is small, and optimizing the transport structure, such as developing an air-freight service hub and combined rail-water transport, is the sole measure helping mitigation in the aviation and rail sectors.

Figure 3. Contributions to mitigation synergy by scenarios in Xiamen's transport sector during 2013–2020. (a) Cumulative GHG and AP abatement by comparing six scenarios with BAU in road, shipping, aviation and rail sectors. (b) The degree of synergic mitigation between GHG and each AP emissions.
Download figure:
Standard image High-resolution imageThe degree to which each scenario contributes to mitigation synergy between GHGs and APs for the whole transport sector is presented in figure 3(b). No clean air measures in Xiamen's transport sector during the 2013–2020 period increased GHG emissions; instead, they mainly cut emissions. Two scenarios (namely UOQ and IVE) reduced AP emissions but did not or scarcely contribute to GHG abatement, where other four scenarios (i.e. OTS, ERT, GGT and AES) had co-effects on GHG and AP abatement to some extent. For VOCs, an emission reduction of approximately 1 Mt GHGs was induced by cutting VOC emissions by 5.5 kt, 1.4 kt, 1.2 kt and 1.0 kt under ERT, AES, OTS and GGT scenarios, respectively. Thus, GGT and OTS have the largest co-effects between VOC and GHG abatement. Note that emission reductions may not be linear between GHGs and APs under measures; here, only the degree of synergy under different scenarios is compared. Similarly, GGT has massive mitigation and GHG co-benefits for SO2, NOX and CO emissions; under the scenario, reducing 0.2 kt SO2, 0.2 kt NOX and 1.6 kt CO emissions co-drives 3 Mt GHG mitigation. Additionally, although there is only small mitigation of APs, significant mitigation is observed under some scenarios. For example, GGT has a small effect on cutting PM10, PM2.5, BC and OC emissions but is significant for GHG emission reductions. Thus, we consider them to have weak co-effects. Based on these results, AES has good mitigation synergy between AP (i.e. PM10, PM2.5, BC, OC and NH3) and GHG emissions, co-reducing PM10, PM2.5, BC, OC and GHG emissions by 0.5 kt, 0.5 kt, 0.2 t, 0.2 t and 1.8 Mt, respectively. The GHG degrees of synergy from different clean air measures for nine APs are summarized in table 3.
Table 3. Index of mitigation synergy by clean air measures during 2013–2020
| Scenarios | Index | SO2-GHGs | NOx -GHGs | CO-GHGs | PM10-GHGs | PM2.5-GHGs | BC-GHGs | OC-GHGs | VOCs-GHGs | NH3-GHGs |
|---|---|---|---|---|---|---|---|---|---|---|
| OTS | Els | 0.36 | 0.59 | 1.93 | 0.55 | 0.55 | 0.45 | 0.76 | 1.58 | 5.18 |
| Els range | (0, 1) | (0, 1) | (1, +∞) | (0, 1) | (0, 1) | (0, 1) | (0, 1) | (1, +∞) | (1, +∞) | |
| Reducing degree | > | > | < | > | > | > | > | < | / | |
| α (°) | 36 | 49 | 30 | 35 | 33 | 20 | 7 | 50 | 1 | |
| Synergic degree | 2 | 2 | 3 | 2 | 2 | 1 | 1 | 3 | / | |
| ERT | Els | 0.13 | 0.20 | 0.39 | 0.16 | 0.16 | 0.14 | 0.18 | 0.35 | 6.54 |
| Els range | (0, 1) | (0, 1) | (0, 1) | (0, 1) | (0, 1) | (0, 1) | (0, 1) | (0, 1) | (1, +∞) | |
| Reducing degree | > | > | > | > | > | / | / | > | / | |
| α (°) | 65 | 73 | 71 | 67 | 66 | 50 | 25 | 80 | 1 | |
| Synergic degree | 1 | 1 | 1 | 1 | 1 | / | / | 1 | / | |
| GGT | Els | 3.72 | 10.33 | 2.11 | 12.59 | 12.59 | 23.67 | 31.56 | 1.98 | 0.47 |
| Els range | (1, +∞) | (1, +∞) | (1, +∞) | (1, +∞) | (1, +∞) | (1, +∞) | (1, +∞) | (1, +∞) | (0, 1) | |
| Reducing degree | < | < | < | / | / | / | / | < | > | |
| α (°) | 4 | 4 | 28 | 2 | 2 | 0 | 0 | 44 | 9 | |
| Synergic degree | 4 | 4 | 4 | / | / | / | / | 4 | 1 | |
| AES | Els | 0.68 | 2.05 | 1.14 | 1.31 | 1.29 | 1.65 | 0.94 | 1.36 | 0.71 |
| Els range | (0, 1) | (1, +∞) | (1, +∞) | (1, +∞) | (1, +∞) | (1, +∞) | (0, 1) | (1, +∞) | (0, 1) | |
| Reducing degree | > | < | < | < | < | < | > | < | > | |
| α (°) | 21 | 18 | 45 | 16 | 16 | 6 | 5 | 55 | 6 | |
| Synergic degree | 3 | 3 | 2 | 3 | 3 | 2 | 2 | 2 | 2 |
a Synergistic degree refers to the extent of co-reducing GHG emissions under different scenarios for each AP. The degree of co-effects rises in turn from 1 to 4. b Null values denote scenarios work little for some APs though higher GHG emission reductions. c Clean air measures only include four scenarios due to other two scenarios (i.e. UOQ and IVE) reduce rare and even no GHG emissions. d '>' and '<' represent the reducing degree of a certain AP is higher and lower than that of GHGs, respectively.
Among four significant scenarios, i.e. OTS, ERT, GGT and AES, we use Els ranges to evaluate which one exhibited a higher degree of reduction between APs and GHGs under different scenarios during 2013–2020 (table 3). ERT has higher mitigation effects for APs than for GHGs (1 > Els > 0), OTS also has a greater degree of reduction, mostly for APs, except for CO and VOCs. These indicates two measures has more significant effects on most AP mitigation. Additionally, GGT and AES are more effective at reducing GHG emissions than most APs (Els > 1), highlighting the crucial role of clean air measures (particularly in GGT and AES) in driving GHG mitigation in the future, which is a key pathway for achieving future carbon emission reductions.
3.3. Emission predictions under scenarios from 2021 to 2060
Future emissions of GHGs and APs for Xiamen's transport sector by scenarios during 2020–2060 are shown in figure 4. Detailed scenario descriptions are summarized in table 2. Under BAU scenario, if few intervening measures are adopted during 2021–2060, GHG emissions will increase by 55% from 2021 to 2038, and rise slightly during 2039–2060. SO2, CO, VOC and NH3 emissions will increase before decreasing with peaks in 2036, 2029, 2033 and 2037, respectively. Unlike their emissions increasing steadily until the peak year, NOx emissions will have a momentary drop before climbing to a peak in 2037 and then falling. PM10, PM2.5, BC and OC emissions will also have momentary drops before 2025, after which they are expected to increase until 2060.

Figure 4. Emission pathways of GHGs and APs for Xiamen's transport sector by scenarios during 2020–2060.
Download figure:
Standard image High-resolution imageRegarding OTS scenario, it seems clear that GHG, SO2, NOx , CO, VOC and NH3 emissions will be lower than those under BAU scenario. GHG emissions will increase by 39% from 2020 to 2038 and then decline by 5% until 2060. CO, VOCs and NH3 emission trends will be similar to those of the corresponding emissions under BAU scenario, with emission peaks in 2025, 2032 and 2036, respectively, earlier than those under BAU scenario. The SO2 and NOx emission trends will also be similar to those under BAU scenario before 2050, but edge up after 2050, mainly resulting from the slowing declines in the population of heavy-duty trucks due to 'road to water and rail'. These will be also reflected in the slower declines of CO, VOCs and NH3 emissions. For PM10, PM2.5, BC and OC, their emission trends will be slightly lower than those under BAU but surpass those since 2051, mostly because shipping sector emissions will increase more than road sector emissions will decrease due to 'road to water'. Compared to emission pathways under BAU scenario, emissions under GGT scenario will decrease to some extent for GHGs, SO2, CO, VOCs and NH3. However, for NOx , PM10, PM2.5, BC and OC, the emissions under GGT will mostly coincide with those under BAU scenario. This is mainly because the population of light-duty vehicles will be slightly affected by GGT scenario, and emission factors of NOx , PM10, PM2.5, BC and OC will undergo significant declines over time under BAU scenario. Thus, mitigation effects under GGT scenario are expected to be minimal. Note that both GHG and AP emissions under AES scenario will have obvious mitigation. Similar to the emission pathways under OTS and GGT scenarios, GHG emission pathways under AES scenario will decrease by 27% after increasing by 79% with a peak in 2033. Additionally, SO2 and NH3 emissions will have similar trends, with emission peaks in 2030 and 2035, respectively. NOx , CO, PM10, PM2.5, BC and OC present overall substantial declines.
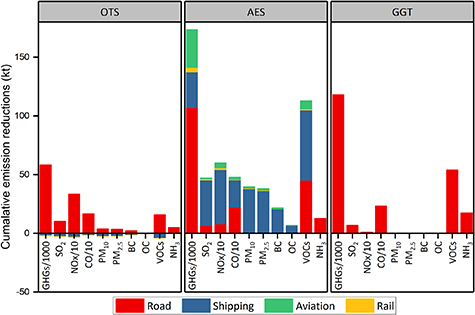
Based on emission pathways under different scenarios, GHG and AP abatement will accumulate under different scenarios compared to BAU scenario during 2020–2060 (figure 5). Overall, there will be significant potential for emission reductions, particularly in the road and shipping sectors.
Figure 5. Cumulative emission reductions for Xiamen's transport sector by sectors compared different scenarios with BAU scenario during 2020–2060.
Download figure:
Standard image High-resolution image
Under OTS scenario, road sector is expected to experience a significant reduction in cumulative emissions, especially for GHG, SO2, NOx , CO, VOCs and NH3, mainly due to 'road to water and rail'. Their cumulative emissions are projected to be 58 Mt, 10 kt, 334 kt, 167 kt, 16 kt and 5 kt, respectively. In contrast, cumulative emissions from the shipping and rail sectors will slightly increase. These results indicate that 'road to water and rail' will have good synergistic effects on GHG and SO2, NOx , CO, VOC and NH3 mitigation in the transport sector. Note that the cumulative emission increments from the shipping and rail sectors will counteract the cumulative emission reductions from road sector for PM10, PM2.5, BC and OC, which is also reflected in figure 4, which shows that their emission pathways under OTS scenario will approach those under BAU scenario.
Compared to OTS scenario, cumulative emission mitigation under the AES scenario will come from multiple sectors. For example, the cumulative GHG emission mitigation will be simultaneously from the road, shipping, aviation and rail sectors, whose cumulative emission reductions will amount to 107 Mt, 31 Mt, 32 Mt and 4 Mt, respectively. Similar to OTS scenario, in addition to GHGs, road sector under the AES scenario will have a significant cumulative mitigation for SO2, NOx , CO, VOCs and NH3, amounting to 7 kt, 80 kt, 222 kt, 45 kt and 13 kt, respectively, which will be attributed to road mitigation measures, such as strengthening transport electrification, improving the energy efficiency standards for fuel vehicles and popularizing clean energy and new energy vehicles. At the same time, for SO2, NOx , CO, PM10, PM2.5, BC, OC and VOCs, the shipping sector will be a large contributor, with cumulative emission reductions of 39 kt, 460 kt, 230 kt, 37 kt, 35 kt, 20 kt and 6 kt, 60 kt, respectively, which will be driven by promoting clean vessels and improving the energy efficiency standards for fuel vessels. Due to the promotion of sustainable aviation fuel, the cumulative emission reductions from the aviation sector will affect GHGs, NOx , CO and VOCs, with decreases in NOx , CO and VOCs will be 43 kt, 240 kt and 7 kt, respectively.
For GGT scenario, cumulative emission mitigation will come only from road sector, and GHG, SO2, CO, VOCs and NH3 will be significant, with reductions of 118 Mt, 7 kt, 91 kt, 233 kt, 54 kt and 17 kt, respectively, which will also be evident in their emission pathways under GGT scenario, which differ widely from those under BAU scenario (figure 4).
4. Discussion and implications
The mitigation synergy between GHG and AP emissions in Xiamen's transport sector during 2013–2060 is presented above, along with the emerging answers to three core research questions mentioned in the introduction.
GHGs share emission sources with APs to different extents. Previous studies have found that the road sector is a highly coordinated source of GHG and AP emissions in the transport sector, especially for CO, VOCs, NOX and PM (He and Chen 2013, Jiao et al 2020). Similarly, road sector is a major common contributor to GHGs and APs in our study (figure 2). However, previous research scarcely further subdivides sectors for common emissions. Given the precise co-controls for GHG and AP emissions, elaborate sector categories are established in table 1. With the estimation of GHG and AP emissions during 2013–2020, several key findings are revealed. First, light-duty vehicles are the largest contributor to GHGs and predominate in terms of CO, VOC and NH3 emissions. Second, river boat emissions make important contributions to GHGs and APs except for NH3. Finally, for GHGs and all nine APs, bus and heavy-duty truck emissions cannot be ignored. These results suggest that more strengthened co-control measures are required, especially for light-duty vehicles, river boats, buses and heavy-duty trucks.
The degree of mitigation synergy of GHG and AP emissions is evaluated during 2013–2020. Since 2013, China has targeted air quality improvement through a series of clean air measures, and many cities, including Xiamen, have made great efforts to reduce AP emissions (table S2, Shu et al 2022). Due to the restricted capacity of end-of-pipe controls, these efforts eventually shift their attention to source treatments in Chinese cities (Xing et al 2020). For instance, GGT and AES greatly abated GHGs and APs from Xiamen's transport sector during 2013–2020, and GGT was the most effective co-control, especially for CO, NOX , VOCs and GHGs, followed by AES, which mostly affected PM. Such abatement mostly originated in road sector (figure 3). Furthermore, the co-effects between GHGs and APs are compared under four effective scenarios, and OTS and ERT have a greater degree of reduction, mostly for APs, except for CO and VOCs. However, GGT and AES are more effective in GHG abatement compared to most APs (table 3). These results imply that the co-controls are designed for different environmental problems. In Xiamen, corresponding measures under GGT and AES scenarios should be recommended because O3 and PM2.5 pollution receive attention (BEEXM 2022).
The emission pathways and mitigation potential are predicted during 2021–2060. Compared to BAU scenario, the emission pathways under OTS, AES and GGT scenarios will experience significant decreases, especially for GHGs, SO2, CO, VOCs and NH3. Meanwhile, the peak emissions of GHGs, SO2, CO, VOCs and NH3 under different scenarios will occur earlier than those under BAU scenario (figure 4). Additionally, there is considerable synergistic mitigation potential for GHGs and APs, especially for the road and shipping sectors under the AES scenario. For the AES scenario, there are two pivotal revelations: the shipping sector is the unique sector that reduces PM10, PM2.5, BC and OC emissions, and aviation sector is the vital contributor that co-reduces NOx , CO, VOCs and GHGs. Under OTS and GGT scenarios, there is substantial synergistic mitigation potential in road sector for SO2, CO, VOC, NH3 and GHG emissions (figure 5). Moreover, in contrast to the historical emission reductions under scenarios, there appears to be greater potential for mitigation synergy under the AES scenario, which involves large mitigation across all sub-sectors. Hence, AES constitutes a critical direction for prospective GHG and AP mitigation synergy. This aligns well with Chinese commitment that recognizes AES as the important means to achieve GHG reductions and fulfill the 'carbon peaking and neutrality' goals. These findings also serve as a crucial guide for mitigation synergy in the transport sector. For example, prioritizing the mitigation synergy of GHG and PM can inform policy decisions related to shipping sector, where the implementation of AES measures will prove effective.
Taken together, these results answer the three core research questions, suggesting that mitigation synergy for GHG and APs is vital in Xiamen's transport sector for air quality improvement and GHG mitigation.
5. Conclusion
This study attempts to clarify mitigation synergy for GHGs and APs in urban transport sector. Our results show evidence that GHGs and APs share common sources to different extents and more strengthened co-control measures are required in Xiamen's transport sector, particular in energy structure adjustment. It not only develops solid data for mitigation synergy for the local transport sector but also provides a reference for many cities in developing countries to co-reduce GHGs and APs.
Acknowledgments
This study is jointly supported by the National Key R&D Program of China (2022YFF1301204) and Institute of Urban Environment, Chinese Academy of Sciences 'Select the candidates to undertake key research projects' (IUE-JBGS-202209).
Data availability statements
All data that support the findings of this study are included within the article (and any supplementary files).
Author contribution
Y B analysed data and wrote the manuscript. J L proposed suggestion for the revision of the manuscript. H H and S L guided the use of the LEAP model. H L offered help with drawing. X C provided data support.
Conflict of interest
There is no conflict of interest.
Supplementary data (0.8 MB PDF)