

Abstract
The plasma potential at a typical substrate position is studied during the positive pulse of a bipolar high-power impulse magnetron sputtering (bipolar HiPIMS) discharge with a Cu target. The goal of the study is to identify suitable conditions for achieving ion acceleration independent on substrate grounding. We find that the time-evolution of the plasma potential during the positive pulse can be separated into several distinct phases, which are highly dependent on the discharge conditions. This includes exploring the influence of the working gas pressure (0.3–2 Pa), HiPIMS peak current (10–70 A corresponding to 0.5–3.5 A cm−2), HiPIMS pulse length (5–60 μs) and the amplitude of the positive voltage U+ applied during the positive pulse (0–150 V). At low enough pressure, high enough HiPIMS peak current and long enough HiPIMS pulse length, the plasma potential at a typical substrate position is seen to be close to 0 V for a certain time interval (denoted phase B) during the positive pulse. At the same time, spatial mapping of the plasma potential inside the magnetic trap region revealed an elevated value of the plasma potential during phase B. These two plasma potential characteristics are identified as suitable for achieving ion acceleration in the target region. Moreover, by investigating the target current and ion saturation current at the chamber walls, we describe a simple theory linking the value of the plasma potential profile to the ratio of the available target electron current and ion saturation current at the wall.
Export citation and abstract BibTeX RIS

Original content from this work may be used under the terms of the Creative Commons Attribution 4.0 licence. Any further distribution of this work must maintain attribution to the author(s) and the title of the work, journal citation and DOI.
1. Introduction
High-power impulse magnetron sputtering (HiPIMS) is an ionized physical vapor deposition technique, which has proven to provide coatings of enhanced quality, as compared to other traditional sputtering techniques, for various materials [1–3]. The increased film quality is often ascribed to a high ionized fraction of the sputtered vapor generated during the HiPIMS discharge. It has been demonstrated that the energy of the ions impinging onto the substrate/growing film has a strong impact on the film properties [4]. The energy distribution of the ion flux towards the substrate ion energy distribution function (IEDF) in a HiPIMS discharge depends on many factors [5], but typically a significant fraction of singly charged ions has a kinetic energy in the range 0–20 eV [6], which is not high enough to stimulate desired surface atomic displacements [7, 8].
The energy of the bombarding ions can be increased by accelerating the ions in the sheath in front of the film surface given as  , where ΔEacc is the kinetic energy gain, Up,subst. is plasma potential at the substrate sheath edge, Us is the potential at the substrate/film surface and q is the ion charge. Ion acceleration is commonly achieved by applying a negative substrate bias to lower Us. For growth of dielectric films, or when using dielectric substrates, it is, however, more difficult to achieve ion acceleration, since the positive charge collected on the film surface during (positive) ion bombardment leads to increase of Us towards a floating potential Ufl resulting in decreasing ΔEacc. The difference between Up,subst. and Ufl is typically a few times the electron temperature, which, for singly charged ions, gives ΔEacc = 1–15 eV. Applying an alternating (ac) substrate bias voltage instead of continuous (dc) substrate bias makes it possible to alternately discharge the positively charged substrate/film surface by attracting electrons from the plasma discharge. The efficiency of the ac bias method depends on the frequency of the ac voltage, the substrate ion current density and the capacitance of the insulating film or substrate (i.e. thickness and dielectric constant). Typically, a radio frequency (rf) bias is required, connected to the substrate holder through a decoupling capacitor and utilizing the self-bias effect. Unfortunately, it turns out that rf biasing during HiPIMS is not reliable, since the electron current cannot match the ion currents from the HiPIMS pulse and it is therefore virtually impossible to maintain a controlled self-biasing, and consequently the desired ion acceleration, during the HiPIMS discharge [9]. Furthermore, the typically used rf frequency of 13.56 MHz might not be high enough for ion acceleration by a well-defined accelerating voltage on insulating substrates thicker than roughly 1 mm (for the details concerning this estimation see the supplementary information S1 (https://stacks.iop.org/PSST/31/025007/mmedia)).
Bipolar HiPIMS represents a different approach to increase the energy of the bombarding ions. A rectangular positive pulse of voltage U+ is applied to the target after the negative HiPIMS pulse, as was already suggested by Konstantinidis et al [10] and implemented by Nakano et al [11]. In this pulsing scheme ions generated during the negative voltage pulse are accelerated towards the substrate during the positive voltage pulse [12, 13]. Mass-spectrometry studies [13–23] have shown that the ion energy gain is proportional to the applied positive voltage U+ and the high-energy peak in the recorded IEDFs is roughly at an energy of ΔEacc = qU+. Some studies [15, 19–21, 23] also observed additional distinct peak/peaks in the recorded IEDFs at lower energies. The effects resulting from the energy-enhanced ion bombardment during bipolar HiPIMS have so far been reported for deposition ofCu [18, 24], Ti [12], TiN [14], DLC [17, 25, 26] and CrAlN films [27]. In addition, a study of the effect of U+ on the properties of CrN films with grounded and floating substrates was carried out by Batková et al [28]. A clear effect of the energy-enhanced ion bombardment was observed only in the case of a grounded substrate for ![${U}_{+}\in \left[0,400\right]$](https://content.cld.iop.org/journals/0963-0252/31/2/025007/revision2/psstac4b65ieqn2.gif) V, while for a floating substrate no evidence of energetic ion bombardment was seen. Similar observations were reported by Viloan et al [29] and Du et al [30]. In [30], however, the effect of the energy-enhanced ion bombardment was observed during growth of a 1 μm thick (Al, Cr)2O3 insulating film on a conducting and grounded substrate, while no effect was observed for deposition on a 0.5 mm thick insulating sapphire substrate. In all the three works [28–30], the floating potential at the substrate position Ufl during the positive pulse reached the value close to the applied positive voltage, i.e. Ufl ≈ U+. As discussed in [30], in such a case for a floating film surface one can expect significant ion acceleration to occur only in the substrate sheath, and only for a limited time interval during the positive pulse given by the charging time of the film surface.
V, while for a floating substrate no evidence of energetic ion bombardment was seen. Similar observations were reported by Viloan et al [29] and Du et al [30]. In [30], however, the effect of the energy-enhanced ion bombardment was observed during growth of a 1 μm thick (Al, Cr)2O3 insulating film on a conducting and grounded substrate, while no effect was observed for deposition on a 0.5 mm thick insulating sapphire substrate. In all the three works [28–30], the floating potential at the substrate position Ufl during the positive pulse reached the value close to the applied positive voltage, i.e. Ufl ≈ U+. As discussed in [30], in such a case for a floating film surface one can expect significant ion acceleration to occur only in the substrate sheath, and only for a limited time interval during the positive pulse given by the charging time of the film surface.
For an insulating substrate, the charging time can easily become very short. For example, a 0.5 mm thick insulating substrate with a dielectric constant of 10, bombarded by ions of current density of 10 mA cm−2, will charge to 100 V in less than 0.2 μs. To accelerate ions even for cases when the charging time is small, a plasma potential drop between the magnetron target and the substrate during the positive voltage pulse is needed. At the same time, this plasma potential drop should be independent of substrate grounding. An essential condition to achieve such a situation can be characterized by the plasma potential at substrate position Up,subst. being significantly lower than the positive potential of the target U+. This seems to be rather challenging and several studies [19, 28–31] have instead found that the floating potential Ufl (and possibly also the plasma potential Up,subst.) at substrate position closely follows the target potential during the positive pulse. There are, however, some promising indications for attaining the desired conditions. First, at larger distances from a target a significantly slower rise of the plasma potential compared to the target voltage rising edge slope in the beginning of the positive pulse was reported in [18, 32]. Second, a significant decrease of the floating potential of around 20 V below the positive target potential was observed in [19] at a substrate position after approx. 40 μs after the onset of the positive pulse. Such a limited potential drop, however, is of little importance for ion acceleration, as there seems to be no way of increasing it by an increase of U+ [19].
In the present work, a systematical study of the plasma potential at a typical substrate position is presented. This is done with the intention to identify favorable process conditions, potentially leading to ion acceleration inside the plasma independent of substrate grounding. A broad range of experimental conditions in bipolar HiPIMS including varying working gas pressure, peak discharge current, negative pulse length, and positive pulse voltage, has been investigated to identify results of general applicability and ultimately to optimize the process parameters. Moreover, a spatial distribution of the plasma potential is measured for one selected case. The observed features have led us to focus also on a detailed investigation of the target current evolution during the positive pulse and its relation to the plasma potential behavior.
The paper is organized as follows. The experimental details are given in section 2, and the measured data in section 3. Section 4 contains a discussion of the physics behind the observed trends, supported by additional measured data. The summary and conclusions are given in section 5.
2. Experimental details
2.1. Deposition system
Measurements were performed in a cylindrical stainless-steel vacuum chamber, see figure 1(a), (42 cm in diameter, height of 30 cm, i.e. a surface area of approx. 6800 cm2 and a volume of approx. 42 liters) pumped by a turbomolecular pump down to a base pressure of 3 × 10⁻⁴ Pa. During operation, 30 sccm of Ar (99.997%) gas was injected into the chamber and the working pressure was adjusted by a gate valve located between the chamber and the turbomolecular pump. All the measurements, except for those described in section 2.4 and discussed in section 3.2, were obtained with a planar circular magnetron (TORUS Circular, Kurt J. Lesker Company) with a two-inch 3 mm thick Cu (99.99%) target mounted in the top lid of the chamber with the magnetron axis coinciding with the central axis of the chamber. Prior to the experiments, the magnetic field components (Br, Bz) were mapped in a half-plane using a Gaussmeter probe (420 Gaussmeter, LakeShore), see figure S2(a) in the supplementary material. The Br component above the racetrack at the target  = (0, 9) mm was approx. 100 mT. The magnetic field was characterized as unbalanced type-2 with a null point located at z = 14 mm from the target. For mounting of the magnetron, an electrically insulated vacuum feedthrough was used, so that the magnetron body (together with the anode shield) was not conductively connected to the chamber. The magnetron body (together with the anode shield) was connected to the grounded vacuum chamber via a copper strip (see the violet wire in figure 1(a)), which made it possible to measure the corresponding current Ich. The cathode was connected through a coaxial cable to a HiPIMS pulsing unit (Bipolar HiPSTER, Ionautics AB) fed by two dc power supplies, one that delivered a negative potential U− for initiating classical HiPIMS pulses and a second one used to apply a positive potential U+. The outer and inner conductors of the coaxial cable were separated at approximately mid-length to enable measuring the target current It (inner conductor) and the returning current Icr (outer conductor). The currents It, Icr and Ich were sensed by Chavin Arnoux C160 current clamps. The current through the anode shield Ias could not be directly measured but it was obtained numerically as Ias = Icr − Ich, see figure 1(a). The target voltage Ut was sensed at the same place as the target current by means of a High Voltage Differential Probe (Testec) (70 MHz) with an attenuation ratio of 1:100. All the signals were recorded on a digital oscilloscope (PicoScope 4444, Pico Technology) in an averaging mode averaging over 100 consecutive pulse periods. A stainless-steel substrate table (diameter of 5 cm) was positioned in the middle of the chamber with a target-to-substrate-table distance of 11 cm. During the experiments the substrate table (together with the supporting rod) was floating.
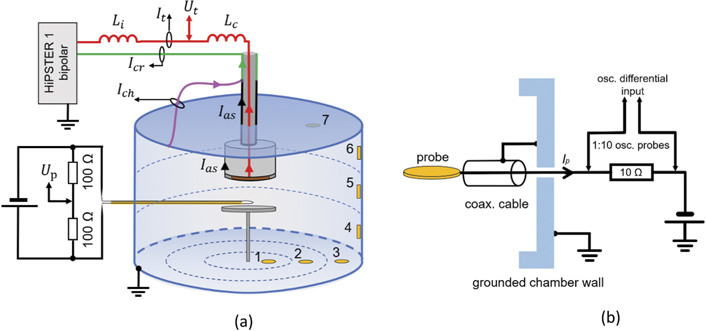
Figure 1. (a) Simplified schematics of the vacuum chamber showing the positions of seven flat probes, emissive probe with the circuitry, substrate holder, and two-inch magnetron. The blue dashed lines depict roughly the wall regions used to estimate the wall current from the given probe current measurement. The electrical circuitry of the magnetron defines the target current It (red), cable return current Icr (green), chamber-to-magnetron-rod current Ich (pink) and anode shield current Ias (black). The It, Ich and Icr currents have been measured by means of current probes connected to an oscilloscope as it is schematically depicted (connection to oscilloscope are symbolized by arrows). The directions of current arrows symbolize the convention for positive current. The inductance Lc represents intrinsic inductance along the coaxial cable connecting the HiPSTER bipolar power supply to the magnetron and Li represents inductance of part of the connecting cable together with the internal output inductance of the HiPSTER bipolar power supply. (b) Scheme of the electrical circuitry used for measurements of the wall-probe current. Two passive oscilloscopic probes (1:10), which are connected to a differential input of an oscilloscope, are sensing the voltage before and after a 10 Ω resistor.
Download figure:
Standard image High-resolution imageFor the study of the phenomena occurring during the positive pulse, we have chosen a positive pulse length of τ+ = 400 μs. As discussed later in section 4.5, the minimum delay time τ± between the negative and positive pulse is limited by the intrinsic properties of the bipolar HiPIMS unit and depends on discharge conditions. During measurements we aimed at achieving the lowest possible delay time τ±. The positive voltage applied to the target U+ was typically set to 100 V. However, for some discharge conditions, the target voltage Ut at the beginning of the positive pulse was lower, as the positive voltage power supply was not able to deliver the high currents needed. Typically, the pulsing frequency was maintained constant at around 50 Hz. Our measurements, however, indicate that changes of the frequency and hence average discharge power, are not affecting the presented results obtained during the positive pulse as long as the shape of the HiPIMS discharge (negative pulse) current waveform (ID,peak and τ−,eff) is kept unchanged. The HiPIMS discharge current waveform is here quantified by ID,peak, and by the full width at half maximum denoted as τ−,eff, as discussed later in section 3.1.
2.2. Wall-probe current measurements
Seven circular flat probes (diameter of 30 mm) were positioned at various places along the chamber walls, see figure 1(a). The probes were constructed from aluminum foil, insulated from the chamber walls by Kapton tape, and stuck to the chamber wall by using a copper two-side-adhesive tape. The probes were connected to the electrical feedthroughs by coaxial cables with the shields connected to ground, see figure 1(b). During measurement of the current through a given probe, the probe was biased at −40 V and the other probes were grounded. As the probe was biased at −40 V and the plasma potential was higher than 0 V during the positive pulse, the measured current corresponds to the ion saturation current. Two passive 1:10 oscilloscopic probes (TPP0101, Tektronix) connected to a differential input of the oscilloscope were used to measure the voltage drop over a 10 Ω resistor, from which the probe ion saturation current  for a particular probe numbered by n was estimated. Due to a slight mismatch of the resistances of the two passive probes, a significant dc offset was present in the signal (linearly related to the probe biasing voltage). During the data analysis the offset was subtracted by assuming that the probe current before the start of the negative pulse is negligible. By dividing
  by the probe area, the ion saturation current density
  was obtained. In order to approximately determine the total chamber ion saturation current
  , cylindrical symmetry of the chamber was assumed. For each probe, a specific region of the chamber wall with an area of
  was selected, see figure 1(a), and the total ion saturation current through this area
  was estimated as
  . Only one probe (No. 7) was used on the upper lid of the cylindrical chamber. The total chamber wall ion saturation current
  was estimated by summing all the seven
  currents and multiplying the sum by a constant factor of 0.75. The factor of 0.75 was found to fit the
  data to the −It data in the 0.3 Pa case shown in figure 10. The factor can be justified by the fact that the extrapolation of the probe currents
  to the total chamber wall current
  is only approximative and because the geometry of the chamber deviates from the cylinder approximation due to the presence of various vacuum ports (not shown in figure 1(a)). Moreover, the same factor of 0.75 was used also for the other discharge conditions studied and resulted in a very good correspondence with the target current data, see figure 10, which further justifies this approach of estimating
  .
.
2.3. Emissive probe
For the measurement of the plasma potential an emissive probe was placed at the magnetron axis at a distance of z = 10 cm from the magnetron (1 cm above the substrate holder). The emissive probe was constructed using a tungsten wire loop (W + 1% Th wire of 150 μm in diameter), protruding 4 mm out of a double-bore ceramic tube. The floating potential of the emissive probe was measured by a passive oscilloscopic probe (1:10, 10 MΩ, 12 pF, TPP0101, Tektronix) between two 100 Ω resistors connected in parallel to the wire loop, see figure 1(a). The wire loop was continuously ohmically heated by supplying a heating current Ih of 3.5 A by means of an in-house-built floating dc power supply using the push-pull topology, where the capacitance of the floating part to the grounded part was less than 40 pF. A reasonably small capacitance of the probe to ground is needed in order to achieve a small RC time constant of the probe charging [33]. The RC constant of the probe is also decreasing with increasing probe collecting area, plasma density and/or probe electron emission current when the probe is heated. The increase of the electron emission current from the emissive probe when increasing the heating current Ih is significantly decreasing the time needed for the probe to charge up to more positive voltages, which is shown in the supplementary material figure S3. The data in figure S3 show that a saturation of the plasma potential signal rise time in the beginning of the positive pulse was achieved even at low plasma density conditions, which implies that the influence of probe charging on the plasma potential measurement during the positive pulse can be neglected.
2.4. Spatial map of plasma potential
A spatial map of the plasma potential discussed in section 3.2 was measured for a three-inch circular magnetron (Gencoa) with a 5 mm thick Cu (99.99%) target, which was mounted from the side of the same cylindrical vacuum chamber so that the axis of the magnetron was perpendicular to the cylindrical chamber axis and at the same time perpendicular to the he emissive probe holder, see the schematics in figure 2. The magnetic field lines of the magnetron are depicted in figure S2(b) in the supplementary information. It is an unbalanced type-2 magnetic configuration, with a null point located at z = 44 mm from the target and a radial component of the magnetic field Br = 70 mT at the target above the race track  = (0, 23) mm. In this configuration, the substrate table, the wall flat probes, and the two-inch magnetron were not mounted. The radial position was adjusted by radial movement of the emissive probe, while the axial position was changed by axial movement of the magnetron. A separate large flat floating probe (diameter of 5 cm) was positioned more than 20 cm from the target, outside of the magnetic trap region, and was used to measure the floating potential in order to evaluate possible influence of the emissive probe on the discharge, when located inside the magnetic trap. The waveforms during the spatial mapping were not averaged than in the other measurements, and a different oscilloscope was used (Tektronix TDS 520 C).
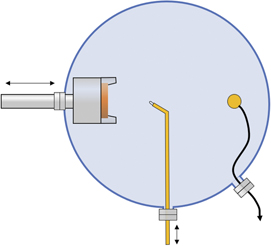
Figure 2. Top-view schematics of the experimental chamber during the plasma potential mapping using the three-inch magnetron.
Download figure:
Standard image High-resolution image3. Results
3.1. Temporal evolution of plasma potential at substrate position
In this section we describe the evolution of the plasma potential measured at a typical position of a substrate holder, specifically 10 cm from the target at the magnetron axis. As can be seen from the magnetic field map of the two-inch magnetron in figure S2(a), the emissive probe was positioned in the plasma bulk region well outside of the magnetic trap. The temporal evolution of the plasma potential during the positive pulse is observed to be highly dynamic and dependent on the discharge conditions. We have identified three process parameters that are significantly influencing the plasma potential evolution during the positive pulse: (i) working gas pressure p, (ii) peak HiPIMS discharge current ID,peak and (iii) length of the HiPIMS discharge current pulse τ−,eff. These individual effects are demonstrated in figures 4–6, respectively. The effects of changing the positive pulse voltage U+ are less pronounced and are shown in figure 7. In the text we use the symbol t to denote a time instant, while τ denotes a length of a time interval.
Let us first look at the general temporal evolution of the plasma potential before addressing the individual effects of the investigated external process parameters. Figure 3 shows the recorded plasma potential Up,subst.(t), target current It(t) and target potential Ut(t) waveforms using a working gas pressure of 0.3 Pa. The target current It during the negative pulse sharply increases, attains a peak value ID,peak, and till the end of the negative pulse stays at a value close to ID,peak. This close-to-rectangular shape of the target current during negative pulse allows us to approximately characterize this discharge current regime by two values—the peak HiPIMS discharge current ID,peak and the length of the HiPIMS discharge current pulse τ−,eff, see figure 3(a). Note, that τ−,eff is smaller than the set negative pulse length τ−. The difference is mainly caused by the formative time lag, which is the time needed for the primary Townsend ionization avalanche to occur and during which only negligible current flows to the target [34]. In the present example ID,peak = 48 A, τ−,eff = 55 μs, and τ− = 105 μs. At the onset of the discharge current rise, the plasma potential attains values of around −25 V, however, then increases to a value close to 0 V. This observation agrees qualitatively with other works studying the plasma potential in HiPIMS in more detail [35]. The end of the 105 μs long negative pulse corresponds to time 0 μs in the figures. Figure 3(b) shows a close-up at the transition from the negative pulse to the positive pulse. All the discharges studied show similar behavior at this transition. There is a delay time τ± between the end of the negative pulse and onset of the positive pulse of around 6 μs, which, at the given conditions, was the lowest possible delay given the bipolar HiPIMS power supply used. During this delay time the target current decreases sharply, while the measured target voltage reverses polarity, peaks at around 60 V and stabilizes at around 15 V. We attribute this measured positive voltage during the delay interval to an artefact caused by a voltage induced along the coaxial cable between the target and the voltage measuring spot (see the inductance Lc shown schematically in figure 1(a)) due to the fast target current decrease. Additional target potential measurements (not shown) using an external wire attached directly to the target, revealed that the target voltage is in fact close to zero in the delay time interval. The plasma potential measured during the delay time interval is also close to zero, as seen in figure 3(b).
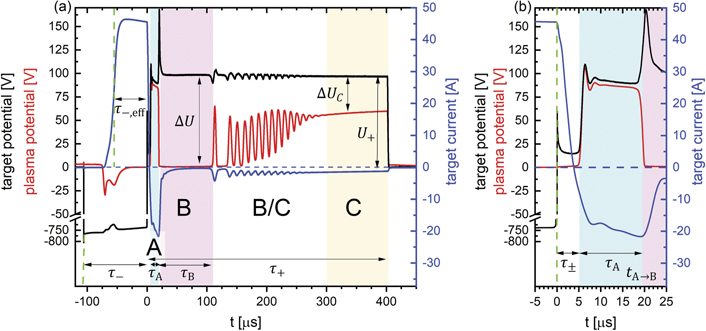
Figure 3. (a) The target potential Ut (black), target current It (blue) and plasma potential Up,subst. (red) measured by an emissive probe (10 cm from the target) for p = 0.3 Pa, ID,peak = 48 A, τ−,eff = 55 μs, U+ = 100 V. The regions of different background color delimit the different phases A, B, B/C and C. (b) Shows a close-up at the transition between the negative and positive pulse. The different phases are highlighted by using different background colors.
Download figure:
Standard image High-resolution imageFor the typical discharge shown in figure 3(a) we can clearly distinguish four different phases during the positive pulse which are labelled A, B, B/C, and C. After the delay time τ±, the target potential Ut rapidly rises and attains a value close to the applied voltage U+ = 100 V. A short overshoot of Ut to around 115 V is observed during the first few μs, as seen in figure 3(b). We also see that the plasma potential very closely follows the target voltage in the beginning of the positive pulse with no detectable delay between the target voltage and plasma potential rise. The fact that the plasma potential closely follows the target potential in the beginning of the positive pulse applies to all the other discharge conditions studied. We denote this early transient phase A with a time duration of τA. The difference between the measured target and plasma potentials is not more than 6 V during phase A. This difference is likely an artefact of the measurement. Because of the high-density HiPIMS plasma, it is possible that the emissive probe was not emitting enough, i.e. not operating in the potential saturation region, and hence the measured plasma potential can be slightly underestimated. This measurement error would be of the order comparable to the electron temperature. Besides these features in the potential measurements, a large negative target current is observed in figure 3, attaining a peak value of ItA = −20 A, during phase A.
Beyond phase A, the evolution of the plasma potential largely depends on the discharge conditions. The onset of phase B is marked by a sharp drop of the plasma potential, which attains a value close to 0 V. The time instant of the transition from phase A to phase B we denote as tA→B = τ± + τA, see figure 3(b). The plasma potential remains fairly constant around 0 V throughout the entire phase B. At the transition from phase A to phase B the target current rapidly decreases towards 0 A (at the end of phase B it attains −0.3 A). The high target potential of (∼170 V) in the beginning of phase B is likely related to a voltage induced by the sharp decrease of the target current and caused by the inductance Li, see figure 1(a). Additional direct target potential measurements taking into account induced voltage on Li + Lc (not shown) confirmed that this target potential peak is not an artefact, but a real voltage present on the target.
After phase B the plasma potential seems to be highly unstable and exhibits high-amplitude oscillations, in this case with a period of around 12 μs. This phase is labeled B/C, as it resembles several transition attempts from phase B to a following stable phase C, in which the plasma potential rises to a level of around 50 to 65 V, well below the applied target potential of 100 V. It should be noted that the waveforms shown, which have been averaged over 100 consecutive discharge pulses (discharge periods), correspond well to non-averaged single-shot discharge waveforms. This fact suggests that the observed oscillations are of non-stochastic origin. The plasma potential oscillations during phase B/C correlate with oscillations of the target current. These target current oscillations are likely inducing the observed small target potential oscillations as well, as seen in the recorded target potential waveform. The transition phase B/C is followed by phase C during which the plasma potential stabilizes at close to a constant potential of around 57 V and a negative current of roughly −1.5 A is flowing through the target with a decreasing magnitude. At the end of the positive pulse, the target is left floating and discharges rapidly to 0 V, closely followed by the plasma potential.
In the following subsections we will investigate some trends with the working gas pressure, the HiPIMS peak current, the HiPIMS pulse length, and the amplitude of the positive pulse. The interpretation of that quite extensive data becomes simplified by keeping in mind the purpose of this work: to find experimental conditions for ion acceleration in the plasma volume between the target and the substrate. An upper limit to such acceleration is the potential difference between the target and the substrate position which we denote as ΔU = (Ut − Up,subst.). This quantity is given by the difference between the black and the red curves in the following graphs, which is what to keep track of from the aspect of ion acceleration. For the case study in figure 3, we can see that ΔU is below 6 V during phase A (only a marginal ion acceleration is possible) and close to the applied 100 V in phase B (possibly full acceleration). Then ΔU oscillates between 50 and 100 V in phase B/C, and finally approaches around 35 V towards the end of phase C. However, it is important to keep in mind that ΔU only gives an upper limit to the ion acceleration. The ions positions at the time when the reversed pulse is applied, and their times of crossing from the magnetic trap to the substrate, both come into play. We will return to these issues in section 4.5.
3.1.1. Variations with working gas pressure
Figure 4 shows the recorded plasma potential, target current and target potential waveforms for four different working gas pressures. The shape of the target current during the negative pulse (i.e. ID,peak and τ−,eff) was maintained almost unchanged. Due to the decrease of the formative time lag with increasing working gas pressure, slight adjustments of the negative pulse voltage and changes of the negative pulse length τ− were needed. The observed changes in plasma potential during the positive pulse can therefore be attributed predominantly to the different working gas pressures investigated. Due to the intrinsic properties of the bipolar HiPSTER power supply (discussed in section 4.5), the delay time τ± was only slightly decreasing with the increase of the pressure; τ± = 5.6 μs for 0.3 Pa and τ± = 3.4 μs for 1.9 Pa.
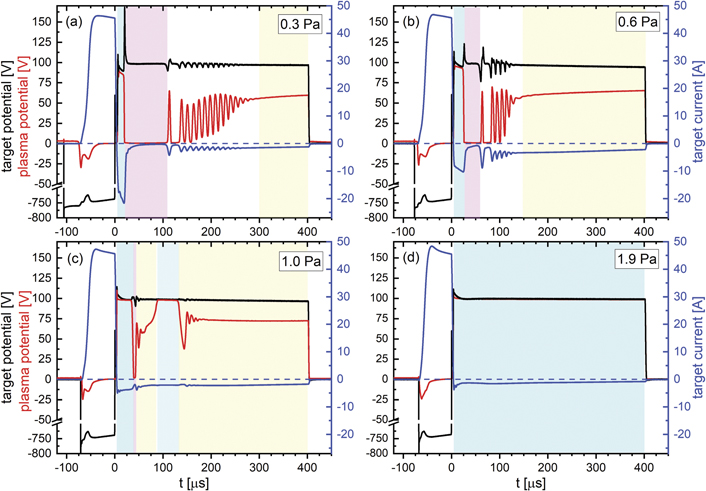
Figure 4. The target potential Ut (black), target current It (blue) and plasma potential Up,subst. (red) measured by an emissive probe (10 cm from the target) for different discharge conditions varying the working gas pressure. The shape of the target current during the negative pulse was held almost unchanged by varying the negative pulse length and by small changes in the negative pulse voltage. The different phases are highlighted by using different background colors.
Download figure:
Standard image High-resolution imageA clear trend in the length of the different phases during the positive pulse can be observed as the working gas pressure is altered. It follows from figure 4, that by increasing the pressure, phase A lengthens which leads to an increase of the phase A to phase B transition time tA→B from 19 μs at 0.3 Pa to 37 μs at 1 Pa. At the same time, the transition from phase B to phases B/C and C occurs sooner for higher pressure, which effectively decreases τB from 90 μs at 0.3 Pa to 7 μs at 1 Pa. For working gas pressures >1 Pa, phase B disappears altogether and the time of transition from phase A to phase C, tA→C, occurs later with increasing pressure (see the 1.6 Pa case shown in the supplementary information in figure S4). For 1.9 Pa, phase A lasts over the whole positive pulse duration.
The target current evolution during the positive pulse correlates with the plasma potential evolution as described previously, i.e. during phase B, the target current value is much smaller than during phases A or C. The magnitude of the target current during the positive pulse decreases with increasing working gas pressure. During phase A the target current attains a value of ItA = −20 A for 0.3 Pa, while it reaches only ItA = −3.6 A for 1.9 Pa.
3.1.2. Variations with HiPIMS target current
We also observed significant changes in the behavior of the plasma potential and target current during the positive pulse when changing ID,peak or τ−,eff of the negative HiPIMS. The results of these changes, keeping the pressure constant at 0.3 Pa, can be seen in figures 5 and 6, respectively. As can be seen from figure 5(a), the increase in ID,peak leads to an increase of the negative target current during phase A, ItA. A closer look at the data shows an increase of the negative target current during phases B/C and C and a slight increase during phase B. For ID,peak of 8 A, the maximum current during phase A, ItA, is around −0.5 A. On the other hand, for ID,peak of 70 A, ItA attains −70 A. Due to this large current drawn during phase A and limitations of the positive voltage power supply (dc driving unit), the applied positive voltage during most part of phase A is lower than the desired 100 V for high ID,peak (for ID,peak of 70 A the target voltage is around 45 V for most part of phase A). That is also reflected in lower plasma potential values during most part of phase A as shown in figure 5(b). The set target potential of 100 V was quickly recovered at the beginning of phase B. Due to the intrinsic properties of the bipolar HiPIMS power supply (discussed in section 4.5), the delay time τ± was increasing with the increase of ID,peak; τ± = 9.5 μs for ID,peak of 70 A and τ± = 0.8 μs for ID,peak of 8 A.
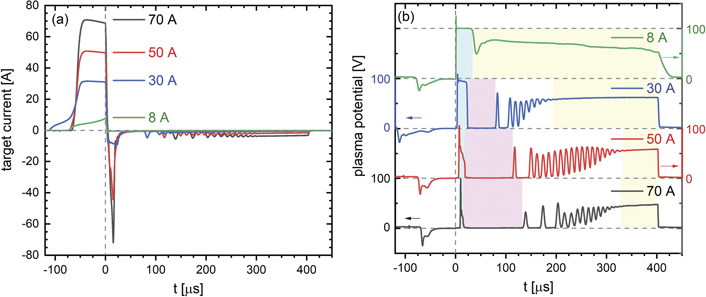
Figure 5. Target current It (a) and plasma potential Up,subst. (b) measured by an emissive probe (10 cm from the target) for different discharge conditions showing the effect of the HiPIMS peak current ID,peak on the plasma potential behavior. The working gas pressure was 0.3 Pa. The applied target voltage during the positive pulse was U+ = 100 V, which, however, significantly dropped during phase A for ID,peak = 70 A and 50 A. The different phases are highlighted by using different background colors.
Download figure:
Standard image High-resolution image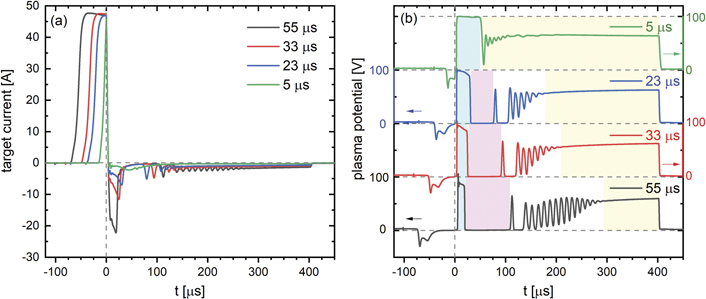
Figure 6. Target current It (a) and plasma potential Up,subst. (b) measured by an emissive probe (10 cm from the target) for different discharge conditions showing the effect of the HiPIMS target current length τ−,eff on the plasma potential behavior. The working gas pressure was 0.3 Pa and the HiPIMS peak current ID,peak = 48 A. The applied target voltage during the positive pulse was U+ = 100 V. The different phases are highlighted by using different background colors.
Download figure:
Standard image High-resolution imageFrom the plasma potential waveforms in figure 5(b) we see that increasing ID,peak has qualitatively similar desirable effects as decreasing the working gas pressure, i.e. shortening τA and prolonging τB. For the highest ID,peak of 70 A the A/B transition time tA→B = 15 μs and τB = 120 μs. For ID,peak of 30 A, tA→B = 23 μs and τB = 57 μs. For the lowest peak current ID,peak of 8 A, phases B and B/C disappear and phase A transits directly to phase C at tA→C = 35 μs. For the ID,peak = 8 A case, one can also notice, that the plasma potential decay time after the end of the positive pulse is longer, compared to the higher ID,peak cases. That is caused by a slower discharging of the floating target due to a lower plasma density in the low peak current case.
The effect of changing width of the negative discharge current pulse τ−,eff on the positive pulse dynamics was studied while maintaining a constant ID,peak of around 48 A. As is shown in figure 6, the effect is qualitatively similar as decreasing ID,peak. That means when shortening τ−,eff the magnitude of the target current during the positive pulse is decreasing, τA is increasing, and τB is decreasing. For τ−,eff of 5 μs, phase B does not seem to fully develop and the transition from phase A to C, tA→C, occurs at around 50 μs.
3.1.3. Variations with the positive pulse voltage U+
The measurements shown above have been performed with a constant positive voltage U+ of 100 V. Here we study the influence of U+ on the plasma potential evolution during the positive pulse, see figure 7. The measurements were performed at a pressure of 0.3 Pa, a ID,peak of 48 A and a τ−,eff of 55 μs. The delay time τ± was decreasing with increasing U+, which is further discussed in section 4.5. For U+ of 150 V the delay time τ± is 3.6 μs, however, for U+ of 40 V the delay time τ± is 16 μs.
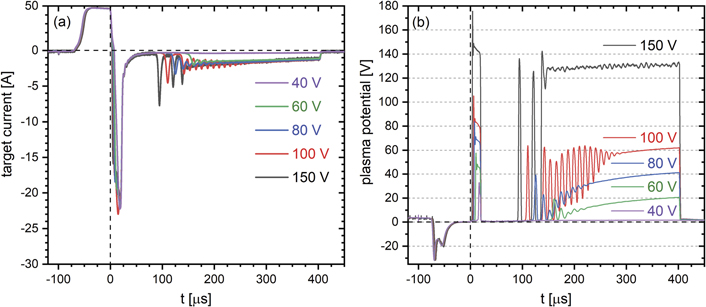
Figure 7. Target current It (a) and plasma potential Up,subst. (b) measured by an emissive probe (10 cm from the target) for different U+. The working gas pressure was 0.3 Pa and ID,peak = 48 A, τ−,eff = 55 μs.
Download figure:
Standard image High-resolution imageThe transition from phase A to phase B occurs almost at the same time, which, seen up close, increases only slightly with higher U+. For U+ of 40 V, tA→B = 19.7 μs, for U+ of 150 V, tA→B = 19.9 μs. We can clearly see phase B for all U+ studied, yet its length, τB, is decreasing when increasing U+. The observed changes in tA→B and τB, we attribute mainly to the increase of U+ as the effect of changing τ± has an opposite effect on the changes of tA→B and τB (see supplementary information S5). In phases B/C and C the plasma potential increases following the increase of U+, however, a voltage difference between the target potential and the plasma potential, ΔUC, is present. For U+ of 150 V, ΔUC = 20 V. For U+ of 100 V, 80 V and 60 V, ΔUC ≈ 40 V at the end of the positive pulse. For U+ of 40 V, phase C cannot be easily distinguished from phase B as the plasma potential is close to 0 V till the end of the positive pulse.
No obvious trend of the target current change with U+ during phase A can be seen. Only a slight rising trend of the target current (in absolute value) with increasing U+ for U+ ⩾ 60 V is seen in close-up (not shown) during phases B and C. During phases B/C and C for U+ of 40 V only very small negative target current flows, around six times smaller than for the larger U+.
In summary, the desired trends of shorter τA and longer τB, which gives a longer time window in the positive pulse for possible ion acceleration, are seen for lower working gas pressure (figure 4), higher HiPIMS pulse discharge current (figure 5), and longer HiPIMS pulse length (figure 6). The amplitude of the negative pulse on the other hand has only a small effect. This is a good sign. It opens the possibility to choose a desired accelerated ion energy, independent of optimizing discharge parameters for a long acceleration time window.
3.2. Spatial distribution of the plasma potential
Mapping of the plasma potential was carried out to gain insight into the spatial variations inside and outside the magnetic trap. A reliable spatial mapping of the plasma potential in the case of the two-inch magnetron proved difficult to perform, since the presence of the emissive probe inside the magnetic trap significantly affected the discharge conditions—the target current during the negative pulse—and hence also the behavior during the positive pulse. The spatial scan of the plasma potential was therefore performed using a three-inch magnetron, where only a minor influence of the emissive probe was observed. As follows from the magnetic field lines map of the three-inch magnetron, the magnetic trap region is substantially larger than for the two-inch magnetron (see supplementary information, figure S2). Besides the emissive probe, another (large flat non-emitting) probe was used to simultaneously record the floating potential outside of the magnetic trap, in order to detect any possible influence of the emissive probe on the discharge. The discharge conditions (p = 0.35 Pa, ID,peak = 238 A, τ−,eff ≈ 130 μs) were selected to observe formation of phases B and C. Figure 8(a) shows a measurement when the emissive probe was positioned far away from the magnetic trap at  (120, 20) mm, i.e. a comparable configuration as investigated in the two-inch magnetron case. The characteristic times derived from figure 8(a) are: τ± = 15 μs, τA = 7 μs, tA→B = 22 μs, τB = 148 μs, tB→C = 170 μs. We see a similar behavior of the plasma potential measured by the emissive probe and of the floating potential measured by the non-emitting probe. The small difference between the two probes during phase C, attaining 15 V at the end of the positive pulse, is likely due to the different location of the probes.

Figure 8. Target potential Ut (black), target current It (blue), plasma potential Up (red) measured by emissive probe and floating potential Ufl (green) measured by a large flat probe obtained during the spatial mapping of the plasma potential with the three-inch magnetron at p = 0.35 Pa. In (a) the emissive probe was positioned at  (120, 20) mm and in (b) at
  (16, 20) mm. The different phases are highlighted by using different background colors.
Download figure:
Standard image High-resolution imageFigure 8(b) shows the situation when the emissive probe was located inside the magnetic trap above the erosion track at position  = (16, 20) mm and the non-emitting flat probe was positioned outside the trap. The emissive probe reveals that the plasma potential inside the magnetic trap is around 50 V during the first 35 μs of phase B, which together with the measurement from the non-emitting flat probe indicates a significant electric field present in the plasma. During phase C, the emissive probe measures a plasma potential close to the target voltage, whereas the non-emitting flat probe shows a lower voltage of around 50 V, leading to ΔUC ≈ 50 V, which also indicates that a significant electric field is present in the plasma during phase C.
Several measurements were performed at different locations of the emissive probe outside and inside of the magnetic trap, from which the spatial profiles of the plasma potential at a given time were reconstructed, see figure 9 (full video can be found in the supplementary material). At the beginning of the positive pulse the plasma potential closely follows the target potential and reaches the applied 100 V throughout the entire mapped region (not shown). At t = 23 μs the plasma potential outside the magnetic trap drops to close to 0 V, corresponding to the beginning of phase B, see figure 9(a). The plasma potential is close to 0 V also inside the magnetic trap along the center axis of the magnetron. On the other hand, the plasma potential is elevated inside the magnetic trap with the highest values recorded above the target racetrack. The plasma potential remains stable at 0 V outside the magnetic trap during the whole phase B, which lasts until t = 170 μs. The potential structure inside the magnetic trap shows a much more dynamic behavior, as seen when comparing figures 9(a)–(c), recorded during phase B. First, an increase of the plasma potential at the axis of the magnetron is observed, see figure 9(b). This is followed by an overall decrease of the plasma potential to 0 V inside the magnetic trap at t ≈ 70 μs to 80 μs, as seen in figure 9(c). During the rest of phase B from around 80 μs to 170 μs some cases of a short spontaneous increase of the plasma potential are observed only at a few localized positions inside (and at the edge) of the magnetic trap (shown only in the video in the supplementary material).

Figure 9. Contour plots of the spatial profile of the plasma potential at four different instants during the positive pulse. The target voltage and target current waveforms are shown in figure 8. The black crosses represent the different locations of the emissive probe.
Download figure:
Standard image High-resolution imageDuring phase C, when the plasma potential outside the magnetic trap is elevated to around 60 V, we clearly observe a stable potential structure resembling a double layer [36] located inside the magnetic trap and protruding slightly out of the magnetic trap along the magnetron axis, see figure 9(d). Above the target racetrack, the plasma potential is close to the full target potential of 100 V. This structure slightly evolves in time, spreading somewhat outside the magnetic trap and lasts until the end of the positive pulse at t = 400 μs.
4. Discussion
Ionization of sputtered species occurs mainly within the magnetic trap, which is commonly referred to as the ionization region (IR) [37]. To achieve effective ion acceleration independent on the substrate grounding, a significant drop of the plasma potential between the target and substrate must be achieved during the positive pulse. The substrate is typically placed at some distance outside the magnetic trap, which we denote as the diffusion region (DR).
During phase A, the plasma potential is close to the applied positive target potential in the whole plasma volume (IR + DR), and therefore, we do not expect ion acceleration in the plasma during this phase. Note that ions can still be accelerated during phase A in a substrate-sheath region, although this requires grounding of the substrate or capacitive coupling of the substrate surface to ground [30]. On the other hand, during phase B and phase C we observe a plasma potential drop in the magnetic trap region. In particular, during phase B we observe that the plasma potential in the DR outside the magnetic trap is close to 0 V, whereas the plasma potential inside the magnetic trap remains high with a positive potential gradient towards the target surface, as seen in figures 9(a) and (b). This is a required condition to achieve ion acceleration independent of substrate grounding. Ions present at a location of high potential during phase B will be accelerated in a direction given by the gradient of the potential structure present inside the magnetic trap.
During phase C, a potential difference between the magnetic trap and the DR can also be observed, as seen in figure 9(d). However, the plasma potential at a typical substrate position is still high, which leads to a limited potential drop ΔUC in the plasma of typically 20–40 V. Such low values do not lead to significant ion acceleration. Furthermore, we again emphasize that the potential drop during phase C does not seem to be controlled by the applied positive voltage, i.e. increasing U+ does not increase ΔUC. Also in other works on bipolar HiPIMS [19, 20], a drop of only ΔUC ≈ 20 V has been reported, which could be related to the phase C, which we will return to in section 4.3.
One of the remaining key issues is the mechanism behind the observed changes of the recorded plasma potential at the substrate Up,subst.(t) during the positive pulse. A good understanding of the mechanism would certainly help to promote bipolar HiPIMS conditions exhibiting the desired phase B (long τB), and early transition to phase B (small tA→B) by additional means, besides using the observed trends with pressure, ID,peak and τ−,eff. We will therefore proceed by identifying the internal plasma parameters affecting Up,subst.(t) and, in turn, how these parameters are affected by changing the investigated external discharge parameters (p, τ−,eff, ID,peak, U+).
4.1. Theory of balanced currents
To analyze the evolution of measured plasma potential at the substrate, we here describe a simple theory relating Up,subst. to the electron saturation current at the target  and ion saturation current at the grounded chamber wall
  in a highly simplified case, in which no magnetic field is present at the target. For this theoretical discussion, the grounded magnetron anode ring is considered a part of the grounded wall. We treat the target and the grounded chamber wall as ordinary electrodes immersed in the afterglow plasma during the positive pulse and separated from the bulk plasma by sheath regions. The potential of the target is fixed at Ut = U+ and the potential of the grounded wall is 0 V. We consider a steady-state situation, where the sheaths at the target and wall have been established. We apply a basic theory of a sheath current in the absence of magnetic fields with no collisions and ionization for a case of a flat surface [38], which is well-known as the flat Langmuir probe theory. The target current It and wall current Iw can then be written as:


where  ,
,  and
and  ,
,  are the electron and ion saturation currents at the target and grounded wall, respectively. For simplicity, we also assume that the electron temperature Te is equal near the target and the wall. We neglect any voltage drops in the bulk plasma caused e.g. by ambipolar diffusion or plasma resistivity and therefore we use a single value of the plasma potential Up.
The electron and ion saturation currents at the wall can be expressed according to these formulae:


where ne is the plasma density (assuming plasma quasi-neutrality) and  symbolizes an average value of the plasma density along the wall surface with total area Aw. The ion saturation current is expressed according to the Bohm criterion assuming that the ion temperature is small compared to Te, i.e. Ti ≪ Te. The expressions for the target saturation currents,
  and
and  , are analogous to equations (3) and (4), but
  is used instead.
In a steady-state situation, no capacitive currents flow through the sheaths, the total charge inside the chamber is constant, and hence from the continuity equation it follows, that the target and wall currents must be equal (balanced):

The steady-state situation is reached by charging of the plasma and adjustment of the sheath potentials until an equilibrium value of the plasma potential Up is established.
In figure 10 we illustrate how the target and wall currents depend on the plasma potential according to equations (1) and (2). Following equation (5), the steady-state plasma potential can be found at the intersection of the two curves. Two relevant scenarios can be distinguished in figure 10: (a)  >
>  and (b)
  <
<  . In scenario (a)
  >
>  , the steady-state plasma potential is slightly (to the maximum a few times Te) higher than Ut. The potential drop is located in the sheath at the grounded wall. The target current It is limited and given by the ion saturation current at the wall,
  . In scenario (b)
  <
<  , the plasma potential is only slightly higher than 0 V. The potential drop is mainly located in the target sheath and the target current It is limited and given by the electron saturation current at the target,
  . Note, that the potential drop occurs at the electrode at which the total current is limited.

Figure 10. An illustration of the wall current and target current according to equations (1) and (2) in dependence on the plasma potential for two relevant scenarios: (a)  >
>  , (b)
, (b)  <
<  .
.
Download figure:
Standard image High-resolution imageIn the presence of the magnetic field in front of the target, the electrons are magnetized (for typical values of B = 10 mT and Te = 0.5 eV, the gyroradius of electrons is around 0.3 mm) and the description of the target sheath region and electron current at target It is highly complicated and differs from that defined by equation (1). Moreover, more complicated potential structures in the form of a double layer can exist in front of the target as shown in figure 9(d), and as discussed further in section 4.3, non-negligible electron impact ionization can be present. Because the electron current at the target is not well theoretically defined, we will from hereon not directly use the expression electron saturation current,  , but rather refer to this conceptualized quantity as an available target electron current. Nevertheless, we believe, that the same principle of balanced currents, with a modified formula for It, is to a large degree defining the bulk plasma potential during the positive pulse.
4.2. Target current vs chamber-wall current
The experimental results presented in section 3.1 have shown a very interesting behavior of the target current. The target current (with our sign convention) during the positive pulse is clearly anti-correlated with the evolution of the plasma potential distinguishing the different phases A, B, B/C and C. Moreover, the magnitude of the target current during the positive pulse is strongly dependent on the external factors studied (p, ID,peak, τ−,eff). It is therefore of interest to understand the observed features of the target current during the positive pulse.
As the target is at positive potential during the positive pulse, it acts as an anode and is attracting electrons, while positive ions are attracted to the wall. Another contribution to the wall current involves secondary electron emission (typically contributing less than 10% [39]), which we neglect for the sake of simplicity. As discussed in section 4.1, when neglecting capacitive currents in the sheath regions, the target current It must be equal to the current to the grounded electrodes, Ig, i.e. −It = Ig = Iw + Ias, where we further distinguish current to the grounded chamber walls Iw and current to the grounded anode shield of the magnetron Ias. To provide an experimental verification of the current equality, the ion saturation current at the wall  and anode shield current Ias has been measured (as explained in section 2.2) for the four different working gas pressures discussed in section 3.1.1. The discharge currents, and the target and plasma potentials, are shown in figure 4. In figure 11 the ion saturation current at the wall
  , the sum
  and the target current −It are compared during bipolar HiPIMS discharges. More detailed current data from each wall-probe together with the anode shield current can be found in the supplementary information S6.

Figure 11. Comparison of the target current during positive pulse −It with the ion saturation current at the chamber wall  obtained from the probe measurements and anode shield current Ias for four different pressures directly related to the measurements shown in figure 4. The contributions to the wall current estimated from the different probes can be found in the supplementary material. The different phases are highlighted by using different background colors.
Download figure:
Standard image High-resolution imageFor the case p = 0.3 Pa, figure 11 shows only minor differences between  and
and  and hence, in this case, Ias is insignificant during the positive pulse. The target current −It corresponds to the data shown earlier in figure 3. During phase A, the target current reaches a peak value of around −ItA = 20 A. We observe a good agreement between
  and −It during phase A, during which the plasma potential Up,subst. is close to the target potential Ut. Hence, the situation during phase A corresponds well to scenario (a) as described in section 4.1. It can be expected that the available electron current at the target (theoretical
  ) is higher than the ion saturation current at the wall
  , but due to the requirement of balancing the currents, the target current is limited by
  , i.e.
  , during phase A. The rapid decrease of the target current during the phase A to B transition is accompanied with a decrease of Up,subst. close to 0 V. At the same time, we do not observe any changes in
  , which continuously follows a trend expected from unipolar HiPIMS discharge (see section 4.3). Since the target current is smaller than
  during phase B, the target current is limited by the available target electron current (theoretical
  ) during this phase. As we observe changes in It and not
  , we can assume that the processes involved in the phase A to B transition cause a significant decrease of the available target electron current much below
  . As the plasma potential is close to 0 V, this situation during phase B corresponds well to scenario (b), as described in section 4.1. During the oscillatory phase B/C the target current is oscillating roughly between 0 A and
  . Following the theory on balanced currents in section 4.1, the oscillations of the plasma potential during the B/C phase are caused by rapid changes of the available target electron current, because the changes in
  are negligible. (The small peaks observed in
  are likely due to a capacitive current flowing through the wall-probes as the sheath at the particular probe is expanding and shrinking.) During phase C the target current is stabilized at
  , i.e.
  . However, the plasma potential does not reach Ut as predicted by the simple theory in scenario (b) but is stabilized at a value of Up,subst. = Ut − ΔUC. This fact is likely related to the presence of a double layer in front of the target during phase C, which is addressed in more detail in section 4.3.
When the working gas pressure p is increased (while maintaining constant ID,peak and τ−,eff) the magnitude of  decreases. The decrease of
  when increasing p can be explained by a lower plasma density at the chamber walls [40] due to a slower plasma diffusion at higher p. For p of 0.3 Pa and 0.6 Pa we observe only one peak in the
  waveform occurring at around t = 35 μs. For the higher p of 1 Pa and 1.9 Pa, the
  waveform reveals additional smaller peak/peaks at later times during the positive pulse (and also after the positive pulse, not shown) of unknown origin. In [41], a similar behavior of the plasma density was attributed to an ion acoustic wave in the plasma, reflecting off the chamber walls. For all the four pressures, the magnitude of the current flowing through the anode shield Ias during the positive pulse is very small. Ias ≈ 2–3 A in the first 10 μs of the positive pulse, and Ias < 1 A during the remainder of the positive pulse (see the supplementary information S6). Ias increases slightly with increasing p. Comparison of
  data with the
  data in figure 11 shows, that the contribution of Ias during the positive pulse is small for the lower p of 0.3 Pa, 0.6 Pa and 1 Pa. On the other hand, for the 1.9 Pa case, Ias contributes roughly 50% to the total ground current Ig, since
  is small.
For all the four pressures investigated we observe a very good agreement between the target current −It and the wall and anode shield currents  during phases A and C, as was already described for the 0.3 Pa case. These results further support the above described understanding of the dynamic behavior during the positive pulse. The increase of ID,peak or τ−,eff at constant pressure, see figures 5 and 6, respectively, leads to an increase of the negative target current during the positive pulse. That agrees with the fact that a denser plasma diffuses to the chamber walls for higher ID,peak and longer τ−,eff, as confirmed by additional wall-probe measurements (not shown). The results in figure 7 show, that the negative target current during the positive pulse is only negligibly increasing with increasing U+. That agrees with the fact, that the ion current at the wall is saturated and only negligibly increases with the increase of the chamber wall sheath voltage during phases A and C.
4.3. Chamber-wall current—unipolar vs bipolar HiPIMS
The same wall-probe measurements to those shown in figure 11, were performed also for unipolar HiPIMS discharges. In figure 12 we show a comparison of the ion saturation current density  measured by probe No. 1 in unipolar and bipolar HiPIMS. The same trends as discussed here are observed also for all the other wall-probes (not shown). The same discharge parameters for both unipolar and bipolar discharge were used; p = 0.3 Pa, ID,peak = 48 A, τ−,eff = 55 μs, i.e. the same as in figure 3. During the negative pulse and the delay time, we do not observe any significant difference in
  between the unipolar and bipolar discharge. During phases A and B, we observe only a small increase of
  during the bipolar discharge (can be seen only with a linear scale, not shown). On the other hand, during phase B/C and C, the magnitude of
  significantly increases and its slope of decay is smaller. Interestingly, during the off-time after the positive pulse,
  measured in the bipolar discharge decays faster than that measured in the unipolar discharge.

Figure 12. Comparison of ion saturation current density  measured by wall-probe No. 1 for bipolar HiPIMS (red) and unipolar HiPIMS (black) discharges. The same discharge parameters (p = 0.3 Pa, ID,peak = 48 A, τ−,eff = 55 μs) were used for both bipolar and unipolar HiPIMS. For reference, the plasma potential waveform Up,subst.(t) (blue) and target potential waveform Ut(t) (gray), measured during bipolar HiPIMS, are shown. The different phases are highlighted by using different background colors.
Download figure:
Standard image High-resolution image
The higher ion saturation current at the wall during phases B/C and C in the bipolar discharge can be related to an increased plasma density, which is likely caused by additional electron impact ionization occurring during phase C (and to smaller degree during phase B/C). This increased ionization is likely related to the formation of the double layer in front of the target as shown in figure 9(d) and connected to a secondary reversed plasma discharge. The ignition of this reversed discharge is supported by the remaining afterglow plasma from the negative HiPIMS pulse. In this work and also in [19, 21] (and derived from mass-spectra of other works [15, 19–21, 23]), the potential drop ΔUC was observed to be slightly larger than the ionization potential of the argon working gas, i.e. ΔUC > 15.76 V, and usually is observed to be around ΔUC ≈ 20 V (in this work ΔUC ≈ 20–40 V). In [20] a sudden increase in light emission of neutral and ion species (Ar+ and Ti+) was observed right after a plasma potential drop of 20 V (i.e. during phase C). The light emission in [20] originated close to the target, however, not directly inside the magnetic trap. This is in agreement with our measurement of the double layer structure shown in figure 9(d), where the gradient of the plasma potential, i.e. electric field, is located rather at the edge of the magnetic trap. From our additional measurements (not presented), it is clear, that the plasma potential oscillations during the B/C phase are related to an attempt to ignite a reversed discharge (B → C but does not succeed immediately and is thereby quenched (C → B
 . It is, however, not fully clear, why the reverse discharge exhibits such an unstable behavior during the B/C phase.
Based on our discussion on the measured ion saturation current density in unipolar and bipolar HiPIMS from figure 12, it is clear that the high target current measured during phase A at low pressures (0.3 Pa) is mainly due to a plasma generated during the negative HiPIMS pulse and any possible contribution to the target current from a secondary discharge is negligible.
4.4. Electron current at the target
In sections 4.1 and 4.2 we have suggested that the quasi-stationary plasma potential in the bulk plasma is established to balance the electron current at the target and ion current at the grounded electrodes. Hence, knowing both the available target electron current (theoretical  ) and
) and  is the key for understanding and further tuning of bipolar HiPIMS. We have experimentally evaluated
  during the whole positive pulse. However, we could not easily obtain the value of the available target electron current (theoretical
  ). It can only be measured directly during phase B and is given as the target current It. It is, however, very likely that the available target electron current is larger than
  during phases A and C. Different possible paths for the electrons to reach the target should be distinguished (outer part of the target not covered by magnetic trap, current through the magnetic trap, current through the null point), which is, however, out of scope of this paper.
The transition from phase A to phase B is related to the rapid decrease of the available target electron current. The physical explanation of this phenomenon is, however, not clear. During the transition from phase B to phase C the available target electron current increases. We speculate, that this phenomenon could be coupled with the working gas dynamics in front of the target and thereby related to gas rarefaction and gas refill. Significant gas rarefaction is expected at the high HiPIMS peak discharge currents at the end of the negative pulse in the present experiments, typically ID,peak = 48 A (corresponding to a peak discharge current density of JD,peak ≈ 2.5 A cm−2). For example, Huo et al [42] report a maximum decrease of the argon density in the IR of ΔnAr/ΔnAr,0 ≈ 50% at JD,peak ≈ 0.6 A cm−2 and the rate of gas rarefaction was the fastest at ID,peak. Kozák and Lazar [43] as well as Huo et al [42] later found that the depletion of neutral argon increases with increasing peak current with values of ΔnAr/ΔnAr,0 of up to 70%. The reduction in argon density is not compensated by sputtered neutrals, since the sputtered neutral density is generally more than an order of magnitude smaller than the working gas density [44]. A consequence of the lower density of neutral particles in the IR at the early stage of the positive pulse is likely the difficulty to ignite a reversed discharge, which is in line with our discussion at the end of section 4.3. The transition to phase C, however, could be associated with a working gas refill which increases the probability for electron–argon ionization collisions in the IR. In [42] the characteristic time associated with working gas refill is roughly around 100 μs, which is in reasonable agreement with the here-observed times of transition from phase B to C, tB→C. For higher ID,peak and stronger gas rarefaction, longer refilling times can be expected, which could be the reason for the increasing tB→C values observed in figure 5(b). In order to use the same explanation also for the data shown in figure 6(b), longer τ−,eff would need to have a similar effect on the gas rarefaction as increasing ID,peak, which is, however, less obvious. Further studies are likely needed to provide more information on the electron density and ion and neutral gas dynamics close to the target. Still, the ionization in the IR/magnetic trap during phase C increases the electron density at the target and hence likely contributes to the increase of the available target electron current above the ion saturation current at the walls.
4.5. Timing constrains
As discussed in the beginning of section 4, one can expect ion acceleration in the magnetic trap region during phases B and C. Furthermore, only those ions, which, at the beginning of these phases, are located at a position of high plasma potential can be accelerated. As a consequence, ions which leave the magnetic trap before time tA→B (see figure 3(b)) will not be significantly accelerated, as there is little to no electric field in the DR outside the magnetic trap.
To quantify these timing constraints, we here make rough estimates of the characteristic time for a majority of the ions to leave the magnetic trap. It follows from energy and time-resolved mass spectrometry measurements in HiPIMS discharges, that the kinetic energy of most metal ions arriving at the substrate (peak in the energy distribution function) is typically in the range 2–20 eV [5]. In the case of 63Cu+ ions, this energy range results in speeds of 0.2–0.8 cm μs−1. This range of speeds corresponds well with the typical metal ion time-of-flight data from target to substrate [45]. The size of the magnetic trap region (in the axial direction towards the substrate) can be approximated by the distance of the magnetic null point from target. As such, it depends on the magnetron size and the degree of unbalance with typical values around a few centimeters for small circular magnetrons, see for example [46]. In the present case we find that the null point is situated at 1.4 cm and 4.0 cm from the target for the two-inch and three-inch magnetrons, respectively. The characteristic times for the metal ions to leave the magnetic trap is then around 2–7 μs for the two-inch magnetron and 5–20 μs for the three-inch magnetron. These times are likely a lower estimate when looking at the working gas ions, such as 40Ar+, since recorded energy distributions of these ions generally exhibit a peak at around 2 eV without an energetic tail [5].
Let us now compare the characteristic times for ions escaping the magnetic trap with the time required to achieve ion acceleration during the positive pulse. The shortest phase A to B transition time achieved with the two-inch magnetron is tA→B = 15 μs for the discharge in figure 5 at the highest peak current investigated (ID,peak = 70 A, τ−,eff = 55 μs, p = 0.3 Pa). This is at least a factor 2 longer compared the ion escape time found above. We therefore expect only a limited fraction of Cu+ ions to be accelerated using the experimental conditions of the two-inch magnetron in this work. In the three-inch magnetron discharge in figure 8, tA→B = 22 μs which means also only limited fraction of Cu+ ions to be accelerated. Moreover, because of the long negative pulse length, τ−,eff, it is expected that a significant fraction of the ions (both Cu+ and Ar+) will leave the magnetic trap even during the negative pulse. This latter effect was studied by Viloan et al [22] for Ti/Ar bipolar HiPIMS discharges in a wide range of negative and positive pulse lengths. They found that the fraction of ions (Ti+ and Ar+) accelerated in the grounded substrate sheath (8.5 cm from a target) decreased from ∼100% to ∼10% when increasing the negative pulse length τ− from 20 μs to 200 μs. As the acceleration region during phase B in the present work is even closer to the target, given by the magnetic trap size, the needed τ− can be expected to be proportionally smaller.
Based on these considerations of timing the ion acceleration we find that it would be beneficial to achieve a lower tA→B = τA + τ± to accelerate a larger fraction of the ions during the positive pulse. Ideally this means eliminating phase A entirely, i.e. τA = 0, and at the same time maintain a low τ±. During our experiments we aimed at achieving the lowest τ± possible given the experimental setup. However, a finite τ± might sometimes be desirable. The reason is that energetic ions are produced already during the negative HiPIMS pulse [47, 48], and that too energetic ions can be detrimental to the growing film due to the risk of high intrinsic film stress. A finite τ± can allow these energetic ions to escape from the magnetic trap without such extra acceleration. As mentioned in the result section, the observed delay time τ± varied depending on the discharge conditions and is seen to depend mainly on the HiPIMS peak current ID,peak (figure 5) and positive pulse voltage U+ (figure 7). This can be explained by the inductance Li + Lc ( 10 μH) in the path from the output of the transistors of the bipolar HiPSTER unit to the target, as depicted in figure 1(a). Although the transistors themselves are open during the delay time and the output voltage is clamped at the positive voltage U+, a voltage drop occurs at these inductive elements due to the fast decay of the target current, see figure 3(b), causing the target potential to be close to 0 V. At larger positive voltage U+, the energy stored in Li + Lc can be dissipated faster, leading to a faster target current decay and smaller delay time τ±, see figure 7. Hence lower τ± than those presented should be possible to achieve by lowering Li + Lc.
5. Summary and conclusions
In this paper we have investigated the behavior of the plasma potential at a typical substrate position (in the DR) during the positive pulse of bipolar HiPIMS discharge with a copper target in order to identify suitable discharge conditions for achieving ion acceleration independent on substrate grounding. We have identified several distinct phases (A, B, B/C and C) during the positive pulse, which differ by the value of the plasma potential in DR and the magnitude of the target current. During phase A the plasma potential in DR is close to the applied positive target potential. In phase B the plasma potential in DR is close to 0 V. Phase B was therefore identified as potentially suitable for achieving ion acceleration in the target region, provided that it can be attained within a few microseconds after the negative pulse to avoid significant loss of ions within this region. During phase C the maximal available accelerating voltage is limited to 20–40 V and cannot be increased by increasing the positive target voltage. A spatial map of the plasma potential revealed an elevated plasma potential inside the magnetic trap during phase B. During phase C a potential structure resembling a double layer was observed. The dynamics of the plasma potential profile is likely target-dependent and affected by the sputter yield. In HiPIMS, the sputter yield has a strong influence on the ion recycling mechanism to reach high peak currents [49], where the latter is crucial for obtaining the desired phase B. Further studies using other target materials in non-reactive and reactive gas mixtures should therefore be investigated.
By investigating the target current and ion saturation current at the chamber walls, we have described a simple theory which is linking the value of the plasma potential in the bulk plasma to the ratio of the available target electron current and ion saturation current at the wall. We have observed that current through the grounded anode shield of the magnetron is of little importance during the positive pulse in our experimental setup. Experimentally we have shown, that the magnitude of the target current (in phase A, B/C and C) is limited by the current at the chamber walls, which is given by diffusion of the plasma, generated at the target, towards the chamber walls. In phases A and B, the target current lies close to this upper limit, and in phase B/C it oscillates with it as an upper bound. We conclude that the key to successful bipolar HiPIMS operation lies in understanding the electron current flowing to the target and its dependence on the discharge conditions, with prospects of decreasing the available target electron current below the ion saturation current at the wall. Such a situation was achieved in our experiment during phase B, however, the phenomena leading to this situation have been left unexplained.
The goal for further studies is to achieve the transition from phase A to B sooner (small tA→B or eliminate phase A entirely) and at the same time use only short HiPIMS pulses (small τ−,eff).
Acknowledgments
This work was supported in part by the Swedish Research Council (Grant No. VR 2018-04139), the Swedish Government Strategic Research Area in Materials Science on Functional Materials at Linköping University (Faculty Grant SFO-Mat-LiU No. 2009-00971), the Eurostars program (Grant No. E!114277, IonDrive), Project LM2018097 funded by Ministry of Education Youth and Sports of Czech Republic, Project GA19-00579S funded by the Czech Science Foundation and the National Natural Science Foundation of China (Grant Nos. 51805102 and 52165021). The authors would also like to acknowledge Ionautics AB for supplying the HiPIMS pulsing equipment which made the experiments possible, and in particular Petter Larsson (also at Ionautics AB) for fruitful discussions.
CRediT authorship contribution statement
Michal Zanáška: Conceptualization, Investigation, Data curation, Formal analysis, Visualization, Writing—original draft. Daniel Lundin: Project administration, Conceptualization, Supervision, Formal analysis, Writing review & editing, Funding acquisition. Nils Brenning: Conceptualization, Investigation, Formal analysis, Writing—review & editing. Hao Du: Investigation, Visualization, Writing—review & editing. Pavel Dvořák: Writing—review & editing. Petr Vašina: Writing—review & editing. Ulf Helmersson: Project administration, Conceptualization, Supervision, Formal analysis, Writing—review & editing, Funding acquisition.
Conflict of interest
The authors declare the following financial interests/personal relationships which may be considered as potential competing interests: three of the authors (Nils Brenning, Daniel Lundin and Ulf Helmersson) are engaged in the company Ionautics AB.
Data availability statement
All data that support the findings of this study are included within the article (and any supplementary files).
List of symbols
| ID,peak | Peak HiPIMS discharge current |
| τ−,eff | Length of the discharge current pulse |
| τ− | Length of the negative voltage pulse |
| τ+ | Length of the positive voltage pulse |
| τ± | Delay between the negative and positive pulse |
| τA | Length of phase A |
| τB | Length of phase B |
| tA→B | Time of the phase A to phase B transition (measured from the end of negative pulse) |
| tB→C | Time of the phase B to phase C (or phase B/C) transition |
| U+ | Positive target voltage applied during positive pulse |
| U− | Negative target potential applied during negative pulse |
| Ut | Target potential |
| Ufl | Floating potential |
| Up | Plasma potential |
| Up,subst. | Plasma potential at substrate position |
| Us | Film or substrate surface potential |
| ΔU | Maximum available ion accelerating potential |
| ΔUC | Plasma potential drop during phase C |
| ΔEacc | Accelerated energy |
| Ias | Current through the anode shield of the magnetron |
| It | Target current |
| Iw | Current through the chamber wall |

| Ion saturation current at the chamber wall |
| Icr | Current through the outer conductor of the coaxial cable |
| Ich | Chamber-to-magnetron-rod current |