

Abstract
Liposomes are potential drug carriers for atherosclerosis therapy due to low immunogenicity and ease of surface modifications that allow them to have prolonged circulation half-life and specifically target atherosclerotic sites to increase uptake efficiency. However, the effects of their size, charge, and lipid compositions on macrophage and foam cell behaviour are not fully understood. In this study, liposomes of different sizes (60 nm, 100 nm and 180 nm), charges (−40 mV, −20 mV, neutral, +15 mV and +30 mV) and lipid compositions (1,2-dipalmitoyl-sn-glycero-3-phosphatidylcholine, 1,2-dipalmitoyl-sn-glycero-3-phosphocholine, L-a-phosphatidylcholine, and egg sphingomyelin) were synthesized, characterized and exposed to macrophages and foam cells. Compared to 100 nm neutral 1,2-dipalmitoyl-sn-glycero-3-phosphatidylcholine (DPPC) liposomes, flow cytometry and confocal imaging indicated that cationic liposomes and 1,2-dipalmitoyl-sn-glycero-3-phosphocholine (DSPC) liposomes were internalized more by both macrophages and foam cells. Through endocytosis inhibition, phagocytosis and clathrin-mediated endocytosis were identified as the dominant mechanisms of uptake. Anionic and DSPC liposomes induced more cholesterol efflux capacity in foam cells. These results provide a guide for the optimal size, charge, and lipid composition of liposomes as drug carriers for atherosclerosis treatment.
Export citation and abstract BibTeX RIS
1. Introduction
According to the World Health Organization, atherosclerosis is the leading cause of death resulting in 18 million deaths per year. Atherosclerosis increases the risk of cardiovascular disorders like hypertension, stroke, coronary artery diseases and directly relates to severe limb ischaemia and renal impairment [1]. Atherosclerosis starts with the accumulation of apolipoprotein B containing lipoproteins beneath the endothelial layer of the arteries [2]. As an immune response, monocytes migrate to the sites and differentiate into macrophages to take up and eliminate the lipoproteins, leading to the macrophages being loaded with lipids, loss of mobility and accumulation [3].
Rather than invasive surgical procedures such as stent replacement, coronary artery bypass surgery and angioplasty [4], certain drugs are also known to reduce cholesterol level in blood, thus reducing cardiovascular risk. However, the efficacy of the drugs is controversial, as they may cause side effects like such as excessive bleeding due to the use of drugs like Warfarin and bradycardia due to the use of Atenolol [5]. Apart from drugs, high-density lipoprotein cholesterol (HDL-C), and triglycerides reduction treatment methods put more focus on reducing the low-density lipoprotein cholesterol (LDL-C), potency of which is also controversial as emphasized by American College of Cardiology/American Heart Association [6]. Furthermore, corticosteroids like fluocinolone acetonide are known for cholesterol reduction but they have been reported to cause toxicity in tissues like myositis and rhabdomyolysis in the muscles, in addition to their low solubility, short circulation time and nonspecific targeting [7, 8]. Therefore, it remains pertinent to find a non-toxic, biocompatible alternative for atherosclerosis treatment with a longer half-life in circulation. Recently, various nanoparticles have been developed to treat atherosclerosis [9]. Among these particles, liposomes are the most studied drug carriers since half a century ago. The lipid nature makes liposomes highly biocompatible and self-degrading with minimal toxicity [10, 11]. Liposomes demonstrate high drug loading capacity, either by encapsulation of hydrophilic drugs inside the vesicle cores or hydrophobic drugs in between the lipid bilayer [11]. The ease of surface modification also allows drugs to be able to conjugate to the surface [11]. Additionally, polyethylene glycol can be conjugated on liposomes to increase circulation time [12, 13]. Moreover, the size, charge and lipid component can be easily modified for tissue specific studies and medical applications [14–18]. The highly popular Pfizer/BioNTech and Moderna COVID-19 mRNA vaccines have also utilized liposome-based nanoparticles as carriers to minimize side effects and aid in controlled release of the mRNA [19–21]. Despite the potential invasive effects of the mRNA, severe adverse effect rates were lower than 1% while efficacies were at least 95% against the Alpha variant [20–22].
It has been noted that liposomes conjugated with phosphatidylserine show considerable targeting efficiency to atherosclerotic macrophages due to the presence of CD36 receptors on the macrophage surface and can be internalized via endocytosis [23, 24]. Drugs encapsulated in liposomes show several folds higher therapeutic benefits than the drugs alone [25–27]. Most importantly, liposomes are found to have cholesterol depletion ability, either alone or when encapsulated with drugs [28–30], making them promising drug carriers for atherosclerosis treatment.
In this study, liposomes with different sizes, charges and lipid compositions were developed and administered to macrophages and macrophage-derived foam cells. The effects of concentration of liposomes on cellular uptake and viability were studied. Confocal laser scanning microscope (CLSM) images and flow cytometry results showed that both macrophages and foam cells prefer taking up larger, cationic and 1,2-dipalmitoyl-sn-glycero-3-phosphocholine (DSPC) liposomes, whereas anionic liposomes demonstrated higher cholesterol efflux than the other liposomes. Our preliminary studies on endocytosis showed that the phagocytosis is the predominant pathway for internalization, followed by clathrin-mediated endocytosis (CME) for macrophages. For foam cells, CME was found to be the predominant pathway for internalization, followed by phagocytosis. The larger size, cationic charge, and DSPC lipid preference by macrophages and foam cells, together with high cholesterol efflux of anionic liposomes, provide a guide for liposome synthesis for atherosclerosis treatment. Using this report, the endocytosis pathways can also be manipulated to regulate the uptake efficiency for therapeutic applications.
2. Methods
2.1. Materials
1,2-dipalmitoyl-sn-glycero-3-phosphatidylcholine DPPC, 1,2-Dipalmitoyl-sn-glycero-3-phosphorylglycerol (DPPG), 1,2-dipalmitoyl-3-trimethylammonium-propane (DPTAP), DSPC, L-a-phosphatidylcholine (EPC), egg sphingomyelin (ESM) and 1,2-dipalmitoyl-sn-glycero-3-phosphoethanolamine-N-(lissamine rhodamine B sulfonyl) (Rhodamine) were purchased from Avanti Polar Lipids, Inc., USA. Human monocytic THP-1 cells were purchased from ATCC® TIB202™, USA. Roswell Park Memorial Institute (RPMI) 1640 Medium (ATCC modification), Penicillin-Streptomycin (PS) Solution, fetal bovine serum (FBS) and sterile phosphate buffered saline, (150 mM, pH 7.4) (PBS) were obtained from Pan Biotech, Germany. Phorbol 12-myristate 13- acetate (PMA), 2-mercaptoethanol and Oil-red O were purchased from Sigma Aldrich, USA. PicoGreen DNA Quantification assay kit was from Molecular Probes, USA. AlamarBlue metabolic assay kit was from Invitrogen. Oxidized low-density lipoprotein (ox-LDL) was from Alfa Aesar, USA. Trypsin-EDTA (0.25%) was from Gibco™ Life Technologies, USA. Wheat germ agglutinin, Alexa Fluor TM 633 conjugate (WGA), DAPI mounting solution was from InvitrogenTM, Thermo Fisher Scientific. Cholesterol Efflux assay kit (ab196985) was from Abcam, UK. Paraformaldehyde (158127), Amiloride hydrochloride hydrate (A7410), Chlorpromazine hydrochloride (C8138), cytochalasin D (C8273) and genistein synthetic (G6649) were from Sigma Aldrich, USA.
2.2. Preparation and characterization of liposomes
Liposomes were synthesized using thin film hydration technique [31]. Briefly, 0.09 mole of phospholipids were measured and dissolved in 3 ml of chloroform/methanol (2:1, vol/vol) solvent mixture in a round bottom flask. For fluorescently conjugated liposomes, 0.1 mol% of rhodamine was added to the mixture and protected from light during synthesis and storage. Subsequently, the solvent mixture was evaporated at 40 °C using a rotary evaporator (IKA® RV 10, Germany) connected to a water bath (IKA® MB10 basic, Germany). Rotation speed was set at 150 rpm, operating under low pressure condition for 50 min Subsequently, a thin film was formed and reconstituted in PBS to form multilamellar vesicles. The final lipid concentration was 18 mM. Vesicle size and unilamellarity of the vesicles (ULV) was controlled sequentially by extrusion through polycarbonate filters with specific pore sizes mounted on a bench top extruder (Transferra Nanosciences Inc., Canada). Different surface charge was obtained by mixing DPPC with either DPPG or DPTAP of certain ratio.
Table 1. DPPC liposomes with different sizes.
| Liposome formulation | Hydrodynamic size (nm) | PDI | Zeta potential (mV) | Pristine size (nm) | Unilamellarity |
|---|---|---|---|---|---|
| F1 | 108 ± 6.7 | 0.079 ± 0.016 | −7.8 ± 1.1 | 86 ± 14.7 | 87.00% |
| F2 | 63 ± 3.5 | 0.065 ± 0.014 | −7.8 ± 1.4 | 50 ± 11.9 | 90.50% |
| F3 | 182 ± 10.7 | 0.198 ± 0.112 | −4.8 ± 1.1 | 164 ± 30.4 | 78% |
The hydrodynamic size and zeta potential were measured using Malvern Zetasizer Nano ZS (UK). Cryo-TEM (Hitachi H8100) was used to measure the absolute particle size as well as calculating the unilamellarity. Briefly, 3 μl of 180 μM liposome dispersion was transferred onto a discharged lacey C-TEM grid (Vitrobot™, US). The grid was plunged in liquid ethane and frozen for 2 s. The voltage and current were set at 100 kV and 2 μA respectively for the imaging. Information on the different sizes, charges, and lipid compositions of the liposomes has been shown in tables 1, 2 and 3 respectively.
Table 2. DPPC based liposomes with different charges.
| Liposome formulation | Composition | Hydrodynamic size (nm) | PDI | Zeta potential (mV) | Pristine size (nm) | Unilam-ellarity |
|---|---|---|---|---|---|---|
| F1 | DPPC | 108 ± 6.7 | 0.079 ± 0.016 | −7.8 ± 1.1 | 86 ± 14.7 | 87.00% |
| F4 | 95% DPPC + 5% DPPG | 89 ± 6.3 | 0.073 ± 0.024 | −40.7 ± 8.4 | 70 ± 24.0 | 83.50% |
| F5 | 99% DPPC + 1% DPPG | 92 ± 5.8 | 0.076 ± 0.021 | −21.4 ± 4.6 | 70 ± 17.8 | 86.00% |
| F6 | 99% DPPC + 1% DPTAP | 106 ± 4.3 | 0.103 ± 0.054 | + 15.7 ± 6.8 | 72 ± 19.8 | 84.00% |
| F7 | 95% DPPC + 5% DPTAP | 107 ± 8.7 | 0.132 ± 0.051 | +30.0 ± 9.5 | 74 ± 14.9 | 90.00% |
Table 3. Liposomes with different lipid components.
| Liposome formulation | Composition | Hydrodynamic size (nm) | PDI | Zeta potential (mV) | Pristine size (nm) | Unilamellarity |
|---|---|---|---|---|---|---|
| F1 | DPPC | 108 ± 6.7 | 0.079 ± 0.016 | −7.8 ± 1.1 | 86 ± 14.7 | 87.00% |
| F8 | DSPC | 93 ± 3.2 | 0.076 ± 0.021 | +2.3 ± 0.6 | 69 ± 13.1 | 88.50% |
| F9 | EPC | 105 ± 11.6 | 0.082 ± 0.012 | +6.7 ± 2.8 | 68 ± 11.2 | 82.50% |
| F10 | ESM | 106 ± 8.7 | 0.065 ± 0.013 | +5.7 ± 2.7 | 76 ± 12.1 | 86.00% |
2.3. Macrophages and foam cells culture
THP-1 monocytes were cultured in flasks with complete RPMI (89% pure RPMI +10% FBS +1% antibiotics) in a humidified incubator at 5% CO2 and 37 °C. The cells were then seeded in 48-well plates with density of 10^5 cells per well containing 50 ng ml−1 PMA and incubated for 3 d. For foam cells formation, complete RPMI containing 100 μg ml−1 ox-LDL was administered to the macrophages and incubated for 2 d.
2.4. Flow cytometry analysis of cellular uptake of liposomes and CLSM imaging
Uptake of liposomes were measured using a Fortessa X-20 flow cytometer (BD Biosciences, USA). Briefly, rhodamine (ex/em 560/583 nm) conjugated liposomes were then treated to cells. Cells without liposome treatment were prepared as negative control. After 2 d of incubation, the cells were quenched with PBS containing 5% trypan blue for 5 min and then washed with cold PBS. The cells were then detached using 0.05% trypsin and centrifuged at 700 g for 5 min to remove supernatant. The cells were washed and resuspended in PBS and centrifuged again. The pellet was reconstituted in 500 μl PBS for flow cytometry. The data was analyzed by BD LSR FortessaTM X-20 cell analyzer with PE-A channel (ex 565 nm). Uptake was defined as mean fluorescence intensity per cell and was analyzed using Count versus PE-A histograms.
For CLSM imaging, rhodamine-conjugated liposomes were administered to cells seeded on coverslips. After 2 d of incubation, the cells were washed and quenched as described previously. The cells were then fixed using 4% paraformaldehyde in PBS for 30 min at room temperature. WGA was diluted 200 times in PBS and then stained the cells for 10 min. The coverslips were then mounted with DAPI on glass slides. The samples were dried at room temperature overnight before taking images at 40 X magnification (Olympus, U-LH100HG, Japan).
2.5. Cell viability measurement
The viability of cells was analyzed by combining dsDNA quantification and metabolic activity measurement. After treatment of liposomes and incubation, cells were washed with 37 °C pure RPMI twice and applied with 250 μl of pure RPMI containing AlamarBlue reagent (ratio 10:1). After 2 h of incubation, 200 μl of supernatant was transferred from each well, and absorbance nm(absorbance/reference 570/600 nm) was measured using microplate reader (Infinite M200, TECAN Inc., Maennedorf, Switzerland). The percentage of AlamarBlue reduction can be calculated according to the protocol provided by the assay kit. The results were normalized to the dsDNA quantification result measured using PicoGreen assay, which was conducted thereafter.
The cells were washed and then lysed with a cell lysis buffer (Cell Signaling Technology). The cells were then frozen at −80 °C and thawed at room temperature twice to get homogenous lysate solution. 100 μl of lysate was mixed with 100 μl of PicoGreen solution prepared according to the protocol in black 96-well plates. After 5 min' incubation at room temperature, the fluorescence intensity was measured at wavelength 480 nm/520 nm. The dsDNA concentration was calculated according to the protocol of the assay kit.
2.6. Cholesterol efflux ability comparison for different liposomes
For cholesterol efflux assay, the macrophages were administered with 100 μl of labeled-cholesterol-containing master mix (50 μl labelling reagent +50 μl equilibrium buffer) and incubated for 16 h for foam cells formation. The cells were then washed with pure RPMI and treated with 100 μM different types of liposome. After 4 h of incubation, the cholesterol efflux could be obtained by measuring the fluorescence intensity (ex/em 482/515 nm) of the supernatant transferred into a white well plate. Total cholesterol was evaluated by measuring the fluorescence intensity of supernatant-cell lysate mixture. Percentage of cholesterol efflux was calculated by the fluorescence intensity of supernatant divided by the fluorescence intensity of the mixture.
2.7. Endocytosis pathway investigation
To investigate the endocytosis pathways, inhibitors like amiloride (50 μg ml−1), chlorpromazine (5 μg ml−1), cytochalasin D (5 μg ml−1) and genistein (25 μg ml−1) were administered to macrophages and foam cells. The cells were washed with PBS and then treated with complete RPMI containing each inhibitor respectively and incubated for 30 min. The cells were then washed again with PBS and treated with complete RPMI containing both 100 μM rhodamine-conjugated 100 nm neutral DPPC liposomes and the inhibitors (no inhibitor for negative control) for another 4 h of incubation. They were then subjected to flow cytometry as described previously.
2.8. Statistical analysis
The data was analyzed by one-way ANOVA using OriginPro software (OriginLab Corporation). Data is shown in the form of mean ±SD. If not specified, n = 3 for viability and cholesterol efflux studies and n = 4 for uptake and endocytosis studies. Statistical significance of the difference between the two groups was determined by the two-tailed unpaired Student's t-test and considered significant if p < 0.05.
3. Results
3.1. Characterization of liposomes
Three groups of liposomes were synthesized: neutral DPPC liposomes of 60, 100 and 180 nm in hydrodynamic size; charged DPPC based 100 nm sized liposomes of −40, −20, 0, +15 and +30 mV; and neutral 100 nm sized liposomes made of different lipids: DPPC, DSPC, EPC and ESM. Table 1 summarizes the characterization of all the liposome formulations (F1–F10). For each liposome formulation, three batches were synthesized, and intensity weighted particle sizes were measured. The average hydrodynamic sizes, polydispersity indices (PDI) and zeta potentials from the three batches were then obtained (table 1). The DLS size and zeta potential plots for each liposome formulations were provided in supplementary figures 1 and 2 (available online at stacks.iop.org/NANO/32/505105/mmedia). Cryo-TEM images were obtained to measure the absolute sizes of liposomes (supplementary figures 3 and 4). The sizes of 200 liposome vesicles were measured using image J to get the average absolute sizes and standard deviations. Equation (1) was used to achieve the unilamellarity percentage.
3.2. Effects of liposomal concentration on cellular uptake by macrophages and foam cells
Since DPPC is a commonly studied lipid component for liposome synthesis and cellular interaction, the uptake of 100 nm neutral DPPC liposomes by macrophages and foam cells was examined by flow cytometry with lipid concentrations ranging from 1 up to 5000 μM (figure 1). Flow cytometry scatter plots and histograms were shown in supplementary figures 5 and 6. Cells were treated with complete RPMI media as negative control, and the fluorescence intensity was used as background signal to be subtracted from all the groups. It was observed that the uptake increased with increase in liposome concentration. Cell viability was examined by combining dsDNA quantification (picogreen assay) and metabolic activity (alamar blue assay) measurement. For both macrophages and foam cells, higher lipid concentration of 2000 μM and more resulted in cell death (figure 2). For macrophages, cell number was 20% lower than negative control when treated with 5000 μM liposomes for both days, while the metabolic activity decreased at 2000–5000 μM concentrations. For foam cells, cell viability reduced by at least 20% when the lipid concentration reached 2000 μM.

Figure 1. Concentration effects of liposomes on cellular uptake by macrophages and foam cells. Cells were administered with rhodamine-conjugated 100 nm neutral DPPC liposomes ofconcentrations varying from 1 μM to 5000 μM. Non-liposome treated cells workedas negative control. The uptake was measured using a flow cytometer after 2days of incubation. (a) shows the mean fluorescence intensity of macrophagesafter taking the fold change of 100 μM sample (bar) and the percentage of cellswith fluorescence signals (line). (b) shows side scatter height vs. PE-A dot plot and (c) shows the count vs. PE-Ahistogram of negative control sample. Dot plot and histogram of 100 μM liposomesample are shown in figures d and e. (f-j) shows the corresponding results of foam cells. n = 3.
Download figure:
Standard image High-resolution image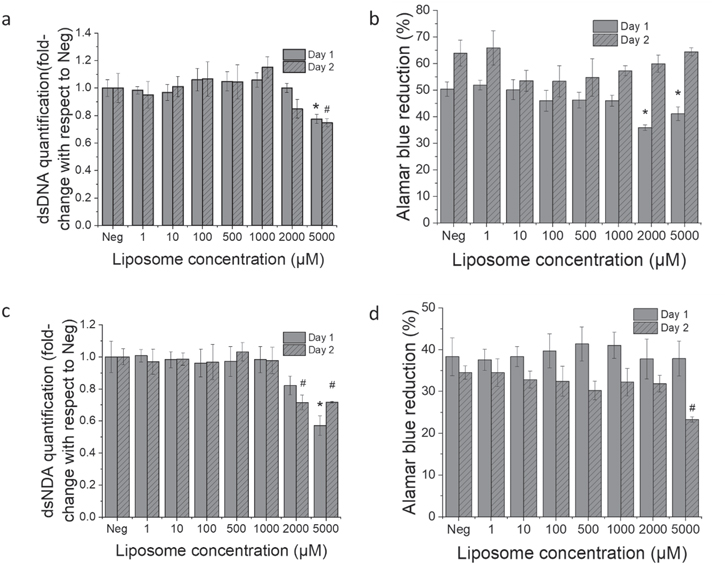
Figure 2. Concentration effects of liposomes on cell viability. Cells were administered with 100 nm neutral DPPCliposomes of different concentrations. Non-liposome treated cells worked asnegative control. (a) shows the quantification of cell number of macrophages usingPicoGreen assay (fold change of Neg) at time point of day 1 and day 2. (b)shows the percentage of AlamarBlue reduction of macrophages after normalizationto the fold change of dsDNA quantification results. (c) and (d) shows the DNAquantification results and AlamarBlue reduction measurements for foam cells,respectively. n = 3. * compared to Day 1 Neg; # compared to Day 2 Neg.
Download figure:
Standard image High-resolution imageThe cellular uptake of liposomes was then studied by confocal imaging (figure 3). Rhodamine-conjugated 100 nm neutral DPPC liposomes were administered to macrophages and foam cells seeded on coverslips, with concentrations varying from 1 to 500 μM. Cell membranes were stained with WGA 633 and nuclei were stained with DAPI. Cellular uptake was further confirmed by flow cytometry, as higher concentration increased liposome uptake by both cell types. Cells treated with 1 and 10 μM liposomes showed very low signal intensity.

Figure 3. Cellular uptake confirmation by CLSM images. Cells were administered with rhodamine-conjugated100 nm neutral DPPC liposomes and incubated for 2 days. The cells werethen quenched with 5% trypan blue and fixed with 4% paraformaldehyde.Subsequently the cell Nuclei were stained with DAPI, cell membranes werestained with WGA. Scale bar: 50 μm applies to all images.
Download figure:
Standard image High-resolution image3.3. Effects of liposome size, surface charge and lipid composition on macrophages and foam cells
Cellular uptake and viability were examined to investigate the effects of size (neutral DPPC liposomes), surface charge (100 nm DPPC based liposomes) and lipid composition (100 nm neutral liposome) of liposomes. The concentration of lipids administered was 100 μM. Uptake was measured by flow cytometry and visualized by confocal microscopy. Figure 4 shows flow cytometry results on the liposomal uptake by macrophages and foam cells. Compared to charge and lipid composition, liposomal size showed much less effect on cellular uptake. The uptake of 60 nm liposomes was only 30% less than 100 and 200 nm liposomes, while no significant difference was found between 100 and 200 nm liposome uptake (figure 4(a)). For charged liposomes, the uptake significantly increased with increasing surface charge from –40 to –20 mV, and was 50 times greater in positively charged +15 and +30 mV DPPC liposomes (figure 4(a)). For liposomes composed of different lipids, DSPC liposomes showed twice the uptake, whereas EPC and ESM only around 10% increase compared to DPPC liposomes (figure 4(b)).

Figure 4. Effects of liposome charge and lipid composition on c ellular upt ake. Effect of liposome charge and lipidcomposition on cellular uptake. Macrophages and foam cells were treated withrhodamine-conjugated liposomes of different size (60 nm, 100 nm and 180 nm),charge (−40 mV, −20 mV, neutral, +15 mV and +30 mV) and lipid composition for 2days. (a)_Fluorescence intensities recorded (fold-change) within macrophagestreated with 100 nm DPPC liposomes were plotted against zeta potential of theliposomes. (b) Comparison of fluorescence intensities of macrophages treatedwith liposomes of different lipid compositions. Figures (c) and (d) show the corresponding results of foam cells. n = 4 for all experiments.
Download figure:
Standard image High-resolution imageThe results obtained of foam cells (figures 4(c) and (d)) were only slightly different from those of macrophages. For macrophages, +30 mV liposomes were taken up at 150% of +15 mV liposomes and 500% of neutral liposomes uptake levels. For foam cells, maximum uptake took place for +15 mV liposomes, at about 250% that of neutral liposomes. With anionic liposomes, macrophages took up −40 mV liposomes at less than 10% that of neutral liposomes, which was only half of the uptake level of −20 mV liposomes. Foam cells took up −40 mV liposomes at 20% that of neutral liposomes, and 70% that of −20 mV liposomes uptake levels.
Cell proliferation and metabolic activity for macrophages have been summarized in the supplementary material (supplementary figure 7). Compared to negative controls, all other liposome formulations did not affect cell viability significantly.
Confocal images confirmed the liposomal uptake by macrophages (figure 5). The trend in size, charge, and lipid composition preference was similar to those measured by flow cytometry. Macrophages treated with 60 nm neutral DPPC liposomes showed lower uptake than cells treated with 100 nm neutral DPPC liposomes. Compared to neutral liposomes, anionic liposomes were internalized much less and cationic liposomes were internalized more. For liposomes made of different lipids, DSPC liposomes showed higher uptake than 100 nm neutral DPPC liposomes; EPC liposomes showed very little internalization. ESM liposomes were internalized more than EPC but less than half of DPPC liposomes.
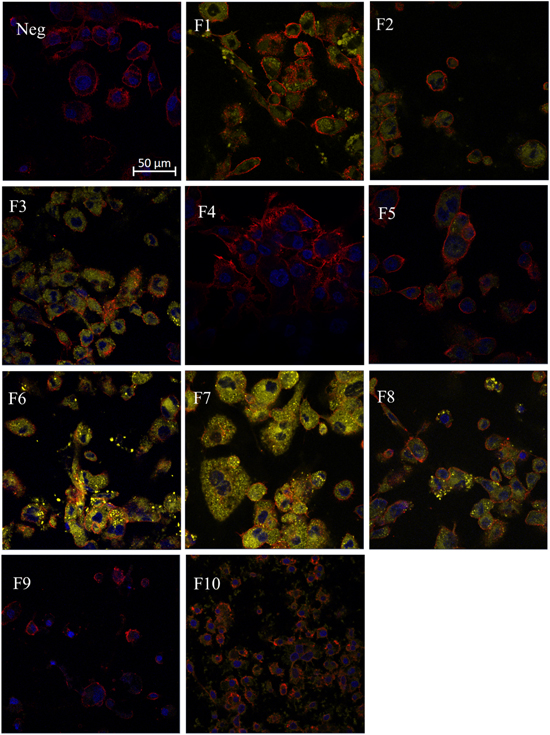
Figure 5. CLSM images of macrophages showing liposomal uptake. Macrophages were administered with 100 μM of differentliposome formulations and incubated for 2 days. The cells were then quenched with 5% trypanblue and fixed with 4% paraformaldehyde. Subsequently the cell Nuclei werestained with DAPI, cell membranes were stained with WGA 633. Scale bar: 50 μmapplies to all images.
Download figure:
Standard image High-resolution image3.4. Induction of cholesterol efflux by liposomes in foam cells
The relationship between the lipid concentration of 100 nm neutral DPPC liposomes and cholesterol effluxed out of foam cells was investigated by cholesterol efflux assay (figure 6). Four different concentrations (10 μM, 100 μM, 500 μM and 1000 μM) of liposomes were administered to the foam cells. It was observed that the cholesterol efflux increased as the concentration of lipids increased up to 500 μM. Furthermore, the effect of size, charge and lipid composition were compared, with the lipid concentration fixed at 100 μM. For both studies, cells treated with RPMI medium worked as negative control. The cholesterol efflux was not affected by changes in liposome sizes. Anionic liposomes effluxed more cholesterol than neutral liposomes, and neutral liposomes induced a two-fold increase in cholesterol efflux compared to cationic liposomes. There was no significant difference within the two anionic and the two cationic liposomes. DPPC liposomes and DSPC liposomes showed similar cholesterol efflux ability, three times that of EPC and ESM.
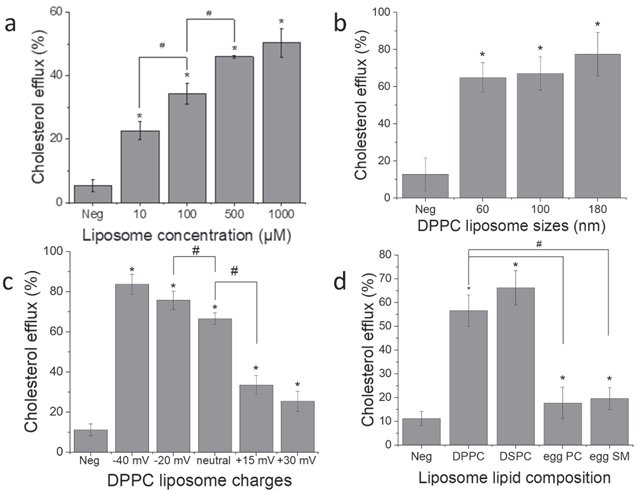
Figure 6. Effects of liposome concentration, size, charge and lipid composition on the cholesterol efflux in foam cells. Foam cells were induced from macrophages withfluorescently labelled cholesterol provided in cholesterol efflux assay kit andincubated for 16 hours. The cells were then administered with liposomes andincubated for 4 hours. For concentration study (a), 100 nm neutral DPPCliposomes were treated to cells, with concentration varying from 10 to 1000 μM.For size (b), charge (c) and composition (d) study, the concentration ofdifferent liposome formulations was 100 μM. The percentage of cholesterolefflux was calculated by fluorescence in supernatant over fluorescence insupernatant-lysate mixture. n = 3. * compared to Neg; # compared between thechosen groups.
Download figure:
Standard image High-resolution image3.5. Endocytosis pathways of liposomes by macrophages and foam cells
To investigate the internalization of liposomes by macrophages and foam cells, flow cytometry was performed, and various endocytic pathways were examined by quantifying the fluorescence intensities. The cells were administered with different inhibitors for 30 min (amiloride for macropinocytosis; chlorpromazine for CME, cytochalasin D for phagocytosis; and genistein for CVME). These inhibitors were tested to be not toxic at the concentrations used in this paper (supplementary figure 8). The cells were co-treated with rhodamine-conjugated liposomes and the inhibitors for 4 h. Background signals were measured by treating a group of cells with unconjugated liposomes. Results have been shown as fold change of negative control (Neg).
For macrophages, cytochalasin D and chlorpromazine inhibited 60% and 40% liposomal uptake respectively (figure 7(a)), while amiloride and genistein did not show any change compared to Neg. In macrophages inhibited with cytochalasin D, 75% of the cells showed fluorescence signal, while the rest showed 90% signal.
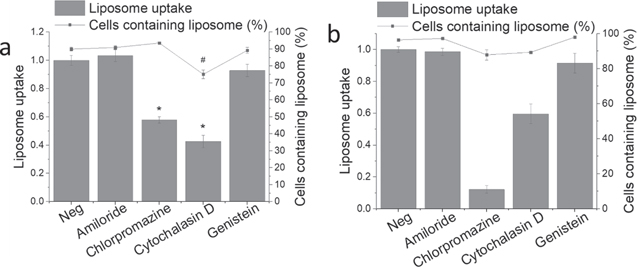
Figure 7. Uptake of liposomes by macrophages (a) and foam cells (b) after the treatment of inhibitors. Cells were pre-treated with different inhibitors for30 minutes. Then the cells were co-treated with inhibitors and 100 μM ofrhodamine-conjugated 100 nm neutral DPPC liposomes for 4 hours. Negativecontrol was cells not pre-treated with any inhibitors and treated withliposomes in the co-treatment step. Cells were then quenched, detached, andreconstituted in PBS for flow cytometry measurement. n = 4. * mean fluorescenceintensity compared to Neg. # percentage of cells compared to Neg.
Download figure:
Standard image High-resolution imageFor foam cells (figure 7(b)), chlorpromazine inhibited majority of the liposomal uptake (90%) and cytochalasin D inhibited 40%. For cells inhibited with chlorpromazine and cytochalasin D, 90% of cells were observed to have fluorescence signal, while the control group showed 100%.
4. Discussion
In this study liposomes with different size (60 nm, 100 nm, 180 nm), charge (−40 mV, −20 mV, neutral, +15 mV, +30 mV) and lipid composition (DPPC, DSPC, EPC, ESM) were synthesized and their interaction with macrophages and foam cells were investigated. In addition, the cholesterol efflux ability of different liposomes was compared. Finally, the endocytosis pathways were investigated using the 100 nm neutral DPPC liposomes.
The liposomes were synthesized using thin film hydration technique for the ease of lipid modification followed by sequential extrusion to get ULV with desired sizes [29]. The sizes of liposomes were consistent for different batches with variations of less than 10%, except 200 nm DPPC liposomes (PDI = 0.198 ± 0.112) and EPC (PDI = 0.082 ± 0.012). Except for 200 nm liposomes and the two cationic liposomes, the PDIs were less than 0.1. This indicated that most of the liposome formulations were monodispersed with narrow size distribution. For larger sized and cationic liposomes, alternate extrusion methods must be employed to get liposomes with narrower size distribution. TEM images showed more than 80% unilamellarity (supplementary figures 3 and 4), which may implicate even distribution of drugs in the single aqueous cores [32].
A wide range of lipid concentrations of 100 nm neutral DPPC liposomes, from 1 to 5000 μM, were administered to macrophages and foam cells to investigate the cellular internalization. Results showed that the uptake increased with increasing liposome concentration (figure 1(a)) and were cytotoxic beyond 2000 μM concentration (figure 2). Other studies have reported an increase in uptake with concentration over a wider range of concentrations from a few μM to over 10 mM. It has been further reported that the toxicity of liposomes arises due to their large sizes or high concentrations [21, 24, 33–38]. Based on the uptake and cell viability studies of all different liposomal formulations, 100 μM concentration was considered appropriate and chosen for the rest of our study.
Macrophages and foam cells were administered with 100 μM of different liposomal formulations to study the implications of size, charge and lipid composition on cellular uptake. For macrophages, the uptake studies showed that the 60 nm liposomes were taken up less than 100 and 200 nm liposomes (figure 4(a)). For foam cells, uptake was similar to macrophages, whereby 60 nm liposomes were taken up less than 100 and 200 nm liposomes (figure 4(c)). The main function of macrophages is to engulf pathogens and infected cells through phagocytosis, an endocytic mechanism in which the cells engulf large particles through the actin-dependent-polymerization process [39, 40]. On the other hand, liposomes are colloidal drug carriers, preferably prepared in sizes no bigger than 100 nm to avoid fast clearance [41]. Therefore, for atherosclerosis treatment, 100 nm liposomes should be the ideal size to consider due to the higher uptake efficiency and circulation time.
The negatively charged cell membranes show greater interaction with cationic particles. Nabila et al reported that negative charge on liposomes inhibits their interaction with macrophages and thus reduces phagocytosis [42]. However, the scavenger receptor CD36 on macrophages enhances their ability to interact with anionic liposomes [43, 44]. Macrophages have large uptake capacity for liposomes, however the cationic or anionic charge on the liposomes depend on the liposome composition and the type of macrophage. In this study, both macrophages and foam cells readily internalized cationic liposomes while anionic liposomes showed lower uptake. It was also noted that the uptake by macrophages were more charge dependent than foam cells. Thus, the charge of liposomes predominantly influences the internalization of liposomes over CD36-mediated uptake.
Liposomal uptake is also highly dependent on the lipid composition [24, 45, 46]. The structural formulae of the lipids used in this project are listed in supplementary figure 9. The complements and lipoprotein on macrophage membranes make them very selective to liposomes comprised of specific lipids. In this study, the uptake of EPC liposomes was only 10% of DPPC liposomes by both cell types. The low crystalline temperature of EPC highly prevents their binding with macrophages and thus reduces phagocytosis by macrophages. DSPC has a longer carbon chain than that of DPPC. The longer hydrophobic tail increases the hydrophobic interactions with macrophage membrane anchoring moieties such as squalene and cholesterol [47]. It has been reported that PS can improve the selectivity of liposomes by macrophages and therefore increases the uptake [48]. Therefore, lipids with longer chains and higher crystalline temperatures are advantageous as drug carriers.
The ability of foam cells to efflux cholesterol upon liposome administration was directly influenced by the liposome concentration, up to 500 μM (figure 6(a)). Even at very low liposome concentration (10 μM), the foam cells could efflux 30% of the cholesterol. All the liposome formulations reduced cholesterol level in foam cells, consistent with the hypothesis that liposomes can upregulate ATP binding cassette A1 and G1 genes which control the synthesis of protein-transportation proteins [49]. It was noted that the size of liposomes does not have a significant effect on cholesterol efflux. The charges affecting cholesterol efflux demonstrated a trend that is opposite to their uptake. Anionic liposomes were taken up the least, but cholesterol efflux was the highest. And cationic liposomes showed highest uptake in foam cells at a higher concentration, while cholesterol efflux was the least. Anionic liposomes can combine with LDL-C so the cholesterol can be removed by LDL-R [50]. Therefore, even though a small portion of anionic liposomes enter cells, the cholesterol efflux is significantly higher. Cholesterol efflux induced by DSPC and DPPC were higher than EPC and ESM, which may be due to the double bond in the lipid hydrophobic chain hindering their interaction with macrophages and foam cells. Another hypothesis is that the crystalline temperature of EPC is lower than 37 °C, so it crystallized at physiological temperature, making it too rigid to interact with the cells. But it does not explain the low cholesterol efflux capacity of ESM. Another possibility is the regulation of inflammatory pathway by the liposomes. Our group has previously shown that administration of neutral DPPC-PEG liposomes to 2D and 3D foam cell cultures can induce changes in the levels of cytokines involved in lipid accumulation and significantly reduce inflammation [51]. Since atherosclerosis is an inflammatory condition, and administration of liposomes aid in reduction of inflammation, it is possible that the same pathway also promotes cholesterol efflux. Further investigation needs to be performed on liposomes based on their charge or lipid composition for better understanding of the role of inflammation on cholesterol efflux.
To investigate the endocytosis pathways, 100 nm neutral DPPC fluorescent liposomes were treated to cells pre-treated with inhibitors. For macrophages, cells treated with cytochalasin D had lowest liposomal uptake. Cytochalasin D inhibits the actin polymerization process essential for phagocytosis and macropinocytosis [52–54]. Amiloride is an ion exchange inhibitor which inhibits macropinocytosis. Cells treated with amiloride did not show any reduction in liposomal uptake, by both total fluorescence intensity and percentage of cells containing fluorescence signals, indicating that the predominant endocytic pathway for liposomal internalization by macrophages is phagocytosis [55, 56]. Cells treated with chlorpromazine also inhibited liposomal uptake, indicating CME to be the second major endocytosis pathway by deactivation of clathrin lattices [57]. Genistein was used to examine the caveolin-mediated endocytosis pathway. No significant difference with negative control indicated caveolin-mediated endocytosis is not an uptake pathway for liposomes. For foam cells, chlorpromazine inhibited 90% of liposomes, indicating CME as the predominant endocytic pathway. Besides, like macrophages, phagocytosis was also found to be an endocytosis pathway, which blocked 40% of liposomal uptake. Thus, increasing the uptake efficiency of liposomes by macrophages and foam cells through liposome modification can be considered for drug delivery. Figure 8 summarizes the key findings of this study.

Figure 8. Graphical summary. Liposomes of different sizes, charges, and lipid compositions were administeredto macrophages and foam cells. Our results revealed that these factors affected several aspects of cellularbehaviour. Particularly, cationic liposomes were internalized more than anionicliposomes, but anionic liposomes exhibited greater cholesterol efflux ability byfoam cells. Phagocytosis and clathrin-mediated endocytosis were observed as thetwo key endocytosis pathways. These findings provide useful indications forliposome synthesis as drug carriers, especially for atherosclerosis treatment.
Download figure:
Standard image High-resolution image
One limitation to this study is that the size, charge and lipid composition studies on macrophages and foam cells were based on and compared to DPPC liposomes. DPSC was shown to have higher uptake than DPPC liposome, the size and endocytosis pathway of DSPC can be examined in more detail. Besides, cationic liposomes were taken up more, and anionic liposomes showed higher cholesterol efflux, therefore, the endocytosis pathway of charged liposomes needs further investigation. Another aspect of this study which can be further probed, is to compare the impact of different factors such as lipid tail length, transition temperatures and hydrophobicity on cellular uptake or cholesterol efflux. To do this, a larger sample size of the various lipid compositions of the liposomes will be required, so that a complete correlation and regression analysis can be performed.
5. Conclusion
Unilamellar liposomes of different size, charge and lipid composition were synthesized in this study, and characterized in terms of hydrodynamic size, PDI, zeta potential, pristine liposome size, cryo-TEM imaging and unilamellarity. Optimum concentration of liposomes to macrophages and foam cells were determined to be 100 mM by combining the uptake and viability measurements. Cationic liposomes demonstrated more cellular uptake, and anionic liposomes induced higher cholesterol efflux. The current study, thus, provides useful information about the specific size, charge and surface modifications of liposomes targeted towards macrophages and foam cells, which can be beneficial for therapeutic applications and atherosclerosis research.
Acknowledgments
This research was supported by NTU-Northwestern Institute for nanomedicine (Grant number M4081503.F40.710090). The authors would also like to acknowledge the Facility for Analysis, Characterisation, Testing and Simulation, Nanyang Technological University, Singapore, for their assistance with Cryo-TEM analysis.
Data availability statement
All data that support the findings of this study are included within the article (and any supplementary files).
Conflict of interest
The authors declare that they have no known competing interests or personal relationships that could have appeared to influence the work reported in this paper.