
Abstract
Acoustic force patterning is an emerging technology that provides a platform to control the spatial location of cells in a rapid, accurate, yet contactless manner. However, very few studies have been reported on the usage of acoustic force patterning for the rapid arrangement of biological objects, such as cells, in a three-dimensional (3D) environment. In this study, we report on a bio-acoustic force patterning technique, which uses surface acoustic waves (SAWs) for the rapid arrangement of cells within an extracellular matrix-based hydrogel such as gelatin methacryloyl (GelMA). A proof-of-principle was achieved through both simulations and experiments based on the in-house fabricated piezoelectric SAW transducers, which enabled us to explore the effects of various parameters on the performance of the built construct. The SAWs were applied in a fashion that generated standing SAWs (SSAWs) on the substrate, the energy of which subsequently was transferred into the gel, creating a rapid, and contactless alignment of the cells (<10 s, based on the experimental conditions). Following ultraviolet radiation induced photo-crosslinking of the cell encapsulated GelMA pre-polymer solution, the patterned cardiac cells readily spread after alignment in the GelMA hydrogel and demonstrated beating activity in 5–7 days. The described acoustic force assembly method can be utilized not only to control the spatial distribution of the cells inside a 3D construct, but can also preserve the viability and functionality of the patterned cells (e.g. beating rates of cardiac cells). This platform can be potentially employed in a diverse range of applications, whether it is for tissue engineering, in vitro cell studies, or creating 3D biomimetic tissue structures.
Export citation and abstract BibTeX RIS

Content from this work may be used under the terms of the Creative Commons Attribution 3.0 licence. Any further distribution of this work must maintain attribution to the author(s) and the title of the work, journal citation and DOI.
1. Introduction
The control over the spatial location of cells within three-dimensional (3D) microenvironments is of particular interest when creating biomimetic tissue constructs that can recapitulate native tissues. To achieve precise patterning of cells within hydrogels, various approaches have been investigated [1, 2]. These approaches have either appeared in the form of indirect patterning (e.g. surface modifications for differential cell adhesion, micro-molding [3] and photolithography [4]) or direct patterning (e.g. dielectrophoresis [5, 6], optical [7], magnetic patterning methods [8] and bioprinting [9, 10]). While indirect patterning methods have shown their ability to precisely position cells, they can be both expensive and time consuming. Additionally, one crucial shortcoming associated with indirect patterning techniques is the lack of proper control over cell density and proximity within the encapsulating biomaterial [1]. On the other hand, most direct patterning approaches rely on encapsulation of cells within hydrogels using electrical/magnetic/optical forces, or alternatively use inkjet or laser assisted printing approaches [11–20]. However, most of these approaches have major limitations in precisely positioning cells within hydrogel. For example, the main limitations of bioprinting technology is the relatively long amount of time necessary to correctly achieve the spatial location of cells within hydrogel and the lack of proper control over cell density. In addition, the magnetic approach needs to prove applicability in clinical settings due to the potential risk of the magnetic micro and nano particles on the metabolism and functionality of the cells as described in the literature [21, 22]. Further limitations are found when utilizing electrical forces, which largely depend on the conductive nature of the medium and can be cytotoxic to cells, altering their functionality. [23–26]. Finally, optical tweezers have also been employed to generate various patterns of cells in hydrogels. This technique, however, does not allow for the rapid organization of large populations of cells [27].
Aside from the approaches mentioned above, the application of surface acoustic waves (SAWs) has been recently reported as a non-invasive, simple and inexpensive approach towards the precise and rapid patterning of microparticles and cells [28–30]. SAWs can be easily stimulated under biocompatible conditions to create cell alignment without necessarily needing to tune the electrical conductivity or temperature of the assembly medium. This is because the SAWs technology depends neither on the conductivity of the assembly medium, nor does it generate significant heat during patterning. This technique has potential for various applications ranging from the focusing [30], separation [31], alignment [32, 33], and directionality of microparticles [34]. For instance, Shi et al have demonstrated the biocompatibility of this method using red blood cells and bacteria in two-dimensional (2D) manner [30]. To achieve manipulation of single microparticles, cells, and organisms using SAWs, the use of standing SAWs (SSAWs), has been investigated. SSAW usage was achieved by the creation and superposition of two SAWs while traveling in the opposite directions to one another [35, 36]. Finally, complex 2D cell-patterning [37] and 3D cell manipulation in microfluidic devices have also been studied recently [38].
Despite successful reports of the previously mentioned acoustic approaches toward generating 2D or 3D cell patterns and enabling new tissue engineering applications, the patterns must be sustained after removing the initial application of the SAWs. One alternative towards that end is to photo-crosslink the hydrogel matrix after patterning the cells. One example is Chen et al, where SSAWs were employed to pattern cell on a low-adhesion surface after sedimentation in fibrin hydrogel in a 2D manner, and crosslinking of the fibrin was achieved in about 20 min at room temperature [21].
More recently, the same group reported the use of bulk acoustic waves to pattern cells in horizontal planes, engineering multilayered, 3D brain-like constructs [39]. In their setup, the authors placed a piezoelectric transducer underneath a cell-contained pre-polymer, allowing for the emission of bulk acoustic waves within the fibrin hydrogel. In the study, the emission of bulk acoustic waves were used to form planar sheets of cells. While this approach was creative in its application, it may not be applicable for all settings of tissue engineering. This is mainly because bulk acoustic waves have volumetric characteristics, which makes this approach a challenge to integrate with small-scale, lab-on-a-chip techniques. As such, these issues favor the use of SAWs patterning for microfluidic assembly chambers and tweezer setups for biological and bioengineering applications.
Within our study, we make use of SSAWs and acoustic radiation force (ARF) assembly to spatially localize cells encapsulated within a photo-crosslinkable gelatin methacryloyl (GelMA) hydrogel matrix. These GelMA hydrogels are suitable platforms for encapsulated cells to easily attach, proliferate, and migrate with acceptable viability, which enables for 3D cell organization [40, 41]. By varying multiple parameters such as the frequencies corresponding to the SAWs, the concentration of GelMA molecules, as well as the duration of ultraviolet (UV) light exposure when curing GelMA hydrogels, we aim to further explore the usage of SSAWs as a contactless, direct patterning technique for localizing large numbers of cardiac cells within a hydrogel environment.
2. Experimental section
2.1. SAW setup fabrication
In this study, we used 128° Y-cut X-propagating 3 inch lithium niobate (LiNbO3). The photolithography process started with the cleaning of the piezoelectric substrates in an acetone bath (5 min sonication), subsequent rinsing under flowing water for 2 min, and blow-drying with N2. The substrate was treated in O2 Plasma for 3 min at 100 W. The sample was then spin-coated with photoresist (s1818, MicroChem, Newton, MA) for 30 s at 4000 rpm, and baked on a hot plate at 95 °C for 3 min. The transducer pattern on the mask was transferred into the photoresist layer by UV light exposure for 5 s (MA-6, SUSS Micro Tec AG) and was then developed using a 1:1 (v:v) dilution of photoresist developer (MF CD-26, Microposit) for 1.5 min followed by a rinse under flowing RO water for 5 min. After blow-drying, the sample was treated with O2 Plasma for 2 min at 60 W. A 20 nm titanium adhesion layer and a 100 nm gold layer were evaporated on their surfaces prior to the lift-off in acetone (at 45 °C) for 2 h. Finally, all unwanted parts of the metal layer were removed by lifting off the photoresist layer underneath, and the slanted-finger interdigital transducers (SFITs) were obtained. The device was immobilized on the stage of a microscope (Zeiss Observer D1). A radio frequency signal generator (TTi TG5011 LXI) was connected to the SFITs. Thereafter, coherent signals at a desired frequency with input power from −7 to −12dBm were provided to generate SAW on the lithium niobate substrate. The frequency of the generated acoustic wave was tuned by altering the input frequency of the transducers.
2.2. GelMA preparation
GelMA molecules was prepared according to our established protocol [40]. A 10% solution of gelatin from porcine skin (Sigma Aldrich) in Dulbecco's phosphate buffer saline (DPBS, Gibco) was prepared by stirring for two hours at 60 °C. To initiate the methacrylation reaction, 0.025 ml g−1 of methacrylic anhydride (Sigma Aldrich) were added dropwise to the mixture and subsequently incubated for 60 min at 60 °C under constant stirring at 500 rpm. Two volumes of DPBS were added to stop the reaction and dialysis was performed for 5 days. Subsequently, the GelMA solution was filtered and freeze-dried for 5 days.
2.3. Cell isolation
Neonatal rat ventricular cardiomyocytes were obtained by isolation based on a well-known procedure, approved by the Institute's Committee on Animal Care [42]. For this purpose, 2 day old Sprague-Dawley rats were used as model animals. To guarantee physiologically reliable and reproducible cell behavior, cardiomyocytes were applied in experimentation directly after the aforementioned isolation procedure. In addition to that, to separate cardiac fibroblasts, the cells were enriched by pre-plating for one hour. In this process, cardiomyocytes were harvested from the supernatant media. The remaining cardiac fibroblasts were continually kept in culture using DMEM (Gibco, USA) holding 10% FBS (Gibco, USA), 1% L-Glutamine (Gibco, USA) and 100 units ml−1 penicillin–streptomycin (Gibco, USA). This was continued until 90% confluence was reached. Consecutively, the cells were detached (by trypsin) and harvested. Prior to the application of electrical stimulation, the multi-layer samples were kept in culture for up to 5 days.
2.4. Preparation of the experimental setup
Following the described isolation, cardiomyocytes were mixed with cardiac fibroblasts in a 1:1 ratio to achieve a final concentration of 2 million cells ml−1. The cell mixture was suspended in a 5% GelMA solution. For this study, a glass slide was placed on the LiNbO3 wafer coupled with water, and a PMMA chamber was placed on top of the glass slide. The dimensions of the charmer were 0.6 cm (length) × 0.4 cm (width) × 0.8 mm (height). A 45 μl droplet of cell encapsulated GelMA solution was released in the chamber and was covered with a TMSPMA glass slide. The SAWs were generated using the signal generator (TTi TG5011 LXI). After the application of SAW, samples were exposed to UV immediately and were placed in 12 well plates, each filled with 1 ml of Dulbecco's modified eagle medium (DMEM). In total, for each of the applied frequencies, 12 samples were prepared. The values of the frequencies applied in this study are 3.4, 4.6 and 6.4 MHz. The multi-well plate was then placed in an environmental incubator for 2 h to allow cardiomyocytes and cardiac fibroblasts to adhere before replacing with medium. To reduce the risk of contamination, the medium was changed 24 and 48 h after seeding.
2.5. Viability assay (live/dead) and actin DAPI staining
Viability test was performed by incubating cell-laden samples for 15 min at 37 °C with a mixture of 2 μl ml−1 ethidium homodimer-1 (EthD-1, red, dead cells, Invitrogen) and 0.5 μl ml−1 calcein AM (live cells, green, Invitrogen). Fluorescence Microscopy was performed on a Zeiss Observer.D1 microscope using an X-Cite Series 120Q fluorescence source. We used three samples to calculate cellular viability of patterned cardiac fibroblasts at the 6.4 MHz resonant frequency with short UV exposure time (<10 s). Samples were fixed in 4% paraformaldehyde (Electron Microscopy Sciences), washed in DPBS and subsequently stained with phalloidin (life Technologies, labeled with Alexa F 594) and DAPI as described in the manufacturer's manual. Microscopy was performed as described above.
2.6. Finite element modeling
Finite element simulations were conducted to evaluate the principles of the device and to determine the mathematical characteristics of the cells manipulation and patterning in the proposed setup. In acoustic force patterning, the ARF Frad, created by the scattering of acoustic waves on the cells, will manipulate the position of the cells. The time-average ARF as a gradient of a potential function Urad on a single small spherical cell of radius a, density ρc, and bulk modulus kc placed in a standing wave field is given by [43]:


in which, ρg and ρc are the density of the fluid (GelMA pre-polymer solution) and cell, cg is the speed of sound in fluid, kg and kc are bulk modulus of the fluid and cell, and finally p and v represent pressure and velocity fields, respectively. All of the simulations were performed in COMSOL Multiphysics 5.0. As mentioned, for SFITs, each sub-channel was considered a uniform IDT electrode; so the simulations were conducted for cross sectional planes (x–z plane or side view) of the channel containing GelMA pre-polymer solution. The same pattern will repeat in other cross sectional planes of the mentioned sub-channel area. In the above-described cross-sectional model, we took into account the whole setup including piezoelectric substrate, glass slide and GelMA solution.
Material properties of LiNbO3 used in our simulations are characterized in previous studies [48]. Also, material parameters corresponding to GelMA pre-polymer solution and cells are tabulated on table 1. Making use of the CFD eigenfrequency module, the resonance frequency of the device was obtained. Subsequently, the generated acoustic pressure field was modeled using a frequency domain approach. Finally, a particle-tracing module was utilized to simulate the effects of the pressure field on the movements of cells within the GelMA pre-polymer solution. The simulations associated with the top view of the GelMA solution were performed using the values obtained from the previously described cross sectional simulations. So, for the simulations in the top view, we modeled GelMA solution exiting by defining acceleration on the walls within the frequency domain and then used particle tracing for evaluating cell movements.
Table 1. Simulation model parameters at 37 °C.
| 5% GelMA pre-polymer solution | |||
|---|---|---|---|
| Speed of sound [44] | 1534 | m s−1 | cg |
| Viscositya | 0.0025 | Pa s | ηg |
| Densitya | 1020 | Kg m−3 | ρg |
| Viscous boundary layer thicknessb | 0.35 | μm | δg |
| Bulk modulusc | 2.4 | GPa | kg |
| Cell | |||
| Speed of soundd | 1525 | m s−1 | cc |
| Poisson ratio [45] | 0.5 | — | vc |
| Density [46] | 1060 | Kg m−3 | ρc |
| Bulk moduluse | 2.46 | GPa | kc |
| Cell diametera | 10 | μm | dc |
aMeasured; bCalculated as δ = Sqrt(η/(ρπf)) from [47]; cCalculated as k = ρc2 from [47]; dAssume to resemble water; eCalculated as (ρc2) (1 + v)/(3(1 − v)) from [47].
2.7. Characterization of beating behavior
Spontaneous beating behavior was assessed every day by light microscopy (Nikon, Eclipse, Ti-S, Japan/Zeiss Observer D1) at 10× magnification using a CCD camera connected to the microscope alongside a video capture program. During the imaging process, the temperature of the sample environment was kept constant at 37 °C through the use of a heating chamber. To calculate the beating frequency, an in-house, custom-developed MATLAB script was employed to analyze the video sequences, frame by frame. Three independent experiments with a minimum of three replicates each were used for the calculation.
2.8. Statistical analysis
The statistical significance was determined using two-way ANOVA statistical analysis provided by the GraphPad package (GraphPad Prism 5.02, GraphPad Software). The same software package was used to arrive at the mean and standard deviation of the presented plots.
3. Results and discussion
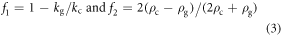
In an exploration of potential approaches towards directing cell patterning in tissue engineering, we have investigated the use of ARF to localize cells without contact. This is done by using SSAWs to relocate cells inside the GelMA pre-polymer solution. Figure 1(A) illustrates the concept of employing SSAWs to localize cells as a way to direct cell pattering. Pressure fluctuation generated by SSAWs lead to periodic distribution of nodes (where the pressure values drop to zero) and anti-nodes (where the pressure values are at a maximum). In acoustic force patterning, the ARF, which is a time-averaged net force created by pressure fluctuations, will manipulate the position of the cells. Based on the properties associated with the type of cells and the fluid surrounding the cells, this force can push the cells toward the pressure nodes. Depending on the frequency of the SAWs, the above-described patterning of cells can be tunable to a desirable spatial distance. To do this, our device was designed to generate multiple frequencies on a single platform. Supplementary figure 1 shows the peak of resonance frequencies exhibited by the transducers on the wafer. To manipulate the position of the cells within the GelMA pre-polymer solution, various peak frequencies were applied. Here, the maximum and minimum distance of the slanted fingers can limit the range of working frequencies of the setup. In the other words, the generated wavelength of the piezo-electric substrate in the excited subchannel area is equal to the period distance of the slanted fingers [49]. To generate these SSAWs, piezoelectric transducer elements are used, as shown in figures 1(B) and (C). The piezoelectric transducers used for this setup are known as SFITs. A SFIT can be considered as a cascade of sub-channels, which are called interdigital transducers (IDTs). Each sub-channel possesses its own resonance frequency, which means the SFIT is capable of operating over a range of frequencies [49]. Therefore, utilizing a frequency that is equal to the resonance frequency of a sub-channel, creates resonance, which in turn, produces waves that correspond to the width of the sub-channel. Figures 1(B) and (C) show the schematic and depiction of the piezoelectric transducers utilized in the experimental setup, which produced one-directional waves and subsequently patterned cells in parallel lines. Furthermore, to create more complex structures within GelMA hydrogel, we extended the fabrication of the experimental setup in a manner that allowed for the creation of SSAWs (in two directions perpendicular to one another), which would reorganize the cells inside the pre-polymer solution. A schematic of the two-directional setups and a depiction of the apparatus are illustrated in figures 1(D) and (E).
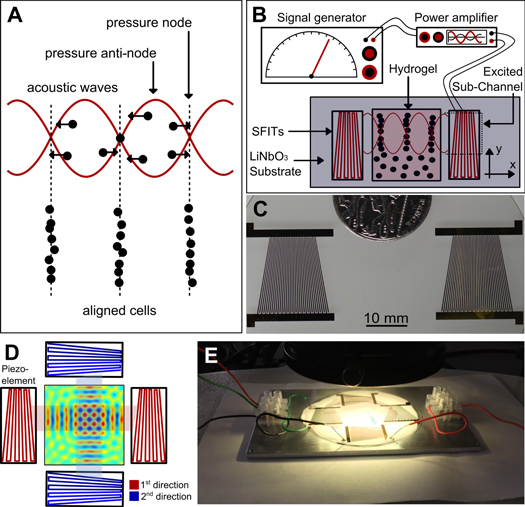
Figure 1. (A) The concept of employing SSAWs to localize and pattern cells. ARF will push cells toward pressure nodes and pattern cells in parallel lines; (B) schematic of the experimental setup employed to generate SSAWs, leading to the localization of the cells encapsulated within the GelMA pre-polymer solution; (C) real image, top-view, of the piezoelectric transducers utilized in the experimental setup. The non-uniform patterns of the electrodes allow variations of the frequency of the generated waves; (D) top-view schematic of the two-directional piezoelectric setup and the GelMA pre-polymer solution; (E) real image of the experimental setup including the transducers and piezoelectric substrate.
Download figure:
Standard image High-resolution imageDue to the promising potential of GelMA hydrogel's use in cell encapsulation, we aimed to examine its effectiveness for achieving 3D localization of cells while maintaining long-term cell viability. One way to achieve such patterning in 3D is to generate SSAWs on the surface of the piezoelectric substrate, which can then be transferred into the bulk volume of the GelMA pre-polymer solution. As schematically shown in figure 2(A), a glass treated with 3-(trimethoxysilyl) propyl methacrylate (TMSPMA) was used as an intermediate layer to integrate the waves into a poly(methyl methacrylate) (PMMA) channel. The chamber was then filled with 5% GelMA pre-polymer solution, encapsulating the cells, and was covered with a cover slip (thickness of 0.18 mm). Next, UV light was irradiated from the topside of the device for 10–30 s to crosslink the GelMA pre-polymer solution and maintain the generated pattern of the cells.
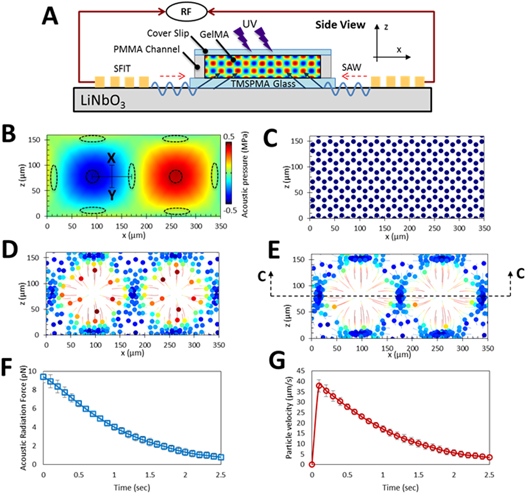
Figure 2. Numerical modeling demonstrating the displacement profiles generated within the GelMA pre-polymer solution using 6.4 MHz frequency. (A) A side-view schematic of the acoustic radiation force patterning; (B) acoustic pressure field in a side-view cross-section of GelMA pre-polymer solution and the corresponding acoustic nodes and antinodes illustrated by elliptical and circular dotted lines, respectively. The trajectories associated with the cellular movements are presented in color. This is done with the minimum velocities shown in blue and the maximum shown in red. The colored disks in the center of the circles are denoting the final destinations of the cells. (C) after 0; (D) 0.5; and (E) 1 s; (F) acoustic radiation force will reduce as the cells approaching the nodes and therefore; (G) the velocity of cells will decrease when they are going toward them.
Download figure:
Standard image High-resolution imageFigures 2(B)–(G) displays numerical modeling in a cross section of GelMA pre-polymer solution, demonstrating ARF's propensity for cell manipulation in the described setup. Pressure fields that resulted from the transfer of the SSAWs into the GelMA segment are illustrated in figure 2(B). The transferred waves reflect off the hard wall boundaries such as PMMA and glass, creating rectangular standing waves. This pressure field causes the creation of nodes and anti-nodes, which are shown in the figure 2(B) as elliptic and circular dotted lines, respectively. Furthermore, to examine the effect of the pressure fields on the cell movements, figures 2(C)–(E) illustrate the trajectories of the cells after 0, 0.5 and 1 s, respectively. As hypothesized, the simulations confirm that the encapsulated cells are driven to the pressure nodes, while an empty space is left at the anti-node regions.
As previously mentioned, one of the advantages of using SAWs, as opposed to bulk acoustic waves, is for their ease of use in microfluidic setups, as well as their capability in generating cell patterns in 3D space (in spite of being surface waves). To elaborate on this further, simulations revealed that if the height of the photo-crosslinked hydrogel in the z direction is thicker than ∼80 μm, then the position of the pressure nodes and subsequently patterned cells will vary from one longitudinal plane to another. This phenomenon is evident from the simulations presented in figure 2(B); demonstrating a shift in the position of the pressure nodes (shown with elliptical dotted lines) from one z-plane to another. In addition, this phenomenon can also be seen on the parallel cell lines pattern (supplementary figure 2); lying beside the bright cells on the surface of the hydrogel construct, other cells can also be observed in the middle of the parallel cell lines, with dimmer brightness. ARF is negligible in nodes or anti-nodes, and is at its maximum amplitude between them. In figure 2(B), referring to the midline between node and anti-node shown as the 'X–Y' line, the ARF (and therefore the cells' velocities) decrease when moving from the midline toward acoustic node. This is further illustrated and quantified in figures 2(F) and (G): as expected, when the cells which are initially on the X–Y line approach the acoustic node, the ARF decreases, and as a result, the velocity of the cells decrease as well.
To investigate the capability of the acoustic force assembly technique in enabling more complex structures within GelMA pre-polymer solution, as mentioned earlier, we extended the fabrication of the experimental setup in a manner that allowed for the creation of SSAWs (in two-directions perpendicular to one another). A schematic of the bi-directional setup and a depiction of the apparatus are illustrated in figures 1(D) and (E). The top-view results for the complex orthogonal patterns formed by this two-directional setup are also shown in figure 3. The superposition of the two perpendicular SSAWs results in the formation of a square-like pressure field, with double the amplitude of each one-directional SSAWs (figure 3(A)). This pressure field forms net-like, patterns of the cells from top view (figure 3(B) and supplementary figure 3). The pressure derived from two-directional application of the SSAWs is plotted in figure 3(C). In this plot, the pressure distribution along the line X–Y is depicted by a solid red line. This pressure distribution is related to the time corresponding to the peak of the first half cycle of the wave. This peak is associated with a timing of t = 1/(4f) where t refers to the time and f is the frequency. Similarly, the pressure distribution along the line X–Y at the negative peak of the second half-cycle of the wave is illustrated with the dotted blue line. This timing is associated with t = 3/(4f). Such plots not only help us gain an understanding of the cells' patterning, but also provides further information regarding the cells' localization (e.g. higher amplitude pressure will results in faster organization of the cells). This data, in addition to the data associated with the one-directional setup, serve as proof-of-principle evidence, suggesting the promise of the described acoustic force assembly technique for its use in cell localization.
Figure 3. (A) Top-view pressure fields resulted from the orthogonal acoustic wave interaction created using numerical simulation, assuming a working frequency of 4.6 MHz; (B) corresponding simulated and experimental patterns, when zoomed in. The scale bar shows 100 μm; (C) pressure fluctuation in GelMA pre-polymer resulted from transferred two-directional SSAWs. Pressure along the dotted X-Y line in the positive peak (t = 1/(4f)) and negative one (t = 3/(4f)) are depicted with solid red and blue dotted lines, respectively. (t refers to the time and f refers to the frequency).
Download figure:
Standard image High-resolution imageFor the cellular alignments associated with the one-directional setup shown in figure 1(C), simulations of patterning from the top view (C–C view of figure 2(E)) are illustrated in figures 4(A)–(C). As shown in these figures, the pressure field causes the cells to pattern in parallel lines. Following the simulation investigations, attempts were made to experimentally assess the prospect of cell-alignment within GelMA pre-polymer solution using ARF. To do so, 2 million cardiac fibroblasts and cardiomyocyte cells were mixed with a GelMA pre-polymer solution, and the mixture was loaded into a rectangular-shaped assembly chamber with 0.8 mm in depth. The random distribution of cells prior to the application of acoustic forces is demonstrated in figure 4(D). Subsequent to turning on the piezoelectric transducers, SAWs are generated on the surface of the LiNbO3 substrate, a piezoelectric material, with a reasonable level of optical transparency and high electro-mechanical coupling. Following generation of the SSAWs on the surface of the piezoelectric substrate, the energy created is transferred into the bulk volume of the cell-containing GelMA pre-polymer solution, resulting in a pressure fluctuation that can affect positioning of the cells within the solution (supplementary movie 1). The entire assembly time for the samples varied from one to another (based on the input power, frequency, and physical properties of GelMA pre-polymer solution), but generally remained under 10 s. Different frequencies were used to prove that through frequency tuning, the proposed setup does possess the control and flexibility. Figures 4(E) and (F) show optical microscope images of patterned cardiac fibroblasts and cardiomyocytes after the use of ARF assembly and UV light crosslinking of the hydrogel pre-polymer solution. While the distribution of cells prior to the application of ARF assembly was uniform, this would come to change with the application of acoustic forces. As depicted in figures 4(E) and (F), the cardiac fibroblasts and cardiomyocytes aligned from application of acoustic standing waves corresponding to resonant frequencies of 3.4 MHz and 6.4 MHz, respectively. After UV irradiation and stopping the standing waves, the assembled pattern remains stable and intact. Figures 4(G) and (H) show the percentage of cell density still remaining in the acoustic nodes after turning off the piezoelectric setup, without crosslinking of GelMA pre-polymer solution. The data presented here are associated with the same two frequencies reported on figures 4(E) and (F). Finally, figure 4(I) highlights the effect of different frequencies and concentration of GelMA pre-polymer solutions on the spatial distribution of cells associated with the previously described patterns. Up to this point, we have been able to report successful generation of cellular alignments using an acoustic force assembly approach. As indicated earlier, the spatial distribution can be varied by altering the input resonant frequency. However, it is of equal importance to consider overall cell viability and proliferation when utilizing techniques to align cells.

Figure 4. (A)–(C) The results of the simulation, top view, corresponding to the 'C–C' view as defined and shown on figure 2(E): (A) pressure field resulted from SSAWs and correspond patterning of cells after (B) 0 and (C) 1 s. (D)–(F) Microscope images of patterned cardiac fibroblast cells at day 1. Assembly time for the samples was 1.2 s: (D) random distribution of cells before applying acoustic patterning; (E) cardiac fibroblast cell alignment at 3.4 MHz; (F) cardiac fibroblast cell alignment at 6.4 MHz; (G) and (H) the scattering rate of the cellular density associated with the formed patterns, subsequent to ARF assembly, without UV crosslinking. The plots are obtained for two different frequencies (3.4 MHz in (G) and 6.4 MHz in (H)); (I) variation of the spatial distance between the patterned cellular lines, as influenced by the changes made to the SAWs frequencies and GelMA pre-polymer concentrations.
Download figure:
Standard image High-resolution imageTo optimize the UV crosslinking times, the cellular viability of patterned cardiac fibroblasts in GelMA hydrogel after different UV exposure times is quantified. (supplementary figure 4). A significant loss of cell viability was observed for longer UV exposure times. Therefore, a short UV exposure time of around 10 s was selected to make GelMA hydrogel. To evaluate the cytocompatibility of the acoustic force assembly method, the viability of the aligned cardiac cells within the GelMA hydrogel was evaluated up to 7 days (figure 5 and supplementary figure 5). A live/dead assay was performed and quantified for cardiac fibroblasts immediately following the patterning at the 6.4 MHz resonant frequency. As shown in figure 5(A), close to 90% cellular viability was revealed at short UV exposure time (<10 s), demonstrating the minimal effect of the acoustic force assembly method had on cell viability. Furthermore, to assess morphological behavior of the cardiac cells during the culture period, cardiac fibroblast and cardiomyocytes within the 5% GelMA hydrogel were cultured up to 7 days post-assembly, and were stained with F-actin and DAPI. Figures 5(B) and (C) represent the images of F-actin/DAPI staining of cells after 5 and 7 days, respectively. On day 5, the encapsulated patterned cardiac cells demonstrated spreading, and by day 7 they started forming interconnected cellular networks. Finally, to validate the functionality of such patterned constructs, figure 5(D) is shown to demonstrate the development of beating over time (movie 2). As evident from the plot, the beating rates increased with the number of cell culture days that have elapsed and was at its peak on day 9; after which the rate of beating started to decline rapidly. The decrease in beating rate with increasing culture time was also shown in previous studies, in which rat neonatal cardiomyocytes were cultured on hydrogel-based tissue-engineered models [50, 51]. This decrease might be attributable to the phenotypical transition of fetal cardiomyocytes towards the neonatal stage [51]. These results confirm that the SSAWs assembly approach reported in this study could be employed to align cells within a pre-defined assembly setup. Most importantly, this technique allowed cells to remain viable and grow into functional constructs that demonstrated cardiac beating.

Figure 5. (A) Viability assay on day 0 reveals nearly 90% live cells; (B) F-actin/DAPI staining of cells after 5 days, when the encapsulated patterned cardiac cells demonstrated spreading; (C) F-actin/DAPI staining of cells after 7 days, when the encapsulated patterned cardiac cells started forming interconnected cellular networks; (D) spontaneous beating rates of 3D cardiac tissues over time.
Download figure:
Standard image High-resolution image
4. Conclusion
In this study, we have demonstrated that the acoustic force assembly technique, in combination with GelMA hydrogels (possessing adjustable physical, chemical, and mechanical characteristics) can provide a setting to facilitate the generation of various 3D cellular patterns and constructs in a rapid and contactless manner. Towards this purpose, SSAWs were applied on the surface of the piezoelectric substrate, resulting in energy transfer into the cell-laden GelMA pre-polymer solution, leading to rapid alignment of the cardiac cells. Simulations were conducted to gain an understanding of cell behaviour and to find the optimal design parameters for our acoustic setup. Experimentation was also conducted in one and two-directional setups based on in-house fabricated piezoelectric transducers. This allowed us to study and refine the effect of various parameters, including the optimal operating frequency of the setup. Moreover, it was demonstrated that the acoustic force assembly method can be utilized to control spatial distribution of the cells while maintaining cell viability and function (e.g. demonstrating cardiac beating). Therefore, the acoustic force assembly approach presented here offers a novel technique for the engineering of complex 3D tissues. Patterning techniques are fundamental for investigation of cellular behaviours such as cell–cell interaction and drug development studies in various settings [35]. One limitation of the one-directional patterning method presented in this study is that the created structures is limited to line patterns. However, in the context of cardiac tissue engineering and in order to capture the proper functionality, it is vital to recapitulate the 3D aspects of the microenvironment of the cardiac fibres [52]. Another limitation of our approach is that the 3D patterned constructs are produced in micro dimensions only. Despite the limitations, it makes it uniquely suitable for microfluidic devices, with unique advantages for a number of applications such as drug screening.
Acknowledgments
The authors gratefully acknowledge funding from the National Institutes of Health (EB012597, AR057837, DE021468, HL099073, R56AI105024), the Presidential Early Career Award for Scientists and Engineers (PECASE), and Air Force Office of Sponsored Research under award (FA9550-15-1-0273). This work was partially supported by a microgrant from Brigham Research Institute and Center for Faculty Development and Diversity's Office for Research Careers at Brigham and Women's Hospital. SRS would like to recognize and thank Brigham and Women's Hospital President Betsy Nabel, MD, and the Reny family, for the Stepping Strong Innovator Award through their generous funding. Daniel Hosseini is also acknowledged for discussions and help with illustrations. JC acknowledges support from a personal EPSRC Fellowship (EP/K027611/1) and the ERC advanced investigator award (340117 – Biophononics).