


Abstract
Changes in the relationship between El Niño-Southern Oscillation (ENSO) and the East Asian winter monsoon (EAWM) at various global warming levels during the 21st century are examined using the Max Planck Institute Grand Ensemble Representative Concentration Pathway 8.5 experiments. The externally forced component of this relationship (i.e. forced by greenhouse gases and anthropogenic aerosols emissions) strengthens from present-day to +1.5 °C, and then weakens until +3 °C. These changes are characterized by variations in strength and location of the core of El Niño-related warming and associated deep convection anomalies over the equatorial Pacific leading to circulation anomalies across the Asian-Pacific region. Under global warming, the ENSO–EAWM relationship is strongly related to the background mean state of both the EAWM and ENSO, through changes in the EAWM strength and the shift of the ENSO pattern. Anthropogenic aerosols play a key role in influencing the ENSO–EAWM relationship under moderate warming (up to 1.5 °C).
Export citation and abstract BibTeX RIS

Original content from this work may be used under the terms of the Creative Commons Attribution 4.0 license. Any further distribution of this work must maintain attribution to the author(s) and the title of the work, journal citation and DOI.
1. Introduction
The East Asian winter monsoon (EAWM), a prominent feature of the northern hemisphere atmospheric circulation during boreal winter, has a large influence on the weather and climate of the Asian-Pacific region (e.g. Chang 2006). Its dry cold low-level northeasterlies can generate cold surges leading to severe weather over Southeast Asia (e.g. Wang and Chen 2010), with profound societal impact and economic losses (Zhou et al 2009).
The EAWM exhibits variability from interannual to interdecadal timescales, associated with mid- and high-latitude as well as tropical features (e.g. He and Wang 2012, Chen et al 2013, Wang and Chen 2014). At interannual time scales, the EAWM is strongly influenced by El Niño-Southern Oscillation (ENSO) and the ensuing Pacific-East Asia (PEA) teleconnection pattern (e.g. Zhang et al 1996). Associated with an El Niño event, the anomalous low-level anticyclone over the western tropical Pacific induces southwesterlies on its western flank, which weaken the EAWM flow and lead to warmer and wetter conditions over southeastern China and the South China Sea (Wang et al 2000, 2013). The observed ENSO–EAWM relationship displays substantial multi-decadal variability during the 20th century/early 21st century (e.g. Li and Ma 2012, He and Wang 2013, Jo et al 2015, Li et al 2015), with corresponding pronounced variations in the teleconnections patterns over East Asia and the Pacific. Yet, there is no consensus on the factors affecting these fluctuations, which have been ascribed to the influence of large-scale internal climate variability (i.e. the Pacific decadal oscillation (e.g. Kim et al 2017) and the Atlantic Multidecadal Oscillation (e.g. Geng et al 2017)), interdecadal variations of ENSO (e.g. Wang et al 2009) and the EAWM (e.g. Ding et al 2014), and external forcing, either natural (e.g. solar cycle; Zhou et al 2013) or anthropogenic (e.g. the shift of the climatological Walker circulation due to green house warming; He and Wang 2013). Future projections of the ENSO–EAWM relationship for the 21st century have also been investigated (e.g. Wang et al 2013, Jiang et al 2013, Xu et al 2015); this topic has however received much less attention compared to the analysis of the link between ENSO and the East Asian monsoon during the summer (e.g. Li and Ting 2015, Song and Zhou 2015).
While the literature provides evidence of the long-term variability of the ENSO-EAWM link, our understanding of its nature and underlying mechanisms is far from complete. Reproducing the observed ENSO–EAWM relationship and its interdecadal variations can be particularly challenging, even for the latest Coupled Model Intercomparison Project Phase 5 models (He et al 2013, Wang et al 2013, Gong et al 2014, 2015). Large uncertainty in the ENSO-EAWM link may stem from the interplay between external forcing and internal climate variability, especially on interannual time scales (e.g. Deser et al 2012). The separation of internal climate variability and the forced response has been difficult in part due to the limited number of ensemble members in the CMIP5 archive. In view of the global warming targets of 1.5 °C and 2 °C above pre-industrial levels set by the 2015 Paris agreement, it is critical to investigate potential changes in the ENSO–EAWM relationship at various degrees of warming during the 21st century and the related mechanisms forcing these changes. Our primary objective is to identify externally forced anthropogenic variations (i.e. from greenhouse gases and aerosols emissions) as these are likely predominant throughout the 21st century (e.g. Kumar et al 1999, Li et al 2015), especially at high warming levels.
2. Data and methods
We use the 100-member ensemble experiments of the Max Planck Institute Grand Ensemble (MPI-GE), performed with a state-of-the-art comprehensive climate model (the MPI Earth System Model, MPI-ESM; Maher et al 2019). This provides the opportunity to separate externally forced changes from those associated with internal variability (Si and Hu 2017, Maher et al 2018): the former are obtained by using ensemble-mean quantities, the latter by subtracting the forced component from each ensemble member (e.g. Deser et al 2014, Song and Zhou 2015). Further details on the model are provided in the supplementary material (available online at https://stacks.iop.org/ERL/15/124056/mmedia). Relevant for this study, the MPI-ESM shows good skill amongst the CMIP5 models in simulating the EAWM (Gong et al 2014) and its relationship with ENSO (Wang et al 2013, Gong et al 2015). Here we use the pre-industrial control (2000 years), the historical simulations (1850–2005) and the future projections for the 21st century (2006–2100) under the Representative Concentration Pathway (RCP8.5) emission scenario. The European Centre for Medium-Range Weather Forecasts interim reanalysis (ERA-I; Dee et al 2011), the NOAA (National Oceanic and Atmospheric Administration) outgoing long-wave radiation (OLR; Liebmann and Smith 1996), and the Global Precipitation Climatology Centre (GPCC) land-surface precipitation (Schneider et al 2018) observational data are used to evaluate the present-day model climatology and its ENSO-related patterns.
Location and magnitude of the OLR anomalies are used as an indicator of ENSO's convective anomalies and thus of the regions of deep ascent and upper-tropospheric divergence (e.g. Jo et al 2015). We focus on the boreal winter (December–February, DJF) season over 21 year periods for present-day (1984–2004) and the future. Global warming levels of 1.5 °C, 2 °C and 3 °C above pre-industrial times (here the period 1850–1900; Schleussner et al 2016, Nikulin et al 2018) are identified based on the time series of 21 year moving averages of global mean surface temperature (GMST). These three warming periods were selected as the first 21 year slices to exceed the temperature thresholds above (figure S1). ENSO is described by the Niño3.4 index (area-averaged sea surface temperature (SST) anomaly over 5°S–5°N, 120°–170°W). To quantify the EAWM circulation variability, we use the Ji et al (1997) index (the negative 1000 hPa meridional wind averaged over 10°–30°N, 115°–130°E; hereafter EAWMI); as it describes the spatio-temporal characteristics of the ENSO–EAWM relationship well (Wang and Chen 2010, Gong et al 2015). Positive anomalies of the EAWMI indicate a stronger-than-normal EAWM. The spatial structure of the ENSO–EAWM relationship during each of the 21 year periods was deduced by regression and correlation analysis after removing the 21 year linear trend at each point, and the statistical significance was evaluated using the two-tailed Student's t-test accounting for autocorrelation. As the main objective of this study is to identify externally forced changes in the ENSO–EAWM relationship associated with anthropogenic global warming, the following analysis mostly uses ensemble-mean quantities.
3. Results
We first assess the MPI-GE performance in reproducing the present-day observed pattern and magnitude of the ENSO-related circulation anomalies across East Asia and the Pacific (figure 1). The spatial patterns of simulated SST and OLR anomalies are broadly similar to those found in observations (figures 1(a), (b) and (d), (e)); also, the model captures well the location of the two prominent low-tropospheric circulation features, the anticyclone over the western tropical Pacific and the cyclone over the north-eastern extratropical Pacific (figures 1(c) and (f)). The MPI-GE shares common SST biases with other CMIP5 models, such as a westward shift of the equatorial Niño warming and associated deep convective anomalies, a too wide meridional extension of the positive SST anomalies over the eastern Pacific, as well as a weaker and more confined cooling and suppressed convection to the northwest (Taschetto et al 2014, Dieppois et al 2015). Weaker sea level pressure anomalies over the western Pacific (figures 1(c) and (f)) are also a common characteristic of CMIP5 models (Wang et al 2013, Gong et al 2015). The pattern of the simulated 1000 hPa meridional wind anomalies over the EAWMI region in the South China Sea is also similar to observations, albeit of weaker magnitude (figures 1(b) and (e)). This results in a simulated precipitation distribution over Eastern Asia close to observations, despite the slight underestimation (figures S3(a) and (b)). However, more anomalous southerly winds along the East Asian coast may lead to enhanced continental warming over Asia compared to observations. The model appears to capture the observed close relationship between ENSO and the EAWM reasonably well (r = −0.50 compared to r = −0.74 in observations). Overall, this confirms previous findings (Wang et al 2013, Gong et al 2015) and shows that the MPI-GE simulations can reproduce both the negative temporal correlation between the Niño3.4 index and the EAWMI (hereafter r(Niño3.4, EAWMI)), and the anomalous spatial patterns.
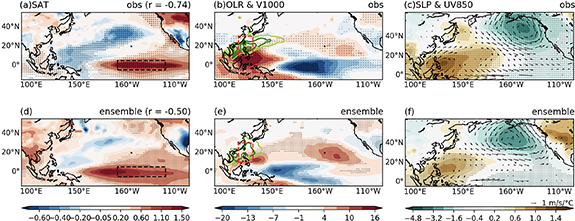
Figure 1. DJF regressions of (a) and (d) surface air temperature (SAT, SST over the ocean, °C °C−1, shades); (b) and (e) outgoing longwave radiation (OLR; W m−2 °C−1, shades) and 1000 hPa meridional wind (V1000, m s−1 °C−1, contours, values plotted only when larger than 0.2 m s−1 °C−1); (c) and (f) sea level pressure (SLP; hPa °C−1, shades) and 850 hPa wind (UV850; m s−1 °C−1, vector:) onto the Niño3.4 index for the period 1984–2004. Figures 1(a)–(c) are for ERA-I. Figures 1(d)–(f) are for the MPI-GE ensemble mean. Dotted regions and dark green contour lines in figures 1(b) and (e) mark anomalies significant at the 90% level from the two-tailed Student's t-test. The temporal correlation coefficient between the Niño3.4 index and the EAWMI is labelled in figures 1(a) and (d). The definition regions of these two indices are marked by red and black rectangles respectively.
Download figure:
Standard image High-resolution imageThe future changes in the ENSO–EAWM relationship and the associated spatial patterns are examined in figure 2. The 21 year sliding correlation between the Niño3.4 index and the EAWMI (figure 2(a)) oscillates around present-day values until about 2015, strengthens to about 2035 (approximately the 1.5 °C warming level, when r = −0.63), followed by a progressive abatement until the end of the 21st century (r = −0.6 at +2 °C, and −0.24 at +3 °C). The other panels of figure 2 display the same ENSO-related surface and low-tropospheric anomalies shown in figure 1 but at different warming levels. From present-day to +1.5 °C, the El Niño-related warm SST anomalies over the equatorial Pacific are larger and more zonally extended, with a secondary maximum appearing around 110°W (figure S2(a)). Consistently with the SST changes, deep convection enhances over the central equatorial Pacific, while it is further suppressed over the western basin (figure 2(b)). Concurrently, the high-pressure anomaly over the western Pacific, the key component of the PEA pattern, strengthens and stretches northeastward, forming an additional anomalous anticyclone over the central subtropical Pacific (figure 2(c)). In turn, the anomalous North Pacific cyclone shifts eastward and reduces in spatial extent, while a widespread low-pressure anomaly forms over northern Asia and the northwestern Pacific. This results in intensified near-surface south-westerly winds (cf figures 2(b) and 1(e)) and precipitation along the East Asian coast and the South China Sea, while to the west dry northwesterlies lead to drier conditions over central-eastern China (figures S3(b) and (c)). From +1.5 °C to +2 °C, the El Niño-related warming and convection maxima intensify and shift westward, while anomalies weaken to the east (figures S2(b) and 2(d)). Concurrently, the anticyclone over the western Pacific weakens and shifts northwestward, associated with a westward extension and intensification of the anomalous cyclone as compared to +1.5 °C (figures 2(c) and (e)). Weaker and more southward confined southwesterlies blow along the East Asian coast. Despite the reduced wind magnitude, the stronger southerly component brings more moisture to eastern China and the East China Sea, resulting in excess precipitation (figures S3(c) and (d)). At +3 °C, the core El Niño-related warm SST and deep convective anomalies shift further westward while weakening and expanding meridionally as compared to +2 °C, accompanied by increased SSTs over the eastern equatorial Pacific (figures 2(f) and S2(c)). The subtropical anticyclone expands over Southeast Asia, while a deeper low-pressure system stretches across the entire extratropical Pacific (figure 2(g)). The weaker sea-level pressure gradient over the South China Sea results in a more confined and weaker southwesterly flow (figure 2(f)), and the precipitation reduction along the East Asian coast (figure S3(e)). Variations in the upper-tropospheric circulation patterns (e.g. the 200 hPa divergent circulation) (figure S4) are consistent with the underlying SST and convective heating anomalies from present-day to +3 °C.

Figure 2. (a) The 21 year sliding correlations between the Niño3.4 index and the EAWMI during 1970–2098. The Niño3.4 and EAWMI time series were high-pass filtered (by subtracting the respective 11 year running mean time series) prior to computing the correlations in order to reduce the influence of any long-term (non-linear) trend. Yellow, green, blue and red areas represent the reference (1984–2004), 1.5 °C, 2 °C and 3 °C warming periods, respectively. The horizontal dashed line denotes the 95% significant level. Bottom six panels as in figure 1, but for the three warming levels above pre-industrial times along the RCP8.5 scenario: +1.5 °C (b) and (c); +2 °C (d) and (e); +3 °C (f) and (g).
Download figure:
Standard image High-resolution imageFollowing previous findings (Kumar et al 1999, Ashrit et al 2001, Yan et al 2019), we investigate whether the strength of the ENSO–EAWM relationship during a certain 21 year period is modulated by the corresponding background climate conditions. Each 21 year time interval (present-day and four warming periods) is characterised by a pair of (x, y) values, one for r(Niño3.4, EAWMI) and one for the climatological mean of either the Niño3.4 SST or the EAWMI. These pairs are displayed in figure 3(a) as scatterplot (see for example Yan et al (2019) for a use of this method, albeit in the context of linking climatology and interannual variability in CMIP5 models). The spread of the points around the least-squares fitting line allows us to determine the linearity of the relationship, while its strength is quantified by computing the linear correlation among the variables on the x- and y-axis. Similarly, the spatial patterns of surface air temperature (SST over the ocean) and 1000 hPa meridional wind associated with changes in the EAWM–ENSO relationship at various warming levels are derived by linear regression on the r(Niño3.4, EAWMI) series (figure S5). These indicate that changes in variability are strongly linked to those in the mean state and, specifically, a weaker ENSO-EAWM correlation tends to be significantly (r > 0.94, p < 0.05) associated with larger mean cooling over the central Pacific and stronger northerlies over the South China Sea.

Figure 3. (a) Scatterplot of r(Niño3.4, EAWMI) and two position indices for the reference and four warming periods. The +2.5 °C warming level is added in order to better identify the transition to +3 °C. The position indices are the climatological SAT minus its domain-mean (40°N–20°S, 90°E–90°W) averaged over the Niño3.4 region (black line) and the EAWMI (red line), respectively. The magnitude of the domain-mean SAT for the reference and four warming periods is 23.2 °C, 23.8 °C, 24.3 °C, 24.7 °C and 25.1 °C. The solid lines represent the least-square lines, and the numbers in the upper-right corner are the corresponding determination coefficients. Differences in the climatologies of (b) and (c) SAT minus domain-mean, (d) and (e) SLP and UV850 (vector), between (b) and (d) +1.5 °C and reference period, (c) and (e) +3 °C and +1.5 °C. Red and black rectangles are the same as in figure 1.
Download figure:
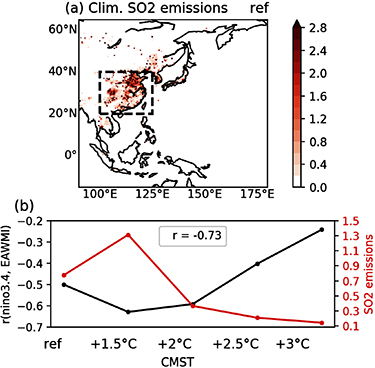
Standard image High-resolution imageWe now turn to the examination of the changes in the climatologies between different periods in figures 3(b)–(e) to investigate the physical mechanisms underlying the association identified in figure 3(a). In particular, we examine the differences between +1.5 °C and present-day (figures 3(b) and (d)), when the ENSO–EAWM relationship strengthens, and between +3 °C and +1.5 °C (figures 3(c) and (e)), which corresponds to the overall weakening of the ENSO–EAWM relationship with global warming exceeding +1.5 °C. Under moderate warming (from present-day to +1.5 °C), r(Niño3.4, EAWMI) increases in response to changes in the climate mean state brought about by regional negative anthropogenic aerosol forcing. The temporal variation of the latter can be qualitatively inferred by inspecting figure 4, which shows the changes in East Asian anthropogenic emissions of SO2, the predominant aerosol component over China (Lu et al 2011), during the 21st century. Other species (i.e. black carbon, organic carbon) show a similar temporal evolution (not shown). Figure 4(b) indicates that under the RCP8.5 scenario, SO2 emissions display a clear increase from present-day to +1.5 °C over East Asia. Despite the additional global warming, anomalous cooling and anticyclonic circulation anomalies appear over Southeast Asia at +1.5 °C compared to present-day (figures 3(b) and (d)). Previous studies (e.g. Bartlett et al 2018, Wilcox et al 2019) have shown a link between increased East Asian aerosols and surface circulation anomalies consistent with the ones found here. The anomalous near-surface southeasterlies over the South China Sea weaken the climatological-mean EAWM circulation, making it more susceptible to the ENSO modulation.
Figure 4. (a) Climatological total SO2 emissions (1010kg m− 2 s−1) during the reference period. The major East Asia emission region is enclosed by the black dashed area (20°–40°N, 100°–125°E). (b) Variations of r(Niño 3.4, EAWMI) (black solid line) and area-averaged total SO2 emissions (1010kg m−2 s−1; red solid line) over the East Asia along GMST anomalies relative to pre-industrial levels (from the reference to enhanced warming levels). The number in the top is the correlation coefficient of these two series.
Download figure:
Standard image High-resolution image
As the climate warms above +1.5 °C, r(Niño3.4, EAWMI) weakens as a result of changes in both the climate mean state across the Asian-Pacific region and the ENSO pattern itself. The former mechanism entails tropical-extratropical coupled ocean-atmosphere feedbacks, triggered by enhanced SST warming in the eastern equatorial Pacific (east of 120°W) at +3 °C (figure 3(c); Wang et al 2017, Cai et al 2015). This warming is associated with an intense and wide anomalous anticyclone across the subtropical Pacific (figure 3(e); e.g. Gan et al 2017). On the southern flank of this anticyclone, stronger trade winds lead to cooler SST in the central northequatorial Pacific by increased evaporation (e.g. Wang et al 2000). A deeper Maritime Continent low results likely from both local warmer SSTs and vertical ascent related to the central Pacific cooling via a local closed circulation cell (e.g. Wang et al 2000). Ultimately this leads to intensified low-tropospheric northerlies over the South China Sea and thus to a stronger EAWM. As a result, the effect of ENSO on a stronger monsoon is reduced. The latter mechanism acts directly on interannual time scales, and stems from the westward extension of the ENSO pattern (i.e. the enhanced zonal thermal contrast between the warmer western equatorial Pacific and the cooler central basin) (figure 3(c); Cai et al 2015). Consequently, the ENSO-driven anomalous anticyclone in the western Pacific (the PEA teleconnection pattern) also shifts westward, leading to weaker anomalous southerlies over the East Asian coast and thus to a reduced ENSO signal (figure 2). Note that East Asian aerosol emissions decrease when global warming exceeds 1.5 °C (figure 4(b)), and thus their impact further enhances—not opposes—the warming from increased greenhouse gases. Overall, the close association between r(Niño3.4, EAWMI) and East Asian aerosol forcing is illustrated by the significant correlation coeffcient of their time series (0.73), as shown in figure 4(b).
4. Discussion and conclusions
This study investigates changes in the ENSO–EAWM relationship at various global warming levels throughout the 21st century under the RCP8.5 pathway. We use the MPI-GE experiments which allow us to more robustly characterise the role of external forcing by averaging over the large ensemble and thus largely removing the influence of internal climate variability. We find that the strength of the ENSO–EAWM relationship, as represented by the temporal correlation between the Niño3.4 index and a circulation-based EAWM index, increases from present-day to +1.5 °C, and then weakens until +3 °C. The core El Niño-related SST warm anomaly intensifies with global warming; additionally, above +1.5 °C, it shifts westward and extends meridionally. The associated convection anomalies instigate a change in the PEA teleconnection pattern: the surface anomalous anticyclone over the western tropical Pacific strengthens at +1.5 °C, then moves northwestward with additional warming, covering the East Asian coast at +3 °C. The upper-level circulation anomalies are characterised by a modulation of the zonal and meridional circulation cells over the western Pacific, consistently with the surface anomalies. These variations are also accompanied by an ENSO-forced anomalous tri-pole circulation pattern in the North Pacific–North American sector, with a prominent cyclone in the Aleutian low region, resembling the Pacific–North America pattern (e.g. Wallace and Gutzler 1981, Zhou et al 2014, Jo et al 2015). Changes in the ENSO–EAWM relationship are closely associated with those in the background mean state of both ENSO and the monsoon. From present-day to +1.5 °C, changes in East Asian anthropogenic aerosols are crucial to explaining the strengthening of the ENSO–EAWM relationship by inducing anomalous regional cooling and near-surface anticyclonic flow. Above +1.5 °C, the deepening of the climatological Maritime Continent low and subsequent strengthening of the EAWM, as well as the westward shift of the ENSO pattern contribute to weakening the ENSO–EAWM relationship.
To ascertain whether internal variability of the climate system may also modulate the ENSO–monsoon relationship in addition to anthropogenic external forcing, we repeat the regression analysis for the differences between each of the 100 ensemble members and the ensemble mean, and then calculate the average anomalies from the 100 regression patterns. Figure S6 displays these anomalies for surface temperature and near-surface circulation. The internally generated component of the ENSO–EAWM relationship is weaker than the externally forced counterpart for present-day (figure 1), and its magnitude consistent with that estimated using the pre-industrial control experiment (figure S7(a)). Also, the contribution of internal variability is constant as global warming increases throughout the 21st century up to +2 °C, with the slight weakening trend at +3 °C possibly due to non-linear interactions with external forcing. Overall, this suggests that there are minor interdecadal variations of the ENSO–EAWM relationship due to internal variability during the 21st century (see also figure S7(b)). A comparison between figures S6(g) and 2(f) indicates that the internally and externally generated components are relatively weak and of comparable magnitude at +3 °C. This suggests that, under elevated warming, there will be a comparatively more important contribution of internal variability, including the influence of large-scale atmospheric patterns such as those originating in the Northern Hemispheric mid-latitudes or the Arctic, in influencing the EAWM circulation.
It is reasonable to ask whether using 21 year intervals, instead of longer ones, may actually reflect the interdecadal variability of the ENSO–EAWM relationship rather than the effect of progressive warming throughout the 21st century. Note that using very long periods will include years in which warming is both far smaller and far greater than the targeted threshold. The sliding correlation between ENSO and the EAWM using windows of both 31 and 41 years (figure S8) and the corresponding anomalous patterns (not shown) display remarkably similar changes during the 21st century, indicating that our results are robust to variations of the length of the sampling window. A close inspection of figures 1 and 2 helps to ascertain, at least qualitatively, the potential influence of using different EAWM indices by allowing us to infer the ENSO-related variations of key atmospheric variables on which several commonly used indices are based (e.g. the negative meridional wind at 850 hPa (Yang et al 2002), the sum of zonal sea level pressure differences (Wu and Wang 2002)). The consistency between these changes and those of the 1000 hPa wind indicates that our main conclusions are robust to the choice of the monsoon index.
Although this study benefits from the availability of a large number of ensemble members, the results will need to be confirmed by the analysis of other large single-model ensembles as well as the new CMIP6 experiments. This may also help to investgate the influence of model shortcomings in the simulated ENSO features on the link with the EAWM. Further investigations should also take into consideration, for example, inter-model differences in simulating the present-day and future ENSO characteristics as well as the interdecadal fluctuations of the strength of the ENSO–EAWM relationship (Wang et al 2013, Maher et al 2018, Zheng et al 2018). Given the large uncertainties associated with the future evolution of anthropogenic aerosols and their climate interactions, their role in modulating the ENSO–EAWM relationship should be further investigated. Despite some limitations, the varying spatial circulation patterns over East Asia associated with the ENSO–EAWM relationship at different warming levels found here translate into large spatial variability of near-surface temperature across China, with important consequences for planning and adaptation to global warming.
Acknowledgments
We acknowledge the use of data from MPI-GE (https://esgf-data.dkrz.de/projects/mpi-ge/), ERA-I (www.ecmwf.int/en/forecasts/datasets/reanalysis-datasets/era-interim), NOAA (https://psl.noaa.gov/data/gridded/data.interp_OLR.html) and GPCC (https://opendata.dwd.de/climate_environment/GPCC//html/fulldata-monthly_v2018_doi_download.html). MAB was supported by the UK‐China Research and Innovation Partnership Fund through the Met Office Climate Science for Service Partnership (CSSP) China as part of the Newton Fund, as well as by the Natural Environment Research Council (NE/N006038/1). CL was supported by the National Key Research and Development Program of China (Grant No. 2018YFA0606501). We thank two anonymous reviewers for their helpful comments.
Data availability statement
No new data were created or analysed in this study.