

Abstract
Distinguishing between natural forests from exotic tree plantations is essential to get an accurate picture of the world's state of forests. Most exotic tree plantations support lower levels of biodiversity and have less potential for ecosystem services supply than natural forests, and differencing them is still a challenge using standard tools. We use a novel approach in south-central of Chile to differentiate tree cover dynamics among natural forests and exotic tree plantations. Chile has one of the world's most competitive forestry industry and the region is a global biodiversity hotspot. Our collaborative visual interpretation method combined a global database of tree cover change, remote sensing from high-resolution satellite images and expert knowledge. By distinguishing exotic tree plantation and natural forest loss, we fit spatially explicit models to estimate tree-cover loss across 40 millions of ha between 2000 and 2016. We were able to distinguish natural forests from exotic tree plantations with an overall accuracy of 99% and predicted forest loss. Total tree cover loss was continuous over time, and the disaggregation revealed that 1 549 909 ha of tree plantations were lost (mean = 96 869 ha year−1), while 206 142 ha corresponded to natural forest loss (mean = 12 884 ha year−1). Mostly of tree plantations lost returned to be plantation (51%). Natural forests were converted mainly (75%) to transitional land covers (e.g. shrubland, bare land, grassland), and an important proportion of these may finish as tree plantation. This replacement may undermine objectives of increasedcarbon storage and biodiversity. Tree planting as a solution has gained increased attention in recen years with ambitious commitments to mitigate the effects of climate change. However, negative outcomes for the environment could result if strategies incentivize the replacement of natural forests into other land covers. Initiatives to reduce carbon emissions should encourage differentiating natural forests from exotic tree plantations and pay more attention on protecting and managing sustainably the former.
Export citation and abstract BibTeX RIS

Original content from this work may be used under the terms of the Creative Commons Attribution 4.0 license. Any further distribution of this work must maintain attribution to the author(s) and the title of the work, journal citation and DOI.
1. Introduction
Differentiating natural forests from exotic tree plantations at large scales represents a global relevant issue because different tree covers may produce disparate estimations of changes in local biodiversity and in relevant ecosystem services such as climate regulation, carbon storage, and water supply (Hall et al 2012, Van Holt et al 2012, 2016, Viña et al 2016, Lewis et al 2019). However, this still constitutes a technical challenge for the remote-sensing communities (Zhao et al 2016, Curtis et al 2018).
Evidence has demonstrated that exotic tree plantations are rather distinct from natural forests in their role in terms of biodiversity conservation, ecosystem services, and the social impacts that they provide (Reyes et al 2015, Naudts et al 2016, Jones et al 2017, Martínez-Jauregui et al 2018, Lewis et al 2019). Therefore, these tree cover types need to be carefully differentiated, especially in areas with high conservation values, where it has many implications for biodiversity and human wellbeing (Newbold et al 2016).
Current policy discourses related to forest conservation, and particularly to restoration, use or imply the forest definition by the United National Food and Agricultural Organization (FAO), which aggregates natural forests and exotic tree plantations (FAO 2010). Under this definition, exotic tree plantations are under intensified forestry management and some authors point out that could be classified as 'tree farms' (Van Holt and Putz 2017, Curtis et al 2018). However, misclassification of natural forests and exotic tree plantations could bring misinterpretation in environmental policy and social impact evaluation (Van Holt and Putz 2017, Hua et al 2018), as tree plantations are typically subjected to intensified forestry management practices that cause environmental impacts similar to those produced by intensive agriculture (Karp et al 2012, Naudts et al 2016, Lewis et al 2019, Heilmayr et al 2020, Osuri et al 2020).
Under the FAO definition (2015), not all forests contribute to climate change mitigation (Naudts et al 2016). Planting trees, and particularly some conifer species for fast growth tree plantations, is not enough to stave off global warming (Lewis et al 2019). Given the current global challenge of forest restoration (Chazdon and Brancalion 2019) it is paramount to accurately discriminate between natural forests and tree plantations. For instance, China reported a significant increase in forest cover in around 1.6% of its territory (Viña et al 2016). However, native forests are not returning and this forest recovery was mostly due to exotic tree plantations (Van Holt and Putz 2017). Moreover, while net tree cover in southwestern China grew by 32% (2000–2015), this increase was mainly due to the conversion of croplands to tree plantations, but tree plantations also displaced native forests with a gross loss of 6.6% (Hua et al 2018).
The biggest effort to assess tree cover change is the global database developed by Hansen et al (2013), who mapped annual global tree cover loss and gains from 2001 to 2018 using Landsat satellite program. Based on this dataset, several studies have assessed the global and local forest changes in a number of places/countries (Viña et al 2016, Heilmayr et al 2016, Potapov et al 2017, Curtis et al 2018, Hua et al 2018). At a global scale, the main driver of tree cover loss is associated to permanent land use change for commodity production like forestry and agriculture (Curtis et al 2018). But not considering the natural or productive character of these forests can lead to a substantial misestimation of the natural forest loss (Tropek et al 2014), compromising its value for local and global policy decisions.
Identification of different types of forests using Hansen et al (2013) dataset is mainly based on tree cover percentage (Tyukavina et al 2018) or in combination with forest height maps derived from LIDAR images (Yu et al 2020). However, those criteria do not differentiate natural forests from tree plantations. In this work, we use a novel approach to illustrate the importance of accurately discriminating natural forests from tree plantations when quantifying tree cover losses. We use a method which can be applied to large-scale land cover monitoring. We use a collaborative augmented visual interpretation method that uses the Hansen et al (2013) database, the Google Earth-Engine platform, high-resolution satellite images, and expert knowledge through networking collaboration (figure 1).
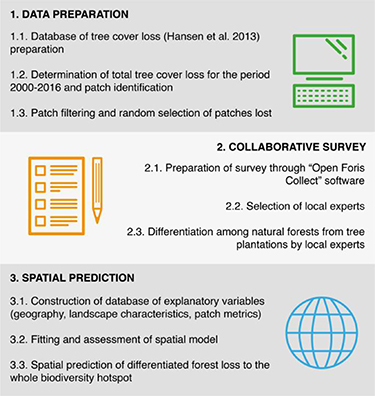
Figure 1. Workflow of the methodological framework.
Download figure:
Standard image High-resolution imageThe method is tested in south-central Chile, which is one of the global leaders in pulp production from exotic tree plantations (Cubbage et al 2007), and also classified as a global biodiversity hotspot (Mittermeier et al 2004). This area harbors the last confined and endangered sclerophyllous and temperate forests of South America. Our method was applied for the period 2000–2016. We discuss the implications for global and large-scale tree cover monitoring, by providing an accurate, cost-efficient, and replicable tool, which can be useful for future biodiversity conservation and climate mitigation actions.
2. Methods
2.1. Study area
The Chilean biodiversity hotspot, also called 'Chilean winter rainfall–Valdivian forests' (25°–47°S) (Arroyo et al 2004) covers about 400 000 km2 (figure 2). It comprises half of the temperate forests in the southern hemisphere, but also suffers the greatest land-use-change pressure in the country due to the high concentration of economic activities in Chile (Miranda et al 2017). This area comprises 79% of the country's urban and industrial zones, 94% of its agriculture, and 98.7% of the total exotic tree plantation extent (mostly Pinus radiata and Eucalyptus spp.) (CONAF 2011). In this hotspot, natural forests cover approximately 9.5 millions of ha (Zhao et al 2016), which are distributed mainly from 33°S southwards (figure 2(A)). In the country the last official figure of exotic forest plantations is equivalent to 3.1 millions of ha (CONAF 2019).
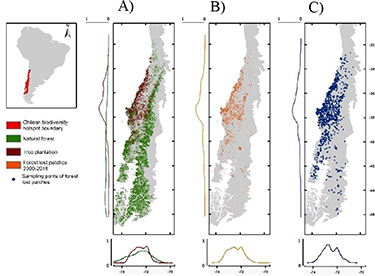
Figure 2. Map of (A) the current distribution of natural forest and exotic tree plantations (Zhao et al 2016), (B) whole tree cover loss by Hansen et al (2013) updated to 2016, and (C) the distribution of sampling points on tree cover loss patches in the study area. Plots represent latitudinal and longitudinal density distribution of land cover-types in each map.
Download figure:
Standard image High-resolution image2.2. Data source of tree cover loss
We use the updated tree cover loss database developed by Hansen et al (2013) (available at https://glad.umd.edu/dataset). This global database has a high spatial resolution (30 m) of annual tree cover change. We used the tree cover loss product (patches lost) for each year between 2000 and 2016. We applied an image filtering technique to eliminate tree loss patches smaller than 0.27 ha, and the eight-cells neighborhood rule (Mcgarigal et al 2012). We use the defined forest loss as a 'stand replacement disturbance' (Hansen et al 2013), meaning the removal or mortality of all tree cover in a Landsat pixel with more than 50% of tree crown cover.
2.3. The collaborative survey
We performed a random sampling through a survey to differentiate tree cover loss between natural forest and exotic tree plantation, and identify the contributors of change (i.e. the land cover type after forest loss), for the whole period. The sampling considered a total of 2623 points in patches of tree cover loss (figure 1(C)). To get a representative sample of each loss patch, five points were randomly distributed in each accumulated forest loss patch for the whole period which was constrained to the patch size (minimum distance among sample points was 30 m). Therefore a total of 1219 patches were sampled.
The total sample points were distributed between ten local experts who were selected given their expertise on remote sensing and on land use/land cover monitoring. Each expert received a minimum of 250 sample points and all instructions and files to undertake the survey.
Based on their experience each local expert identified at each sample point the land-cover type prior to tree cover loss (i.e. natural forest and tree plantation), but was not possible to distinguish the species of origin. After that, at the same sample point, the expert identified the land-cover type in the last year of the period (2016), among the following options: natural forest, exotic tree plantation, cropland, grassland, settlement, wetland, shrubland, bare land, and other land (appendix 1, which is available online at https://stacks.iop.org/ERL/15/124055/mmedia). Local experts also identified errors associated to no presence of tree cover loss in Hansen et al (2013) database, and all these points were discarded from the final analysis and the spatial and temporal variations of cover loss.
We tested the sensitivity of our results to assess the variation of land cover identification according to the sample size (appendix 3). Furthermore, we assessed the accuracy of the local experts to differentiate between 'natural forest' and 'tree plantation'. We collected a total of 450 independent points from fieldwork on natural forest and tree plantation. We randomly selected 100 of these field points (50% of each land cover). All local experts received the same sample points and identified the land-cover type on each one. We compared the relationship between known reference data (field points) and the results of the local expert identification for accuracy estimation. Additionally, we measured agreement among experts using Fleiss' kappa (K), which measures reliability among a group of experts. We calculated K using the R software package irr (Gamer et al 2014).
The survey was designed through Augmented Visual Interpretation and implemented in 'Open Foris Collect' software (www.openforis.org/tools/collect.html) (Bey et al 2016). This platform is open source and provides a flexible solution for data management, allowing full customization of survey structure, variables, and data checks. To apply the survey, we used 'Collect Earth', which is a free and open source tool for land monitoring that uses Google Earth and Google Earth Engine, and was developed by FAO (Bey et al 2016). For land cover identification of each local expert we mostly used historical Google Earth images but in years with no availability of these images we used Landsat images.
2.4. Natural forest and tree plantation losses estimation
We estimated the tree cover loss area in the whole hotspot distinguishing between tree plantation and natural forest loss for the entire period using boosted regression trees. For the training data set we use one sample per patch (discarding all duplicate samples in a patch) which is equivalent to a total of 1219 samples. Then, on that way the samples are relatively spatially independent. The decision trees were generated first by linking the potential explanatory variables to the response variables. As response variable we used the binary variable of forest loss (natural forest = 1, and tree plantation = 0). We specified three parameters to fit the model: tree complexity (5), learning rate (0.01), and bag fraction (0.8). We constructed a set of environmental variables maps as explanatory variables from spatially-explicit data on geography, landscape characteristics, and tree cover loss patch metrics (appendix 2). The environmental explanatory variables were: latitude, longitude, elevation, slope, distance to cities, distance to villages, distance to roads, and different patch-lost metrics (year loss, area, perimeter, area/perimeter, and perimeter/area). We thus examined the correlation matrix of all these explanatory variables and excluded those that were highly correlated (|r| > 0.6) to avoid multicollinearity.
This technique generates many regression trees that are combined into one ultimate regression tree model, boosting the ultimate model's accuracy and predictive performance (Elith et al 2008). After training the model, a validation accuracy score estimates the performance of the model on an independent dataset (20%). When the dataset of observations are divided into k disjoint subsamples (or folds), then is taken a group as a hold out or test dataset and the remaining groups as a training dataset, this procedure is known as K-fold cross-validation. In our study, we adopted the latter procedure (with K = 5) to validate, to avoid overfitting and to estimate the average classification. Then, the majority of model predictions were applied across all study area.
We calculated usual measures of model performance as the Area under the ROC curve (AUC), the correlation between the observed and predicted values, sensibility and sensitivity (Shabani et al 2016). Sensitivity is the percentage of positive observations that are correctly classified whereas sensibility is the percentage of negative observations that are correctly identified. AUC assess the overall accuracy of the classifier's performance. AUC value near 0.5 means that the predictive ability of the model is completely random and a value of 1.0 represents a perfect prediction without misclassification.
We assessed the uncertainty of the model estimations across the latitudinal gradient of the study area. The model estimates the relative influence of each explanatory variable. We thus chose those explanatory variables with ≥4% of influence in BTR models (a strong relationship with the response variable). The influence was based on the number of times a variable was selected for splitting, weighted by the squared improvement to the model as a result of each split, and averaged over all trees (Elith et al 2008). We fitted the model using the dismo package implemented in R (R Development Core Team 2016).
3. Results
Total tree cover loss in the entire Chilean biodiversity hotspot for the period 2000–2016 was 1 756 052 ha (109 753 ha year−1 in average). Overall, there was a continuous increment in tree cover loss during the whole period, ranging from approximately 70 000 ha year−1 in 2001–160 000 ha year−1 in 2016 (figures 2(B) and 3). The main contributors of change (i.e. the land-cover types after tree cover loss) were tree plantation (44%), bare land (36%), and shrubland (11%).

Figure 3. Annual tree cover loss in the Chilean hotspot according to Hansen et al (2013) updated database.
Download figure:
Standard image High-resolution image3.1. Land cover classification accuracy assessment
The global assessment of local experts showed high accuracy values for differentiation between natural forest and exotic tree plantation, as well as for the other land covers. Mean global accuracy from the independent field samples applied to the ten local experts was 99% (natural forest and exotic tree plantation rised 99% and 98% respectively). This result was consistent with Fleiss' Kappa analysis where K = 0.95. Sensitivity analysis showed that the influence of sample size variation on land-cover type identification prior and after the tree cover loss decreases as sample size increases (appendix 3).
3.2. Tree cover losses
Based on the sampling, most of tree cover loss turned to exotic tree plantations in the whole time period (2000–2016), explaining 85% of the tree patches lost, while only 15% of the samples were natural forests loss. These tree plantations lost mostly returned to be plantation (51%), even in some cases they were changed to bare land (38%), grassland (5%), shrubland (5%), and other land-cover types (1%). On the contrary, natural forests were converted mainly to shrubland (40%), bare land (27%), grassland (11%), cropland (10%), tree plantation (7%), and other land covers (5%) (see examples in appendix 4).
Total tree cover loss was mostly concentrated in the north-central area of the hotspot (the peak at 37°S) (figure 4). However, there was a skewed longitudinal pattern towards the coastal range, which is consistent with the peak of spatial distribution of tree plantation (figure 2). Natural forest loss was more scattered throughout the region in most time periods, though it was more evident further south.

Figure 4. Map of sample points by type of tree cover loss and period (red points = tree plantation, green points = natural forest).
Download figure:
Standard image High-resolution imageOverall, tree plantation and natural forest showed an increasing pattern of tree cover loss during the whole period (figure 4, appendix 5). Tree plantation clear cutting was relatively constant until the period 2012–2013. However, from the period 2014–2015 onwards it increased substantially. Natural forest loss remained relatively constant with minor fluctuations until 2010, then increased, first steadily, and after 2013–2014 more sharply (appendix 5).
3.3. Disaggregating tree cover losses
Our model to predict disaggregated tree cover loss in the whole study area obtained high accuracy under different indicators (table 1). It is especially relevant the high AUC using train and cross-validation data. Model performance results were consistent due to the high values of correlation, sensibility and sensitivity, the last ones over 85%.
Table 1. Model performance statistics for boosted regression tree model of disaggregated tree forest loss prediction. s.e. = standard error for cross-validation.
| Indicator | Training | Cross-validation | s.e. |
|---|---|---|---|
| AUC | 0.98 | 0.96 | 0.02 |
| Correlation | 0.94 | 0.87 | 0.02 |
| Sensibility (%) | 98 | 92 | 1.84 |
| Sensitivity (%) | 97 | 85 | 1.71 |
Our initial model was reduced to five main explanatory variables (appendix 6), with far latitude the most influencing variable (73%). Other relevant variables were longitude (10%), elevation (9%), perimeter/area relationship (4%), and distance to cities (4%).
The disaggregation of total tree cover loss in the study area revealed that from the total 1 756 052 ha, 1 549 909 ha corresponded to tree plantation loss (mean = 96 869 ha year−1), while 206 142 ha corresponded to natural forest loss (mean = 12 884 ha year−1). The spatial pattern of disaggregated tree cover loss predictions (figure 5) showed the same pattern of the sample points, which also indicated the consistence of our results. Uncertainty of estimations across the whole latitudinal range of the study area showed low error. Higher error are located in the southern area, however the maximum error remains being lower than 10% (appendix 7).
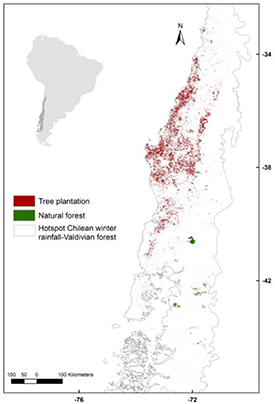
Figure 5. Map of spatial predictions of tree cover loss disaggregated by forest plantation and natural forest.
Download figure:
Standard image High-resolution image
4. Discussion
4.1. Natural forest and tree plantations losses
We present an application to test disaggregation of tree cover loss into natural forests and tree plantations in a representative place, where forestry is a relevant economic activity. Chile is one of the top ten countries in the world in terms of land dedicated to forestry based on exotic tree plantations and the fifth in the Americas (Cubbage et al 2007), with 3.2 million ha (CONAF 2019). Moreover, forestry has been estimated as the main driver of tree cover loss. In particular, in Europe, North America, Russia/China/South Asia, and Australia/Oceania it represents 99%, 56%, 41%, and 29% of tree cover loss respectively (Van Holt et al 2016, Curtis et al 2018).
We differentiated tree-cover loss among natural forest and exotic tree plantation with high accuracy. This is not an easy task, especially at large scales given the difficulties of remote sensing techniques and data. The main reason of that is because tree plantations are easily visible on the satellite images given its homogeneous structure (Wang and Huang 2012, Van Holt et al 2016) which local experts are able to identify. Our method takes advantage of freely available data and remote sensing techniques combined with expert local knowledge that have the potential to reproduce the analysis for any region in the world. Moreover, our results illustrate well the advantages of combining remote-sense measurements and expert knowledge than to use remote-sense technology alone (Cayuela et al 2006, El Hajj et al 2009, Huang and Jia 2012, Mialhe et al 2015). In this sense, we provide transparent, comprehensive, confident and a cost-efficient data-set given its several advantages of this approach as stability, replicability, easy to share, testable and low cost.
Based on the sampling, we also found that the most important contributor of whole tree cover loss is tree plantation, which account for 44% of total tree cover loss. When we separate the tree cover loss, more than 50% of tree plantation loss finished as tree plantation at the end of our assessment period, and this pattern is consistent with last global assessment (Curtis et al 2018). After tree cover loss some land cover types are transitional (i.e. bare land and grassland), but usually and in particular in Chile these land cover types represent a stage in the intensive harvesting activities of the tree plantation dynamic (Aguayo et al 2009, Patterson and Hoalst-Pullen 2011). Therefore, it would be likely that most tree plantation remain over time with the same land use type. Also is important to highlight that the main drivers of forest plantations loss can be associated to both harvesting and fires which we have not differentiated. Further research is needed about this topic and especially about the underlying causes of tree plantation and natural forest loss given that both are related to different dynamics of change.
Natural forest loss continues to be an important concern in one of the most endangered areas worldwide, where our results show that approximately 13 000 ha year−1 are replaced by shrublands, bare lands, grasslands, croplands, and exotic tree plantations. This result contradicts some research pointing out that the expansion of planted forests has the potential to reduce pressure on natural forests (Köhlin and Parks 2001, Kauppi et al 2006). Other studies support our findings and shows that exotic tree plantation expansion has resulted in a contraction of natural forests (Heilmayr 2014, Sloan and Sayer 2015, Van Holt et al 2016, Miranda et al 2017, Hua et al 2018) and can potentially increase deforestation in certain regions (Pirard et al 2016). After natural forest loss, transitional land cover types (e.g. shrubland, bare land, grassland) can be found which will finish as permanent ones (e.g. agricultural crops, tree plantation). These transitional land cover types account for more than 75% of natural forest loss. An important proportion of these may finish as tree plantation as illustrated by several examples (Aguayo et al 2009, Patterson and Hoalst-Pullen 2011, Altamirano et al 2016, Austin et al 2019).
4.2. Implications for public policies on forest management and restoration
Inconsistences in terms of the information and applied monitoring methods are recognized by FAO for national forest monitoring systems (Macdicken 2015). This is particularly important in Chile, where the Global Forest Resources Assessment report indicated a net increase of natural primary forests from 4 631 000 (1990) to 5 355 000 ha (2015), and other natural regenerated forest from 8 925 000 to 9 336 000 ha (FAO 2014). Our results highlight the implications of information misinterpretation, and represent an opportunity for local, but also global policies related to forest management and conservation and large-scale forest monitoring.
Increasing the world's forest cover have been settled as the most important goal for fighting against and adapting to climate change (Chazdon 2014, Bastin et al 2019, Lewis et al 2019, Carey 2020). But the current forest restoration strategies at landscape scales (and even larger), including different activities (e.g. from strict restoration to monoculture of tree plantations), may have different impacts on biodiversity, carbon, water, and eventually on human wellbeing (Chazdon and Brancalion 2019, Lewis et al 2019). Therefore, negative outcomes for the environment could result if strategies incentivize exotic tree plantations establishment. In this context, differentiating the cover dynamics of natural forests and exotic tree plantations is highly relevant.
Current sectorial policies supporting forest restoration ignore the links between biodiversity, water, soil retention and timber-production (Latawiec et al 2015). With so many multiple benefits, regrowing forests would be seen as a means for achieving goals related to sustainability and human livelihoods (Chazdon et al 2017). But to achieve this, new forest visions should be encouraged based on a more comprehensive understanding of the ecological landscape impacts of managing natural forest and tree plantations, and eventually built a better base for developing more efficient economic compensating mechanism to ensure the multiple functions and benefits these tree covers may provide (Chazdon and Brancalion 2019).
Our results can be useful to build capacity for land monitoring and to improve our collective understanding of forest loss dynamics at global scale, and even more it can be expanded to other conflicts of land use and land cover change. For instance, it could be used to check FAO statistics in places where we are unsure or/and accessibility is limited. Currently, forest certification covers an important area of world managed forests and tree plantations (FSC 2018) but it requires accurate monitoring systems. The current climate change crisis and the related forestry agendas (e.g. REDD+ and Aichi Targets for 2020) require critical revision in global policy discussions, and at the same time an accurate and specific land monitoring system which can help to prevent the growing problem of green grabbing in land use (e.g. Zhao et al 2014, Scheidel and Work 2018).
Chile has currently proposed its goal of National Determined Contribution to face the climate crisis, but the current proposal for reducing greenhouse gas emissions inadequately addresses forest management mainly through tree plantations (Chazdon and Brancalion 2019, Duran and Barbosa 2019, Rudel et al 2019). The proposal considers to plant 200 000 ha of forests mainly oriented to tree plantations (approximately 130 000 ha). Tree plantation is not a permanent land cover as our results demonstrate, and this has serious implications for climatic goals given harvested systems, and carbon loss sequestered. Additionally, this target results clearly insufficient to counterbalance the forest loss area reported in this study. Initiatives to reduce carbon emissions should encourage differentiating natural forests from exotic tree plantations and pay more attention on protecting and managing sustainably the former. To advance towards a global monitoring system, effectively differentiate global tree cover loss should be an urgent goal as a climate change mitigation action and to face the current environmental global challenges.
Acknowledgments
This research was supported by funding from Fondecyt Grant No. 1171445 and Dirección de Investigación of Universidad de La Frontera. AM and CZ are thankful to ANID/FONDAP/15110009. AH thanks the support of ANID N° REDI170329 grant. Figures were refined by V Sontag (@illusscientia).
Data availability statement
The data that support the findings of this study are openly available at the following URL/DOI: http://www.lepfor.ufro.cl/?page_id=530.