


Abstract
In this study, the interdecadal change in the size of the Indo-Pacific warm pool (IPWP) and its connection with the intensity of the South China Sea summer monsoon (SCSSM) in May are investigated. The results show that the size of the IPWP experienced a marked interdecadal extension in the late 1980s, and its impacts on the SCSSM have also strengthened. Further analyses indicate that interdecadal changes in the connection between the IPWP and SCSSM variations are related to the changes in the atmospheric circulation anomalies over the tropical western Pacific due to the size of the IPWP. During 1951–1986, the IPWP was smaller than the climatologic size, which led to suppressed convection over the tropical western Pacific and easterly anomalies north of the equator. The Philippines and South China Sea (SCS) region was controlled by anomalous anticyclonic circulation, which was not conducive to the formation and development of the SCSSM. In contrast, during 1987–2018, the IPWP expanded significantly eastward. As a response to the IPWP size extension, convective activities were enhanced over the tropical western Pacific. Anomalous cyclonic circulation was located over the Philippines and SCS regions, which favored the enhancement of the SCSSM through wide westerly flow in the Bay of Bengal and tropical western Pacific. Moreover, it is shown that the interdecadally enhanced intraseasonal oscillations (ISOs) over the tropical western Pacific in the late 1980s also favored reinforcement of the SCSSM intensity.
Export citation and abstract BibTeX RIS

Original content from this work may be used under the terms of the Creative Commons Attribution 4.0 license. Any further distribution of this work must maintain attribution to the author(s) and the title of the work, journal citation and DOI.
1. Introduction
It is well known that the Indo-Pacific warm pool (IPWP) has the highest sea surface temperature (SST) in the world. The water around the Maritime continent has an SST higher than 28 °C, which is approximately 2 °C–5 °C higher than that of other equatorial oceans (Yan et al 1992, Lin et al 2013). The variabilities in the thermal state of the warm pool, including SST anomalies and size fluctuations, have been studied on multiple timescales (Li et al 2006, Wu and Zhang 2007, Chung and Li 2013, Zhou 2014, Huangfu et al 2015). At the interdecadal time scale, some studies have argued that the significant cooling of the warm pool SST in the late 1970s (Li et al 2006) and pronounced warming in the late 1990s (Chung and Li 2013, Huangfu et al 2015) contributed to the interdecadal shifts in the East Asian summer monsoon (EASM). Others found an interdecadal change in the western tropical Pacific SST anomalies in the late 1980s (e.g. Wu and Zhang 2007). However, these studies mainly focused on the SST variability in the IPWP, with limited research concentrated on the IPWP size fluctuation. Previous studies suggested that large and small warm pools have significant influences on atmospheric circulation and climate variability (Wang et al 2006, 2008, Misra et al 2016). An interdecadal shift in the size of the IPWP during June–October was discovered in approximately 1986 (Zhou 2014). Therefore, it is important to investigate the oscillation in IPWP size and its influences on climate variability in both surrounding and remote regions.
Previous studies suggested that the thermal states of the IPWP and convective activities play an important role in the variability in summer circulation in the Northern Hemisphere, including the EASM system variation (Nitta 1987, Huang and Sun 1992). Due to the warm state of the warm pool, the atmosphere-ocean interaction is very strong, which leads to stronger convective activity around the Philippines and an enhanced ascending branch of the Walker circulation (Cornejogarrido and Stone 1977, Hartmann et al 1984). The western Pacific subtropical high (WPSH) shifts northward and eastward through the East Asia/Pacific (EAP) teleconnection (Huang and Sun 1992). The East Asian monsoon trough retreats westward and creates convergence and cyclonic vorticity in the western North Pacific (Huang et al 2016). Therefore, a stronger-than-normal EASM and weak monsoon rainfall in the Yangtze River valley of China, Japan, and South Korea usually occur (Huang and Lu 1989, Huang and Sun 1992). In contrast, when the IPWP is in the cooling state, opposing atmospheric circulation anomalies and East Asia monsoon rainfall anomalies are observed.
As an important part of the EASM (Wang et al 2004), the variability and mechanism of the South China Sea summer monsoon (SCSSM) have been widely investigated based on datasets from the South China Sea Monsoon Experiment (SCSMEX) (Mao and Chan 2005, Zhou and Chan 2005, Wang et al 2009, Ding et al 2015, Huangfu et al 2017a, 2017b). For example, previous studies found a close connection between the thermal state of the tropical western Pacific and the onset date of the SCSSM from intraseasonal to interdecadal time scales (Huang et al 2006, 2016, Wang et al 2009, Huangfu et al 2015). (Huang et al 2016) indicated that when the tropical western Pacific is in a warming state in boreal spring, the WPSH shifts eastward, and convective activities over the Philippines are strengthened. Development of cyclonic circulation over the Bay of Bengal leads to intensified westerly flow over Sumatra and the South China Sea (SCS) and an early onset of the SCSSM. In contrast, the cooling state of the tropical western Pacific generally leads to a late onset of the SCSSM. Moreover, (Huangfu et al 2015) suggested that the interdecadal warming of the western Pacific warm pool results in an earlier outbreak of the SCSSM in the late 1990s by inducing stronger convection anomalies and weak WPSH in the early spring. Compared to the SCSSM onset date, relatively few studies have focused on the relation between the variability in the SCSSM intensity (Wu et al 2003, Wang et al 2009, Choi et al 2017) and the thermal state of the IPWP. (Choi et al 2017) found an enhancement in the SCSSM intensity during the mid-1990s and attributed it to strengthening of the Walker circulation and La Niña events. Whether the interdecadal change in the thermal state of the IPWP, especially its size variation, plays a role in strengthening the SCSSM intensity remains unclear. Here, we investigate the possible influences of a warming IPWP on strengthening the SCSSM to enhance our understanding of the mechanism of SCSSM variability, which is generally closely connected to severe drought and flood events in China (Wu et al 2003).
On the other hand, previous studies have revealed that atmospheric intraseasonal oscillations (ISOs), especially periods ranging from 10 to 20 d (QBW) and 30–60 d, are important features of SCS monsoon variability (Zhou and Chan 2005, Wang et al 2009). The QBW oscillation is observed to exhibit dominant westward propagation, and the 30–60 d oscillation is regarded as a northward propagation oscillation (Chen and Chen 1995, Wang et al 2009). These two ISOs could influence the onset and withdrawal of the SCSSM by modifying convection activities and easterly/westerly wind shifts over the SCS (Vernekar and Ji 1999, Chan et al 2002, Zhou and Chan 2005, Kajikawa and Wang 2012, Lee et al 2013). Moreover, at the interannual time scale, a significant positive correlation is found between the ISO activities over the tropical northwest Pacific and the intensity variation in the SCSSM (Li et al 2001, Chen et al 2011). For example, (Li et al 2001) suggested that strong ISO activities exist over the SCS region in strong SCS summer monsoon years. (Chen et al 2011) indicated that when the 30–60 d oscillation is in an active state, southwesterlies prevail over the SCS, and cyclonic circulation appears in the northern SCS, which leads to a strengthened SCSSM trough and SCSSM. In recent years, the interdecadal changes in the SCSSM have attracted extensive attention (Wang et al 2009, Choi et al 2017), while few of these studies have focused on the contribution from the change in ISO activities. This issue is also investigated in the present study.
The focus of the present paper is on investigating the change in the IPWP size and its impacts on the SCSSM intensity. The remainder of this paper is organized as follows. In section 2, the datasets and methodology are described. In section 3, the interdecadal shift in the IPWP size and its influence on the variations in the intensity of the SCSSM are investigated. Finally, the major results and discussion are presented in section 4.
2. Data and methods
The monthly SSTs are derived from the Met Office Hadley Centre (HadISST), which is compiled on a 1° × 1° grid and available from January 1870 (Rayner et al 2003). The monthly mean winds are obtained from the National Center for Environment Prediction/National Center for Atmospheric Research (NCAR/NCAR) reanalysis products with a 2.5° × 2.5° horizontal resolution (Kalnay et al 1996). The reanalysis variables are available from January 1948.
The size of the IPWP is defined as the region with SSTs that are warmer than the 29 °C isotherm divided by the climatological warm pool region (Zhou 2014). The SCSSM index is defined as the meridional shear vorticity index (hereafter SCSSMI; Wang et al 2009):
where the first and second terms on the right-hand side represent the 850 hPa zonal wind averaged over (5–15°N, 110–120°E) and over (20–25°N, 110–120°E), respectively. A positive value of the SCSSMI represents a strong SCSSM. (Wang et al 2009) showed that the SCSSMI can represent the intraseasonal and interdecadal variabilities in the summer monsoon over the SCS and adjacent regions.
To extract the ISOs, 10–20 d and 30–60 d bandpass filters are used to obtain the zonal wind and meridional wind of the ISOs. Then, the eddy kinetic energy (EKE; Chen and Sui 2010) distribution of the atmospheric ISOs is calculated as follows:
where u and v are the zonal and meridional wind components, respectively. The overbar represents a temporal mean, and the prime denotes a perturbation from the temporal mean.
3. Results
3.1. Interdecadal change in the size of the IPWP
figure 1(a) shows the 9 year moving mean of the time-longitude SST averaged from 10°S to 20°N in boreal April during 1951–2018. As shown in the figure, the area of warm water with SSTs between the 28 °C isotherm and the 28.5 °C isotherm in the tropical Indian and western tropical Pacific remained almost unchanged from 1951 to 2018. The area of water with SSTs exceeding the 28.5 °C stretches from the tropical eastern Indian Ocean (100°E) to the western tropical Pacific area (160°E) after the 1980s. Water with SSTs warmer than 29 °C has appeared since the 1990s. This implies an enlargement and warming of the IPWP. To quantify the change in the warm water area in the tropical eastern Indian Ocean and the tropical western Pacific, we calculated the time series of the warm pool size (figure 1(b)), which was defined as the area in which the SST was higher than 28 °C or 29 °C divided by the climatological warm pool region. For the 28 °C isotherm line, the computed values are distributed close 1, with higher values after the late 1980s and lower values before that. This indicates that the size of the IPWP, as assessed based on the 28 °C isotherm line, has basically remained stable over the long term, similar to the results shown in figure 1(a). The results based on the 29 °C isotherm line show a significant increase in the late 1980s. The values are mainly greater than 1 after 1986, while the results are primarily less than 1 during the period before 1986. Therefore, we select 1986/1987 as the abrupt change point in the size of the warm pool in the following analysis. The above analysis suggests that the size of the IPWP increased in the late 1980s, especially for water areas warmer than the 29 °C isotherm line. The turning point in approximately 1986/1987 is consistent with the findings of previous studies (e.g. Zhou 2014), although (Zhou 2014) emphasized the interdecadal changes during June–October. The result shows an increase in the size of the warm pool since the late 1980s, with its eastern boundary extending significantly eastward.

Figure 1. (a) The 9 year sliding mean of the meridional averaged (10°S–20°N) sea surface temperature (units: °C) in April from 1951 to 2018. (b) The time series of the Indo-Pacific warm pool size index calculated as the SST region warmer than the 28 °C isotherm (red line) and the 29 °C isotherm (black line; hereafter referred to as the WPSI) divided by the climatological warm pool region in April from 1951 to 2018.
Download figure:
Standard image High-resolution image3.2. Strengthened relationship between the IPWP and SCSSM since the late 1980s
Previous studies have found that large and small warm pools have important influences on atmospheric circulation variations (Wang et al 2006, 2008). According to the interdecadal change in the size of the IPWP in approximately 1986, significant changes in the atmospheric circulations are observed (figure 2). figure 2 shows the differences in the relative vorticity and the horizontal wind field at 850 hPa regressed onto the normalized Indo-Pacific warm pool size index (WPSI) in May based on the 29 °C isotherm line. During 1951–1986 (hereafter abbreviated as T1), negative vorticity centers are evident from the Bay of Bengal to the Philippines and the tropical western Pacific area, indicating anomalous anticyclonic circulation (figure 2(a)). To the south of the anticyclone, significant easterlies are observed. Thus, there is a weak monsoon trough and southward displacement of the WPSH ridge in T1 (Li and Pan 2007, Huang et al 2016). In contrast, in the 1987–2018 period (hereafter abbreviated as T2), anomalous cyclonic circulation is seen over large areas in the tropical western Pacific and the Indochina continent (figure 2(b)). Two significant anticyclonic anomalies are located to the south and north of the cyclonic circulation. These characteristics imply a stronger-than-normal monsoon trough and northward displacement of the WPSH ridge in T2. Large westerlies to the south of the cyclonic center originate from the Bay of Bengal to the Philippine Sea and occupy areas along 10°N. Easterly and northerly wind anomalies cover most areas northeast of the cyclone center. This meridional cyclonic shear implies a stronger SCSSM according to the definition of the SCSSMI by (Wang et al 2009).
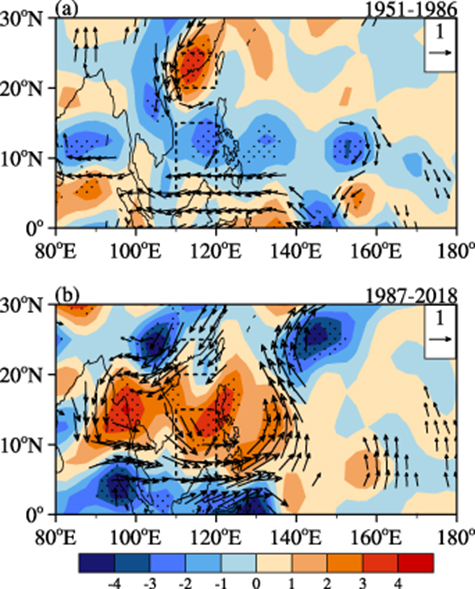
Figure 2. Regression of the 850 hPa vorticity (shading, units: 10–6 s−1) and the horizontal wind field (vector, units: m s−1) in May based on the normalized WPSI during (a) 1951–1986 and (b) 1987–2018. The vectors and stippling denote the anomalies significant at the 90% confidence level according to Student's t-test. The dashed boxes indicate the areas over (5–15°N, 110–120°E) and over (20–25°N, 110–120°E), respectively.
Download figure:
Standard image High-resolution imageThe above results indicate that the IPWP size fluctuations in the interdecadal time scale play a key role in the strength of the SCSSM. According to the definition of the intensity of the SCSSM described in the second section (Wang et al 2009), the aforementioned regions ((5–15°N, 110–120°E) and (20–25°N, 110–120°E)) are shown with dashed boxes in figure 2. The changes associated with the interdecadal change in the size of the IPWP are clearly illustrated. As shown in figure 2(b), an anomalous cyclonic circulation is observed over the SCS, and enhanced low-level relative vorticity is located over the southern part of the SCS. In contrast, weaker wind anomalies and weakened relative vorticity are seen in figure 2(a). Obviously, the intensity of the SCSSM was much stronger in the second period. Considering that these changes in wind anomalies are regressed on the interdecadal changes in the size of the IPWP, we conclude that the enlarged warm pool led to the enhancement of the intensity of the SCSSM. Moreover, the size of the IPWP is calculated with the SST data from April, when convection is sensitive to SST changes. As previous studies have suggested (e.g. Gray 1968), warmer SSTs can reduce the vertical stability and greatly enhance convection and low-level confluent winds. Therefore, the enhanced wind anomalies in figure 2(b) showed a strengthened influence from the enlargement of warm SSTs.
To verify the change in the connection between the IPWP and the SCSSM, figure 3 shows the normalized WPSI and SCSSM intensity index during May (figure 3(a)) and the sliding correlation coefficients between the two indices with a window of 31 years (figure 3(b)). The strength of the SCSSM (figure 3(a)) has increased since the 1990s, which is consistent with the findings of previous studies (Kwon et al 2007, Wang et al 2009, Choi et al 2017). The 31 year sliding correlation coefficients between the SCSSM intensity index and the WPSI has experienced a remarkable shift since the late 1980s (figure 3(b)). We used a 31 year window by considering both the purpose of studying the interdecadal variability and the length of the data (1951–2018; 68 years). Additionally, the results of the running correlations are not sensitive to the length of the window. The results under different window lengths are similar to that of the 31 year running correlation (figure not shown). As shown in figure 3(b), the correlation coefficients between the SCSSM and the warm pool are significant and positive for the period from the late 1980s to the late 1990s. A weak negative correlation is seen during 1970–1981. The transition of the increase in positive correlation coefficients during 1982–1986 is mainly due to the same-sign anomalies of the SCSSM and the warm pool during 1997–2001 (figure 3(a)). Thus, corresponding to the enlargement of the IPWP size in the late 1980s, the correlation between the IPWP size and the intensity of the SCSSM increased. Note that their running correlation tends to be weaker after 1995, because of the northward extension of the IPWP after 2010. Recently, (Zhang et al 2019) suggested that the global warming hiatus has faded away. (Cheng et al 2020) revealed that based on the ocean heat content data, the past 10 years are the top 10 warmest years in the ocean, in the modern instrumented record. In fact, warmer SSTs shifted to the north after 2010, which caused anomalous convection to move northward, resulting in a weak correlation between the SCSSM intensity index and the warm pool size index. This new change is beyond the scope of this study and will be investigated in future work.
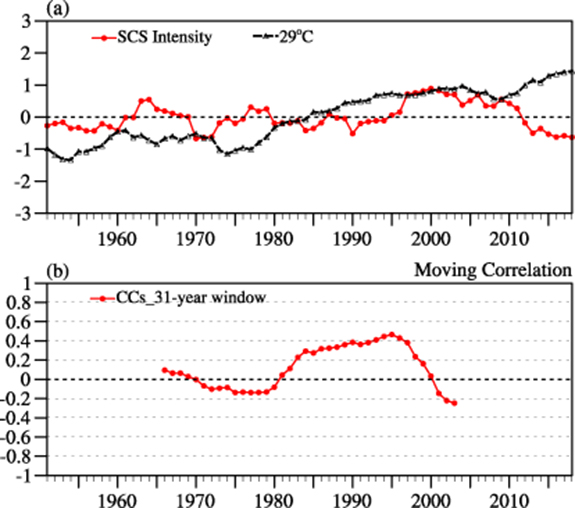
Figure 3. (a) Time series of the normalized SCSSM intensity index in May (red line) and the WPSI (black line) for 1951–2018. (b) Sliding correlation between the SCSSM intensity index and the WPSI displayed at the central year of the 31 year window.
Download figure:
Standard image High-resolution image3.3. Interdecadal modulation of the intraseasonal oscillations
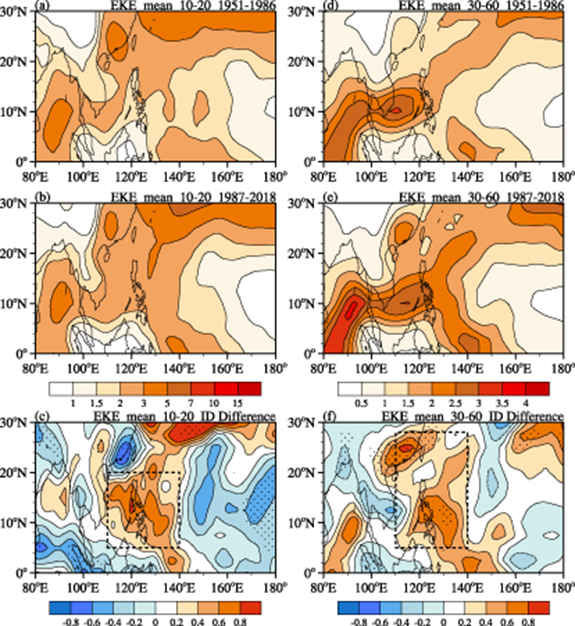
The above analysis shows that the interdecadal extension of the IPWP may be a dominant factor that contributes to the strengthening of the SCSSM intensity. Previous studies suggested that decadal variations in the SST may excite changes in ISO activities (Slingo et al 1999, Zveryaev 2002, Roxy and Tanimoto 2012). To investigate the corresponding changes in the atmospheric intraseasonal oscillations over the tropical western Pacific, figure 4 shows the distribution of the ISO EKE at 850 hPa, which is filtered within 10–20 d and 30–60 d averages for 1951–1986 and 1987–2018 and the differences between them. During T1, two maximum centers are observed in southern China and the North Indian Ocean in the QWB oscillation (figure 4(a)). The maximum values of the 30–60 d ISO are centered east of the Philippines (figure 4(d)). The distribution of the EKE shows similar characteristics during T2 (figures 4(b) and (e)), but with stronger values. To explain the possible strengthened influences of the ISO activities on the intensity of the SCSSM, the difference in the EKE between these two periods is demonstrated in figures 4(c) and (f). Notable positive EKE anomalies are observed over the Philippines and SCS (dashed boxes in figures 4(c) and (f)), which indicates stronger ISO activities in 1987–2018 than in 1951–1986. According to previous studies (Li et al 2001, Chen et al 2011), strong ISO activities over the Philippines and SCS favor the enhancement of the SCSSM by modifying convection activities and westerly wind anomalies. Therefore, the stronger ISO activities in 1987–2018 than in 1951–1986 could partly have led to a strengthened influence on the SCSSM intensity.
Figure 4. The 10–20 d variations in the eddy kinetic energy (EKE) at 850 hPa (units: 10−5 m2 s−2) in May averaged for (a) 1951–1986, (b) 1987–2018, and (c) their differences. (d)–(f) Same as (a)–(c) but for the 30–60 d time scale. The stippling in (c) and (f) indicates areas of difference exceeding the 90% confidence level according to Student's t-test. The dashed boxes in (c) and (f) indicate the areas where notable positive EKEs are located.
Download figure:
Standard image High-resolution image
The above analysis shows that both the 30–60 d ISO mode and the QBW oscillation are enhanced after the late 1980s. Studies show that the interdecadal timescale variation in the ISOs is connected to the air-sea interaction (Zveryaev 2002, Yang et al 2008, Roxy and Tanimoto 2012). As discussed in section 3.1, the size of the IPWP increased in the late 1980s. In response to this interdecadal warming, the convective activities and the cyclonic meridional shear at 850 hPa are enhanced over the tropical western Pacific region (figure 2(b)). These conditions are favorable for the development and enhancement of ISO perturbations (Yang et al 2008). The enhanced ISO activities could also contribute to the strengthening of the SCSSM intensity in the latter period (Li et al 2001, Chen et al 2011).
4. Discussion and conclusion
The size of the April IPWP experienced a notable change in the late 1980s involving a large extension of the 29 °C isotherm. During the 1951–1986 period, the area within the 29 °C isotherm was smaller than that of the climatological mean. During the 1987–2018 period, the area within the 29 °C isotherm expanded and exceeded its climatological mean size. Accompanied by the interdecadal shift in IPWP size, the relationship between the May SCSSM and the IPWP was enhanced in the late 1980s. This strengthened influence from the IPWP after the late 1980s led to an enhancement in the intensity of the SCSSM.
The interdecadal shift in the relationship between the May SCSSM and IPWP probably resulted from the changes in IPWP-related circulation anomalies. During 1951–1986, convective activities over the western tropical Pacific were suppressed because of the smaller warm pool. Easterly winds were enhanced north of the equator, and low-level anticyclonic circulation occupied the western tropical Pacific. In contrast, the extension of the IPWP during 1987–2018 led to enhanced convection over the western tropical Pacific, and thus, large westerly flow and cyclonic vorticity formed over the Philippines. These conditions contributed to the strengthening of the SCSSM intensity in the latter period. Moreover, in response to the enlarged IPWP, the ISO activities over the western tropical Pacific, including the QBW mode and the 30–60 d oscillations, came through an interdecadal enhancement, and were also favorable for the reinforcement of the SCSSM. A previous study found an anticorrelation between the year-to-year intensity variations in these two ISO oscillations (Yang et al 2008), which resulted from the out-of-phase convective conditions over the Indian Ocean and the central-western Pacific. However, our analysis shows that these two ISO modes were enhanced simultaneously at the interdecadal time scale, since the size of the IPWP extended greatly and led to stronger convection activities over most parts of the western tropical Pacific and the eastern Indian Ocean.
This study focused on the interdecadal change in the size of the IPWP in the late 1980s and its impacts on the intensity of the SCSSM in May. In addition, previous studies found that the thermal state of the IPWP plays a key role in the changes in atmospheric convection, circulation and energy transport over East Asia and the western North Pacific (e.g. Nitta 1987). This is because the SCSSM acts as a water vapor pathway connecting the Indian and East Asia-western North Pacific monsoons during boreal summer, which is important for climate change (Wang et al 2009). Therefore, the changes in cyclones, droughts and heave rainfall events impacted by this interdecadal change should be investigated in the near future. Another issue we are interested in is the ability of the climate model to capture the shifts in the size of the IPWP in the late 1980s. We are interested in conducting numerical simulations with different sizes of the IPWP, which might reveal the internal process when the IPWP extended eastward. Furthermore, the meridional shift of the IPWP should also be considered in future numerical experiments. With these studies, the climate changes caused by the interdecadal changes in the size of IPWP will be explained more explicitly.
Acknowledgments
This study was funded by the National Key Research and Development Program of China (2016YFA0600603) and the National Natural Science Foundation of China (Grant No. 41705071).
Data availability statements
The data that support the findings of this study are openly available from the data providers at the Hadley Centre and NCEP/NCAR.
NECP/NCAR reanalysis data are freely available from the ESRL data server (www.esrl.noaa.gov/psd/data/gridded/data.ncep.reanalysis.html). The HadI-SST data are freely available from the Met Office Hadley Center (www.metoffice.gov.uk/hadobs/hadisst/index.html).