
Abstract
Hydrological factors such as volumetric water content (VWC) and pore-water content (PWC) have been cited widely as significant factors that trigger slope failures especially shallow landslides and debris flows. Over the years, researchers have studied these processes using a range of physically-based models which in many occasions are either too complex incorporating very many parameters or fail to mimic real field conditions. The principal objective of this study was to derive and incorporate a set of physically-based equations that describe the dependence of slope failures at laboratory scale on VWC into a factor of safety expression herein referred to as the hydro-dynamical landslide model. The model was validated by a series of physical tests on soil samples in the laboratory using the Chep-flume. Results showed a close agreement between computational and experimental data, confirming the hypothesis that cohesion, internal friction angle and pore-water pressure are modulated by VWC especially for slopes with sandy-loam soils. More so, rapid change of soil water content was observed to accelerate build-up of negative pore-water pressures (PWP) which triggers slope failure. Apart from giving a simplified expression for the factor of safety, the proposed model circumvents the difficulties associated with tedious procedures employed in the measurement of cohesive stress by limiting the tests to only three sets of parameters i.e. VWC, PWP and displacement.
Export citation and abstract BibTeX RIS

Original content from this work may be used under the terms of the Creative Commons Attribution 3.0 licence. Any further distribution of this work must maintain attribution to the author(s) and the title of the work, journal citation and DOI.
This article was updated on 08 July 2021 to add permission lines to the figures.
1. Introduction
Generally, slope instabilities occur as a consequence of physical or man-made processes that significantly contribute to downward movement and/or facilitate a decrease in sliding resistance leading to a resultant decrease in the shear strength at any given time. Slope instability can trigger soil mass movements in the forms of creep, falls, slides, avalanches, or flows. In Kenya, soil mass wasting occurrences have been on the rise especially landslides mostly in Central and North-Western highland regions (Abramson et al 2002, Ngecu et al 2004, Ministry of State for Special Programmes, Office of the President 2009).
Slope failures which have had disastrous impacts to human life and the environment in general have been linked to many factors including lithological properties, soil behaviour, slope geometry, hydraulic conductivity, rainfall intensity and duration, surface cracks and percentage of vegetative cover. (Chen and Zhang 2014; Springman et al., 2012). Other flume-based experiments identified grain size, sand content, shear strain and maximum pore pressure as the triggering factors (Olivares and Damiano 2007).
Research studies based on a laboratory flume indicated that a soil mass undergoes three phases before slope failure occurs, namely increased weight, rapid pore-water pressure change and shearing along the failure plane (Okura et al 2002). Recent experimental studies have also indicated that most slope failures especially in hilly environments usually occur as a result of a combination of physical factors such as sudden changes in PWPs for unsaturated soils, decrease in cohesion and diminished internal friction angle. Seepage and interflow of soil water along perched phreatic surfaces also offers a perfect failure plane for sliding to occur. Earlier research reports had also indicated a strong dependence of soil shear strength on the amount of soil moisture present in the soil mass (Rahardjo et al 2007, Lu and Godt 2008, Muntohar and Liao 2009). The most dominant factors that have been pinpointed to modify the stability status of slopes in unsaturated soils are hydrological in nature with rainfall intensity and duration emerging conspicuously as the key parameter (Ray et al 2010, Zhao and Zhang 2014).
Over the years, researchers have employed several models in varied forms and scenarios to analyze hydrologically influenced landslide processes and mechanisms. The two dominant approaches utilized in most scientific studies are physically-based and statistical models. Statistical models are based on relations and assumptions between triggering factors and the probability of occurrence of slope failure, while physically-based models employ the relationship between soil water content and predisposing aspects to analyze landslide phenomena (Springman et al 2012, Wu et al 2015). Because of the spatial-temporal variability of landslide processes, physically based models are preferred over statistical ones.
Geophysicists have divided the study of granular materials into dry and wet flows. In dry granular flows, the flow regimes can manifest as frictional and/or collisional. In this case, the granular material is in most scenarios considered cohesionless and modelled to obey the Mohr-Coulomb criterion (Savage, 1984, Gray et al 1999). For wet granular flows, the most widely accepted assumption is to consider the slope material as an incompressible continuum with homogeneous density obeying a Coulomb-like basal friction law (Hutter et al 1989). Jarray et al (2019) demonstrated that the presence of an interstitial liquid led to a rise in the depth of the flowing mass and decreased the flow speed of the particles along the slope. More recent research studies based on avalanche flows have proposed more adaptive rheological relations which were validated through rigorous laboratory based experiments. Faug et al (2008) proposed a numerical model relating the overrun length of an approaching avalanche to its speed and effective height for a catching dam. Numerical formulation and accompanying experimental work based on dry granular flows over a number obstacles of different shapes using 3D sensor (composed of RGB camera and an infrared laser emitter) were put forward by Juez et al (2014) and Caviedes-Voullième et al (2014).
In this paper, we propose a hydro-dynamical constitutive model based on inertial forces acting on a homogeneous rigid-perfectly plastic soil mass on an incline This model that is derived from first principles of geomechanics outlines the relationship between VWC and the resultant inertial forces, factor of safety and eventual displacement of the slope material. A simplified but precise and unique expression of the factor of safety and initial acceleration of the slope material based only on VWC and PWP.
2. Materials and methods
2.1. Theoretical formulation: hydro-dynamical landslide model
In this section, we derive physics-based empirical equations from first principles to describe the dependence of slope stability status and associated triggering factors on VWC. The ultimate goal is to derive an expression that incorporates the dominant contribution of VWC on the factor of safety and eventual acceleration of the soil mass downslope when resistive forces are diminished or overtaken by driving forces. The model is then tested experimentally on a laboratory flume based on soil samples collected from Chepkoilel farm.
For mathematical and modelling convenience, we consider a soil mass located on a slope of infinite lateral extent inclined at an angle α as a homogeneous rigid-perfectly plastic material (as shown in figure 1) held in position by basal friction due to cohesive forces between soil grains and/or internal friction along an imaginary failure plane as our base prototype. From theorems of mechanics, the downward component of the gravitational force along the incline plane for moist soil will take the form,

where γm is the moist unit weight of the soil, γw is the unit weight of water, n is the porosity, V is the total volume of the soil, m = ms + mw is the total mass of the moist soil, and θ is the volumetric moisture content.
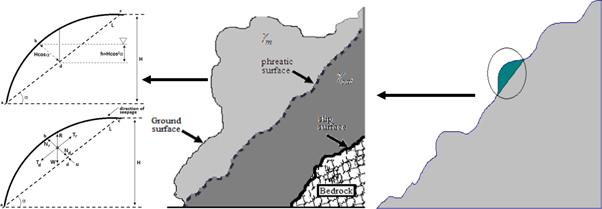
Figure 1. Model slope (for numerical studies).
Download figure:
Standard image High-resolution imageThe resultant resistive force considering the friction component at the base of the soil mass with the coefficient of dynamic friction,  is given by

with ϕ as the soil internal angle of friction.
For cohesionless soils such as coarse sand, Newton's law of motion will yield

or

Askarinejad et al (2012b) formulated a simplified equation of defining apparent cohesion as a soil property dependent on the degree of saturation (Sr = θ/n), matric suction (ua – uw ) and internal friction angle (ϕ), mathematically expressed as,

The cohesive force component in three degrees of freedom is derived from equation (4) as

where A is the cross-sectional area of the base along the plane.
Consequently, by taking into consideration equation (5), Newton's second law of motion law for cohesive soils will therefore be derived as
Or

Equation (6) defines the tangential acceleration as a function of the slope angle, internal friction angle, slope height, pore water pressure and water content (or generally degree of saturation).
Computationally, the factor of safety is defined as the ratio of resistive to driving forces for a given soil mass on a sloping plane. For the two scenarios i.e. for cohesionless and cohesive soil models, the factors of safety respectively are expressed as


While equation (7) is a standard expression for the factor of safety for many non-cohesive soils, equation (8) as proposed in our study, differs substantially from conventional equations. In equation (8), the FS in the model is expressed as a function of the slope height and angle, porosity, internal friction angle, matric suction and VWC. This equation is simplified in the sense that once the slope height and angle of a known soil mass are ascertained, slope stability measurements will only require three sets of sensors [i.e. PWP, VWC and displacement (for computation of acceleration) transducers] as opposed to conventional models requiring monitoring of very many parameters. More precisely, measurement of soil cohesion is usually tedious and relatively expensive as it requires a triaxial machine, though in this model, the cohesion term is simplified by expressing it in terms of degree of saturation (which is a function of VWC) and PWP, making it comparatively easier to monitor.
When the FS is less than unity, there is high probability of shear failure. This process can be quantified by monitoring local displacement of certain sections of the slope. The proposed empirical equation for displacement is derived from kinematic equations of motion i.e.

where ξ is a curve fitting parameter and t is the time duration.
2.2. Study site and experimental setup
Validation experiments were conducted at the Physics lab, University of Eldoret, Main Campus in Uasin Gishu county. The soils used in this experiment are of igneous origin which belong to ferralic cambisols classification. Averagely, they are composed of 60% sand, 16% silt and 24% clay with a pH of 4.5–5.0 (Gachene and Kimaru, 2003). A laboratory flume named 'Chep-flume' of dimensions 1.5 × 0.5 × 0.5 m was fabricated to work as the base for experimental simulation (figure 2) (Kanule and Ng'etich 2019). The framework of the setup was made from steel angle bars while the sides were made from sheets of plywood (though transparent Perspex would have been better though costly). The base was made of thick iron sheeting material covered on the upper part by a layer of rough concrete. Inclination/slope angle of the flume was achieved by use of a hydraulic jack that could lift or lower the rear side. A rainfall simulation system consisting of a sprinkler, flow rate controller and source of water was designed. The sprinkler system is composed of an array of equally spaced nozzles placed 2 m above the flume. One wireless rain gauge was placed on the side of the flume, two moisture probes, two vibrating wire piezometers and one set of ultrasonic sensors were installed on the system at different points. Data from all the sensors was captured via a control panel which could relay them wirelessly to a remote pc as depicted in the flowchart below (figure 3).

Download figure:
Standard image High-resolution image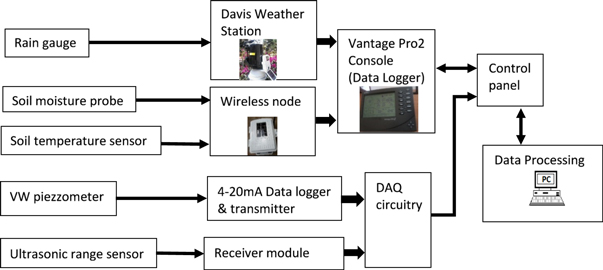
Figure 3. Data acquisition flowchart.
Download figure:
Standard image High-resolution image2.3. Experimental procedure
A soil sample consisting of sandy-loam soil was collected from Chepkoilel farm and divided into 6 subsets translating to 6 experiments sets. were carried out using samples. Each of the uncompacted and unconsolidated soil samples were placed in the flume up to a height of 40 cm and treated to the preferred conditions. The setup was prepared in such a way that only water from rainfall simulator was allowed into the soil sample so that soil water content measured was confined to infiltration only. Each soil sample was placed in the flume and exposed to constant rainfall intensity and duration. Rainfall tests were performed on each soil sample at different angles ranging from 30°–70° for a period of about 75 min. Rainfall tests were done by exposing the soil samples to a rainfall simulation apparatus with an embedded flow rate control device to maintain the intensity at approximately 45 mm hr−1. For each slope angle, parametric data of water content, pore pressure and displacement (for calculation of acceleration) was collected under these constant rainfall conditions until mass failure occurred (Orense et al 2004).
2.4. Experimental assumptions
These experiments were anchored on three major assumptions. First, it is assumed that all the incident rainfall water should infiltrate into the soil with no runoff or radial seepage. Secondly, the variation of the mean values of VWC and PWP with time remained unchanged for all the experiments. Finally, based on earlier experiments, it was assumed that the soil mass will become nearly saturated after 45 min if a rainfall intensity of 45 mm hr−1 was maintained.
3. Results and discussion
Soil mass movements on slopes are complex processes possessing high spatial-temporal variability. Many scientific studies have strived to establish mechanisms and triggering factors through numerical models and rigorous experiments for many years. Amongst many other parameters, the most recent studies through field observations and measurements have indicated that most slope failures in unsaturated soils are triggered by hydrological factors and/or earthquake events (Guzzetti et al 2009, Zhao and Zhang 2014, Wu et al 2015). This is in reaction to the realization that most triggering factors are intrinsic functions of the VWC either directly or indirectly. For instance, as proposed in equations above, both cohesion and pore-water pressure are all dependent on water content. It is in this context that we have proposed a hydromechanical model.
For a soil mass inclined at a given slope angle, incident rainfall will enter into it via infiltration process so as to cause a corresponding increase in VWC. Since runoff and radial seepage are assumed negligible in these experiments, all the incident rainfall water will manifest as VWC. Model and experimental results for VWC are illustrated in figure 4(a) below. The VWC is observed to exponentially increase as infiltration of rainfall water progresses reaching its peak towards saturation. The VWC is observed to approach a constant maximum value and this is due to the supposition that seepage or percolation is assumed to be negligible in the flume. It is desired in this study that the soil samples are not saturated for that will lead to failure by liquefaction only while ignoring other triggering factors of interest such as change in PWP, slope angle, and internal friction angle. This is the reason why the rainfall simulation is halted at 45 min into the experiment. Model and experimental results for the VWC agree well with RMSE of 0.000106 and Pearson's coefficient of 0.9910 respectively.

Figure 4. Variation of (a) volumetric water content (VWC) and (b) pore-water pressure (PWP) with time.
Download figure:
Standard image High-resolution imageFor the sandy clay loam soil, the PWP (figure 4(b)) is observed to remain averagely constant and negative in the beginning of the experiment, but after sometime (about 25 min), it exponentially rises with increase in the VWC. This is due to the fact that molecules of water occupy more and more pore spaces in the soil thereby compressing the entrapped air causing an increase in PWP. When the soil is nearly saturated, the PWP is nearly zero (the peak), in which case liquefaction is inevitable. Model and experimental results are comparable with RMSE of 72.4266 while the coefficient of correlation is 0.9861 respectively.
The health status of slopes has been analyzed widely by application of the Mohr-Coulomb criterion and computation of the factor of safety (FS) against probable failure. In classical geotechnical studies, the FS is a function of the slope angle, PWP, cohesion, and internal friction angle. In our proposed model, the FS has been modified in such a way that it is directly dependent on the VWC together with other factors such as slope angle, internal friction angle and PWP but excluding cohesive stress. Our model is more convenient as it requires relatively inexpensive transducers during data collection as opposed to triaxial machines traditionally used. More pertinently, it is easier to monitor VWC as opposed to experimental determination of the soil cohesion in any given laboratory.
For non-cohesive soils such as sand, the factor of safety is only dependent on the slope and internal friction angle. For cohesive soils i.e. soils with substantial amounts of clay content, the FS is a function many other factors amongst them PWP and cohesive strength. Dominant triggers of most mass movements are functions of VWC as alluded to earlier. In the proposed hydro-dynamical model, we have considered the dependence of slope stability on the VWC.
Experimental and model results based on a laboratory flume together with a rainfall simulator have established a significant relationship between VWC in conjunction with other parameters to the FS of a given slope material and by extension, displacement leading to eventual failure. Figures 5(a)–(e) shows the variation of the FS over time at different angles ranging from 30–70°. It is discernible from these figures that the factor of safety is modified greatly by both VWC and PWP. At low values of the VWC, the FS exponentially increases with an increase in VWC until a critical point is reached referred to as the ultimate cohesive strength (UCS). This is attributed to the fact that water molecules will make relatively stronger bonds with soil grains due to adhesive forces compared to soil interparticle bonding. In this case, water molecules form a single layer that acts as an interface between soil grains, resulting in a material with comparatively stronger bonds. When more water is added into the soil mass, more water molecules occupy the space between soil molecules forming a new layer that makes bonds with water molecules adhering to the soil grains. This new layer forms a plane for shearing to occur as it lubricates adjacent layers. In this scenario, the soil mass gradually loses its cohesive strength proportionately with increase in VWC and by extension the FS. Towards saturation, substantial amounts of water molecules occupy soil interparticle spacing to the extend that the resulting mixture now flows like a Newtonian fluid, a process commonly known as liquefaction. For cohesive soils with low hydraulic conductivity, increase in VWC leads to a gradual rise in PWP which lowers the FS if it becomes positive. This is the reason why the FS rises in the initial stages when cohesive stress is emboldened by VWC, but after some time the FS will gradually drop when cohesive stress is diminished and PWP rises.

Figure 5. Variation of the factor of safety for slope angles (a) 30°, (b) 40°, (c) 50°, (f) 60° and (e) 70o with time under wetting conditions. Inset: Comparison between model and experimental data for correlation purposes.
Download figure:
Standard image High-resolution imageAs the slope angle is increased, the downward gravitation component of the driving force increases in obedience to Newton's second law of motion. The soil samples used in these experiments were observed to remain stable upto a theoretical (according to our model) maximum angle of 71.7° when dry and 76.9° when wet with a moisture content of 40% and 99.5% (saturated) respectively. For slope angles 30° and 40°, the FS remained above unity implying no failure or displacement even in saturated conditions. At slope angle of 50° and 60°, the soil mass collapsed 19 and 5 min after the end of the rainfall event when the VWC had reached 88% and 84% respectively. Finally, at the slope angle of 70°, the soil mass failed after 43 min into the experiment when the VWC approached 76%.
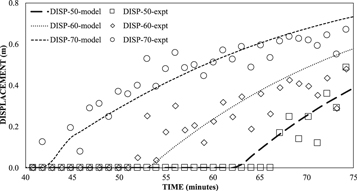
Measurement of soil mass displacements was done using a pair of ultrasonic range sensors mounted on the front side of the flume. During the experiment, the soil mass could reach a critical point at which the FS reduced to below unity leading to downward movement along the failure plane as shown in figure 6 below. The displacements occurred up to a maximum displacement of 0.8 m because of the size restrictions of the flume used. From figure 5 as expected, the higher the slope angle the higher the displacement relative to the original position. Model and experimental results agreed well with a correlation of 0.9685, 0.9681 and 0.9849 for slope angles 50°, 60° and 70° respectively. Model and experimental results of displacements were used to compute the values of the acceleration employed in the hydromechanical model. The average values of the computed acceleration of the soil mass downslope for model and experimental computations were found to be 0.01357 and 0.01340 m s−2, 0.01608 and 0.01791 and 0.01813 and 0.01943 for slope angles 50°, 60° and 70° respectively. The corresponding correlation coefficients were 0.1398, 0.0377 and 0.1918 respectively. Arising from the above, the hydro-dynamic model has been proved to agree well with experimental findings.
Figure 6. Variation of soil mass displacement against time.
Download figure:
Standard image High-resolution image
4. Conclusion
In general, the failure surfaces formed in these experiments were of the shallow and non-circular (translational) retrogressive type for this type of soil samples. The proposed hydrodynamical model as derived for the factor of safety conceives a remedy to many geotechnical scientists in terms of the simplified equation and the reduced number of variables required. More pertinently is the exclusion of direct measurement of cohesive stress which requires relatively expensive triaxial tests monitor. The model requires only two physical parameters i.e. VWC and PWP to ascertain the health status of a given slope. An additional measurement of displacement will be used to confirm the initiation of deformation when the FS is below unity. Therefore, the displacement obtained in this study represents the stage at which plastic deformation occurs but not the runout displacement.
The proposed model agrees well with experimental data based on a laboratory flume, but it should be tested on in situ field conditions. This model is limited to pre-failure and during failure characteristics of a slope but does not extend to rheological analysis of post-failure behaviour.
Acknowledgments
We acknowledge the support of Physics Department, Soil Science Department, University of Eldoret, and National Council for Science and Technology (NCST).