


Abstract
It is believed that the continuing change in the Earth's climate will affect the viral activity and transmission of influenza over the coming decades. However, a consensus of the severity of the risk of an influenza epidemic in a warming climate has not been reached. It was previously reported that the warmer winter can reduce influenza epidemic caused mortality, but this relation cannot explain the deadly influenza epidemic in many countries over northern mid-latitudes in the winter of 2017–2018, one of the warmest winters in recent decades. Here, we reveal that the widely spread 2017–2018 influenza epidemic can be attributed to the abnormally strong rapid weather variability. We demonstrate, from historical data, that the large rapid weather variability in autumn can precondition the deadly influenza epidemic in the subsequent months in highly populated northern mid-latitudes; and the influenza epidemic season of 2017–2018 was a typical case. We further show that climate model projections reach a consensus that the rapid weather variability in autumn will continue to strengthen in some regions of northern mid-latitudes in a warming climate, implying that the risk of an influenza epidemic may increase 20% to 50% in some highly populated regions in the later 21st century.
Export citation and abstract BibTeX RIS

Original content from this work may be used under the terms of the Creative Commons Attribution 3.0 licence. Any further distribution of this work must maintain attribution to the author(s) and the title of the work, journal citation and DOI.
1. Introduction
Influenza epidemics tend to occur more frequently from October to May, peaking in January and February over the highly populated northern mid-latitudes [1, 2]. This boreal winter half of a year is often referred to as influenza season. The seasonality of influenza suggests a potential tie to the seasonality of weather and climate [3, 4]. However, a consensus of the severity of the risk of an influenza epidemic in a warming climate has not been reached [5–7]. Previous studies have suggested that low surface air temperature and humidity in winter constitute a favorable climatic environment for the survival and transmission of the influenza virus [8–10] and, therefore, the continuing fast warming of the Earth's climate in winter can depreciate the favorable climatic environment for the survival and transmission of the influenza virus and reduce future influenza epidemic risk [5]. However, this relation cannot explain the deadly influenza epidemic in many countries over northern mid-latitudes in the winter of 2017–2018 [11, 12], one of the warmest winters in recent decades.
In general, the transmission of the influenza virus and the spread of human influenza-like disease (ILI) depends on many factors. One of them is the survival and reproductivity of the influenza virus in different ambient conditions. Previous studies have shown that the reproductivity and survival length of the virus in colder and less moist air is larger and, thereby, the transmission of the influenza virus is more effective in winter seasons when both the moisture level and temperature are low. This disease dynamic has been confirmed in experiments with guinea pigs [9, 13, 14], and the relation was even incorporated into models that fit the past data and make predictions of the strength of the incoming flu season [15–17]. It should be noted that becoming infected with the influenza virus also depends on the strength of the human immune system [18], as evidenced by the use of influenza vaccines. Seasonal fluctuations in human immunity could also play a role in the seasonality of influenza epidemics [19]. In such a sense, understanding the variability and change in any climatic aspect that can affect the human immune system will help more accurately estimate the relation between the continuing climate change and future influenza epidemic risk. It is also noted that the seasonality association is not only with ILI but also with other diseases [20].
2. Materials and methods
2.1. Meteorological data
Daily maximum surface air temperatures of Europe and the continental United States for the period January 1, 1997 to February 28, 2018 are derived from the Global Historical Climatology Network (ftp://ftp.ncdc.noaa.gov/pub/data/ghcn/daily/), covering a total number of 7729 days. The data are all the meteorological station-observed daily maximum temperatures. Many individual stations contain non-observed days. In this study, only the daily temperature time series of individual stations that satisfy the following conditions are analyzed: (1) the station-observed temperature time series has no more than 80 missing days for any individual winter half year (from August 1 to February 28); and (2) fewer than 750 days of missing data over the study period (1997–2018). There are 559 stations satisfying these two conditions in the United States and 547 in Europe. The available temporal domain of Italy is from 1999 to 2018. The spatial interpolation using the Matlab function griddata is then applied to fill in missing data for any individual days for all meteorological stations. The homogenized data is then averaged to obtain state-wise (United States) or country-wise (Europe) averaged daily maximum temperatures. The Global Historical Climatology Network contains relatively fewer numbers of stations over China. Therefore, the station-observed daily maximum temperature over China is from the quality-controlled [21] observations assembled by the National Meteorological Information Center of the China Meteorological Administration (http://data.cma.cn/). There are 654 stations over China that satisfy the above two conditions.
Daily near-surface mean absolute humidity is from reanalysis provided by the National Centers for Environmental Prediction/National Center for Atmospheric Research (NCEP/NCAR reanalysis) [22]. This dataset is a spatially gridded one that has a fixed zonal resolution of 1.875 degrees of longitude and a varying Gaussian-shaped meridional resolution with its average close to 1.875 degrees of latitude. The data covers the whole global domain starting from January 1, 1948. In this study, we analyze data covering the same temporal span, from January 1, 1997 to February 28, 2018, to obtain state-wise (United States) or country-wise (Europe and China) averaged absolute humidity fields. The reanalysis can be downloaded from: https://esrl.noaa.gov/psd/data/gridded/data.ncep.reanalysis.html.
The simulated and projected daily surface maximum temperatures are from the CMIP5 [23] for the periods Jan. 1950–Dec. 2005 and Jan. 2006–Dec. 2100, respectively. The projected future climate data selected are from two future emission scenarios: the RCP4.5 and RCP8.5. Seven widely acclaimed Earth system models from different countries are selected, with their names, institutes, and horizontal resolution listed in supplementary table S1 (available online at stacks.iop.org/ERL/15/044004/mmedia). The simulated and projected data can be downloaded from: https://esgf-node.llnl.gov/projects/cmip5/.
2.2. Influenza-like illness and influenza morbidity (ILI/IM) data
Due to the different settings in the influenza datasets (supplementary table S2), the analyzed data from the United States of America (USA) are the ILI, defined as the percentage of patients with ILI among all patients. For European countries and mainland China, the analyzed datasets contain the weekly percentage of confirmed influenza patients among all tested patient samples, which is referred to as influenza morbidity (IM) in this study. Due to the varying spatiotemporal resolutions of different datasets, interpolation or summation methods are used to obtain the same spatiotemporal resolutions if necessary.
Weekly IM data over Europe and China are obtained from the Influenza Laboratory Surveillance Information of the World Health Organization. Weekly IM data from34 countries are analyzed in this study, with source laboratories and available temporal domains listed in supplementary table S2. The data can be downloaded from: http://apps.who.int/flumart/Default?ReportNo=14.
The ILI data are from the US Center for Disease Control and Prevention. The dataset has weekly temporal resolution and includes three different subsets: (1) the state-wise reported percentage of ILI patients covering the period from the 40th week of 2010 to the present; (2) the standard federal region-wise data covering the period from the 40th week of 1997 to the present; and (3) the whole United States averaged data covering the period from the 40th week of 1997 to the present. The data can be downloaded from: https://gis.cdc.gov/grasp/fluview/fluportaldashboard.html. The reason for using ILI data rather than IM data over the United States is due to the inconsistency in IM data. According to the US Center for Disease Control and Prevention, the methods for collecting IM data changed after 2015–2016, while those for collecting ILI data remained the same for 1997 to 2018.
2.3. Definition of rapid weather variability
It has been proposed that sudden large changes in temperature can impair the human immune system and trigger immune evasion [24–29]. The possible mechanism is that the human thermoregulation of immune defense is less adjustable to the sudden large change in temperature [26, 27] and less resistant to various diseases [24, 25]. Recently, studies showed that the sudden large change in temperature tends to cause high respiratory mortality [24–27, 30] and to impact influenza seasonality [31]. It is, in fact, based on this pathological mechanism that we suspect that frequent fluctuating weather, as an additional factor, may play a significant role in influenza epidemics.
To quantify the sudden large change in temperature, here we introduce a climatic quantity called rapid weather variability (RWV) for any given temporal location: the total number of consecutive days with surface air temperature differences [32] larger than 3 K over a three-week period ending at that temporal location (see supplementary table S1). The procedure for quantifying RWV is shown in supplementary figure S1; the number of absolute differences of consecutive-day surface air temperature (figure S1(b)) is first calculated from the raw daily surface air temperature time series (figure S1(a)), and the number of days with differences larger than 3 K over a three-week sliding window is obtained (figure S1(c)). The selection of a temporal window length of three weeks allows us to retain sufficient variability of the RWV and reduce the effect of randomness. It is important to note that the threshold of 3 K is not an arbitrary selection; rather, it is based on the sensitivity of the human immune system to temperature variability [26]. Both positive and negative changes in temperature of more than 3 K would remarkably increase the respiratory mortality [26]. It is noted that the key results presented later in this paper are not sensitive to the selection of window size for defining RWV as long as it is between two weeks to four weeks (see supplementary text and supplementary figures S2–S3).
2.4. The lagged correlations between weather variables and ILI/IM
In this study, we explore the impact of RWV on ILI/IM. Since the former cannot be changed by the latter, we anticipate an either simultaneous or delayed response of ILI/IM to RWV. To characterize this relation, lagged correlations of various delays are calculated for the weekly anomalous weather variable Vi,j and the weekly anomalous value Ni,j of ILI/IM of the same region, where the subscripts i and j represent the ordered year and ordered week of a year, respectively. The lagged correlation between Vi,j and Ni,j is defined as
where is is the starting influenza season, and ie is the ending influenza season. In this study, is corresponds to the 1997–1998 influenza season and ie corresponds to the 2017–2018 influenza season, but with the 2009–2010 influenza season excluded as the ILI/IM in that season was dominated by swine influenza that has abnormal spreading dynamics [33–35]. In addition, the Monte Carlo test was used to examine the statistical significance of lagged temporal correlation. The statistical significances of different countries for the correlation coefficients of ±0.4, ±0.45, ±0.5, and ±0.55 are listed in supplementary table S3.
3. Results
3.1. Rapid weather variability preconditions influenza epidemic
Figure 1 presents various relations between autumn RWV and ILI/IM. For the four northern mid-latitude countries/regions, i.e. the United States, mainland China, Italy, and France, which have relatively longer ILI/IM data, a common feature that emerged is that the autumn RWV appears to have a long-lasting effect on the influenza epidemic strength in the subsequent months (coherent reddish blocks in the correlation maps displayed in the left column panels of figure 1; statistical significances are shown in supplementary table S3), implying that the RWV has preconditioned the occurrence of the influenza epidemic, although the influenza peaking times were different for all these regions. The case in figure 1(b) in which the January RWV is correlated with influenza mortality in the previous November was largely caused by a few individual influenza seasons, such as the 2010–2011 winter, 2013–2014 winter, and 2015–2016 winter (supplementary figure S8(b)). With a small sample, such a spurious relation can exist, although it is unreal. Another feature common to all four regions is that the peak strength of ILI/IM, P increases with the strength of the RWV in autumn. The normalized change rates,  corresponding to the RWV value changed by 1, are 23%, 27%, 14%, and 26% for the United States, mainland China, Italy, and France, respectively (supplementary figure S13). These values indicate that the ILI/IM is highly impacted by RWV, at least from a statistical perspective. It is also noted that the statistical relation between later autumn RWV and the following winter ILI is most robust in populations of ages less than 5 and greater than 65 for the United States (see supplementary text and supplementary figure S4).
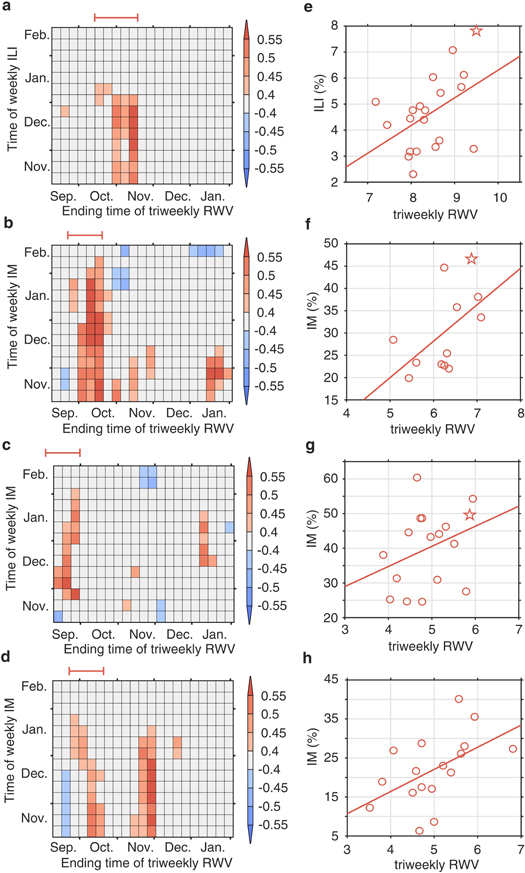
Figure 1. Long-term ILI/IM changes with respect to RWV. (a) Weekly lagged correlation between triweekly RWV anomaly and ILI/IM anomaly for the period 1997–2018 over the whole USA. (b)–(d) The same as (a) but for mainland China (2005–2018), Italy (2000–2018), and France (1997–2015), respectively. (e) A scatter plot of the pairs of peak ILI/IM and the averaged triweekly RWV over the temporal span marked by red intervals immediately above each left panel for the USA over the temporal span of 1997–2018, with the stars corresponding to the 2017–2018 influenza season. (f)–(h) The same as (e), but for mainland China (2005–2018), Italy (2000–2018), and France (1997–2015), respectively.
Download figure:
Standard image High-resolution imageTo further confirm the lasting effect of autumn RWV on the later winter ILI/IM peaking strength, figure 2 presents the spatial patterns of RWV and ILI/IM of the 2017–2018 influenza season for the United States and a large portion of Europe. The influenza epidemic season of 2017–2018 was one of the severest influenza seasons in the United States and Europe [11, 12], causing up to 4064 mortalities a week in the United States alone. The spatial patterns of RWV in mid-October to mid-November of 2017 for the United States and in September of 2017 for Europe share similar spatial structures of their corresponding peak ILI/IM in January and February of 2018, with spatial correlations between RWV in autumn and ILI/IM of 0.32 for the United States and 0.33 for Europe, and both exceeding a 95 percent confidence level against a null hypothesis of random spatial distribution. However, the simultaneous spatial correlations between RWV and peak ILI/IM are much smaller, with values of −0.06 in the United States and −0.23 in Europe, and are not statistically significant.
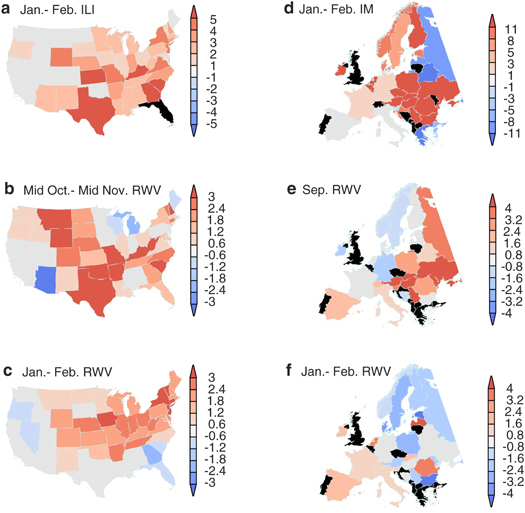
Figure 2. The spatial patterns of ILI/IM and RWV during the 2017–2018 influenza season. (a) The United States ILI/IM anomaly (%) averaged over January–February 2018; (b)–(c) the monthly averaged RWV anomaly (days) over the United States from October 15–November 15, 2017 and January–February 2018, respectively; (d) the same as (a) but for Europe. (e)–(f) The monthly averaged RWV anomaly (days) over Europe from September 2017 and January–February 2018, respectively; black represents missing records.
Download figure:
Standard image High-resolution imageResults from the above analysis suggest a mechanism of ILI/IM temporal evolution: in later autumn, the intensified RWV contributes to the increase in influenza patients. When the mass of patients reaches a critical level in a densely populated region, the direct contacts between influenza patients and healthy persons increase and the rate of persons being infected with the influenza virus reaches a level greater than the rate of influenza recovery, leading to a fast increase in influenza patients and a severe influenza season. The 2017–2018 influenza season of the United States appears to confirm the hidden operation of such a mechanism, although it may not be the most dominant one. Since an influenza epidemic's peak season is mostly in the second half of winter and RWV in autumn contributes significantly to building critical patient levels in densely populated regions, the strength of RWV during autumn may serve as a valuable predictor of the severity of the consequent influenza season, thus facilitating earlier preparation and prevention.
The statistical relationships between winter-time temperature/humidity and influenza epidemics in many highly populated regions of northern mid-latitudes over the past two decades was also reexamined. However, the identified relations between winter temperature/humidity and influenza epidemics are less robust (see supplementary text and supplementary figures S5–S10).
3.2. Changing risk of influenza in a warming climate
Over the past century, the Earth's climate has been changing at an unprecedented pace [36, 37], especially in the highly populated northern mid-latitudes. This climate change is not limited only to surface temperature; rather, it also includes changes in other climate variables, such as the mid-latitude synoptic variability [23, 38]. Since the change in RWV can cause large changes in the ILI/IM, as revealed above, understanding the spatial patterns of future RWV can help us determine the severity of future ILI/IM threats.
The above identified relation between RWV and ILI/IM provides a chance to estimate the changing risk of the influenza epidemic in a warming climate. Figure 3 presents the triweekly RWV changes for two three-decade spans, 2020–2049 and 2070–2099, based on the diagnoses of seven climate system model (supplementary table S1) outputs from the Representative Concentration Pathway (RCP) 8.5 emission scenario of the Coupled Model Intercomparison Project Phase 5 (CMIP5) [39]. CMIP5 was used to project future climates in the Intergovernmental Panel on Climate Change's fifth assessment report. The displayed RWV changes are the anomalies of the means of triweekly autumn RWV of the above selected two temporal spans with respect to the historical three-decade mean RWV for the temporal span 1970–1999. While the detailed spatial patterns of RWV changes in these seven models are not exactly the same, a common feature emerges: many regions of northern mid-latitudes will have an RWV anomaly increase of more than 0.5 over the next three decades and more than 1 in the last three decades of the 21st century. Most of these models projected that highly populated Europe will have the largest RWV increase, with triweekly RWV increases larger than 1 over the next three decades and more than 2 in the last three decades of the 21st century. This large increase in RWV projects that some regions of Europe will have the risk of IM increase by more than 50% if solely following the statistically robust RWV–IM relation presented in figure 1. However, this number may be an overestimation since RWV is not the only cause of IM. All model-projected RWV changes in the United States show an increase only in its highly populated northeast region with a relatively smaller value. The models also projected that the large majority of China will also have RWV increases by up to 1 by the end of the 21st century, implying that IM will increase by more than 20%. In summary, the increasing RWV is likely to increase the risk of IM in future, although a reliable quantification is out of our reach.

Figure 3. Projected changes in triweekly normalized autumn RWV in a warming climate. (a)–(g) Projection of the difference in triweekly normalized autumn RWV of seven models under an RCP8.5 emission scenario during 2020 to 2049 minus that in a historical run during 1970 to 1999. (h)–(n) The same as (a)–(g) but with 2070 to 2099 replacing 2020 to 2049.
Download figure:
Standard image High-resolution imageThe validity of the above projection of the risk of ILI/IM is highly dependent on the accuracy of the projection of RWV. Is this projected RWV physically justified? The historical data shows that the noticeable land warming after the industrial revolution started first in the land neighboring the Arctic and the subtropical northern hemisphere [40]. These two bands intensified and generated an anomalous temperature gradient that led to the increased anomalous heat transport from polar/subpolar regions and subtropical regions to northern mid-latitude regions in the autumn season. By the end of the 21st century, the maximum warming was at about 50 °N (figure 4), leading to the increased meridional temperature gradient north to that latitude [40]. The increased meridional temperature gradient provided a more favorable environment for the synoptic system to develop [41–43], explaining the intensification of RWV. This maximum warming latitude is still shifting southward as the globe continues to warm, see figure 3 of Ji et al [40]. The climate projection based on the above-mentioned model outputs show that this zone of increased meridional temperature gradient is further south, with its southern edge located at about 45 °N. Thus, the increased RWV in climate model projection is consistent with previous understandings and can be anticipated. It is noted that, for the Asian region, the zone of the intensified meridional temperature gradient locates south to the zonally averaged one, while for the United States and Europe, this zone locates north to the zonally averaged one.

Figure 4. Projected changes in autumn temperature in a warming climate. (a)–(g) Projection of the zonal averaged temperature in boreal autumn of seven models under an RCP8.5 emission scenario during 2020 to 2049 minus that in a historical run during 1970 to 1999. Unit: K. (h)–(n) The same as (a)–(g) but with 2070 to 2099 replacing 2020 to 2049. The lines in black, blue, and red represent zonal averages for 130°W to 120°E, 130°W to 30°E, and 30°E to 120°E, respectively.
Download figure:
Standard image High-resolution image
The similar spatial pattern changes in RWV and zonally averaged temperatures are also seen in the projections under a more moderate emission scenario, RCP4.5. Supplementary figure S11 displays the triweekly autumn RWV changes in seven climate system models for a more moderate emission scenario, RCP4.5. The spatial patterns of RWV increase under RCP4.5 and resemble those of RCP8.5 (figure 3), but with reduced amplitude. Under the RCP4.5 emission scenario, many regions of northern mid-latitudes will have an RWV anomaly increase more than 0.3 over the next three decades, and more than 0.4 in the last three decades of the 21st century. Under the RCP4.5 scenario, the IM over Europe and China may increase by more than 30% and 15%, respectively, in the last three decades of the 21st century. In addition, model projections under the RCP4.5 emission scenario are characterized by maximum warming over northern mid-latitudes (supplementary figure S12).
4. Discussion
It has been long recognized that climate change will affect human health and put billions of people at increased risk [41, 43, 44]. Previous studies focused more on the disease dynamics, and directly observed temperature and humidity affecting the influenza epidemic. Our study, based on statistical analysis, shows that RWV also played a significant role in changing the strength of the influenza epidemic in the past. In a warming climate, the RWV will intensify and the influenza epidemic risk can increase by up to 50% in some northern mid-latitude regions.
It is noted that our identified relation between ILI and RWV is based on the limited data of ILI. The small number of samples may cause bias in the calculation, especially when the ILI data are highly non-Gaussian. Neverthless, this identified relation may contribute to earlier preparation and prevention of influenza epidemics. Since an influenza epidemic's peak season is mostly in the second half of winter and autumn RWV contributes significantly to building critical patient levels, the strength of autumn RWV may serve as a valuable predictor of an influenza epidemic in the subsequent months.
Finally, it is also noted that the data we analyzed are mostly regional averaged over large spatial domains and age-undistinguished; thereby, the identified statistical relation may contain unknown degrees of bias [45, 46]. In figure S4, we presented evidence that the identified RWV–ILI relationship is more robust for preschool children and the elderly. We anticipate that, with fine categorized data potentially available in future, more accurate relationships may be revealed.
Acknowledgments
Q L and C F are supported by the Chinese Jiangsu Collaborative Innovation Center for Climate Change; Q L is also supported by financial support from the program of China Scholarships Council (201706190153); Z-M T is supported by the Natural Science Foundation of China (41461164008); and Z W and J S are supported by the US National Science Foundation grant (AGS-1723300). The authors declare no competing financial interests.
Data availability statement
The data that support the findings of this study are available from the corresponding author upon reasonable request.