


Abstract
The monitoring of near-surface temperature is a fundamental task of climatology that remains especially challenging in mountain regions. Here we assess the regional monitoring capabilities of modern reanalysis products in the well-monitored northern Swiss Alps during the last 20–60 years. Monthly and seasonal 2 m air temperature (T2m) anomalies the global ERA5 and the three regional reanalysis products HARMONIE, MESCAN-SURFEX and COSMO-REA6 are evaluated against high quality in situ observational data for a low elevation (foothills) mean, and a high elevation (Alpine) mean. All reanalysis products show a good year-round performance for the foothills with the global reanalysis ERA5 showing the best overall performance. The high-resolution regional reanalysis COSMO-REA6 clearly performs best for the Alpine mean, especially in winter. Most reanalysis data sets show deficiencies at high elevations in winter and considerably overestimate recent T2m trends in winter. This stresses the fact that even in the most recent decades utmost care is required when using reanalysis data for near-surface temperature trend assessments in mountain regions. Our results indicate that a high-resolution model topography is an important prerequisite for an adequate monitoring of winter T2m using reanalysis data at high elevations in the Alps. Assimilating T2m remains challenging in highly complex terrain. The remaining shortcomings of modern reanalyses also highlight the continued need for a reliable and dense in situ observational monitoring network in mountain regions.
Export citation and abstract BibTeX RIS

Original content from this work may be used under the terms of the Creative Commons Attribution 4.0 licence. Any further distribution of this work must maintain attribution to the author(s) and the title of the work, journal citation and DOI.
1. Introduction
Atmospheric reanalyses use a fixed, modern numerical weather prediction model to reconstruct the meteorological conditions of the past, integrating the available historical observations form various observing systems through data assimilation (Kaiser-Weiss et al 2019). They provide physically consistent, spatio-temporal, multi-variable data sets, which can be used for a wide range of process studies and climatological applications (Buizza et al 2018). Until recently, mainly global reanalysis data sets with a relatively coarse grid resolution in the order of several 10 to over 100 km were available for most regions of the world (Kalnay et al 1996, Dee et al 2011, Ebita et al 2011, Rienecker et al 2011). However, the coarse resolution is not able to represent mesoscale weather and climate variability adequately. This leads to problems especially in mountain regions where the large-scale flow interacts strongly with the complex topography (see Pepin and Seidel 2005, Kunz et al 2007, You et al 2010, Feser et al 2011). Several new reanalysis products have recently become freely available. Among those are the new global reanalysis ERA5 with a resolution of ∼31 km (C3S 2017) and several regional reanalysis products (produced in the EU-funded UERRA project for the European domain) with a spatial resolution between 5 and 11 km. First studies confirm that the new regional reanalyses deliver an added value compared to global reanalyses, mainly because of their higher spatial and temporal resolution (e.g. Kaiser-Weiss et al 2019, Niermann et al 2019). However, using reanalysis for the analysis of climate trends remains challenging. The temporally fluctuating number of observations, and biases in assimilated observations and models, can introduce spurious variability and trends into reanalysis output, especially in the pre-satellite era (Bengtsson et al 2004, Bromwich and Fogt 2004, Thorne and Vose 2010, Simmons et al 2017). Nevertheless, reanalyses have been often used for climate monitoring and trend analyses, especially in data sparse regions (e.g. Diaz et al 2003, Marshall 2003, Lindsay et al 2014).
In this study, we revisit the 'climate monitoring' capabilities of a set of modern reanalysis products for 2 m air temperature (T2m) in the well-monitored complex topography of the Swiss Alps. In a more explicit form: Are modern reanalysis products a serious alternative to high-quality station based monitoring products? We focus on the monthly to seasonal time scale in the last 20 to almost 60 years and evaluate the reanalyses for two elevation means, the northern foothills and the higher elevation regions of the Swiss Alps north of the main Alpine rim.
2. Data and methods
2.1. Investigated variable and evaluation domain
T2m anomalies are analysed in terms of their variability and trends. Anomalies are computed with respect to the longest common period of the evaluated reanalysis datasets, i.e. the 23 year mean over the years 1995 to 2017, and the 22 year mean of the winters 1995/6 to 2016/7. T2m is a challenging variable for reanalyses, since it is not a prognostic variable on a model level but has to be derived from different prognostic quantities and stability assumptions in the atmospheric boundary layer. In ERA5, for example, T2m is diagnosed from the skin temperature and the air temperature of the lowermost atmospheric model level (ECMWF 2016).
Following Begert and Frei (2018), we evaluate the reanalysis products for two area means with a similar temperature climatology: (1) a low elevation mean (LEM) over an area of about 18 000 km2, covering the northern foothills of the Swiss Alps with elevations between about 245 and 1000 m asl, and (2) a high elevation mean (HEM) over an area of almost 19 000 km2, covering the Swiss Jura and the Swiss Alps north of the Alpine main crest with elevations between 1000 and 4634 m asl (see figure S1, which is available online at stacks.iop.org/ERL/15/044005/mmedia in the supplementary information). The elevation limit of 1000 m asl is a good choice to separate elevation dependent differences in winter. Depending on the data set considered, the regional mean values are computed from a few dozen to several hundred reanalysis grid points in both regions (see section 2.2). For the elevation masking, the elevations of the corresponding grid points are used. Thus, the considered regions slightly differ among the different datasets.
2.2. Reanalysis data
Spatial mean time series of the following reanalysis data sets are evaluated: (1) the new ERA5 reanalysis from ECMWF (C3S 2017) which is currently available for the period 1979–2018. It has a horizontal resolution of 0.25° (∼31 km) covering the whole globe. Thirty-six (35) grid points are averaged to construct the LEM (HEM). (2) the HARMONIE product (SMHI 2019), a 3D-regional reanalysis, which has been produced in the EU UERRA project (https://uerra.eu) and is now continuously updated as a service by the Copernicus Climate Change Service (C3S). It has a horizontal resolution of 11 km, is available for the period 1961 to present and covers the entire European continent. One hundred seventy-four (187) grid points are averaged to construct the LEM (HEM). (3) the MESCAN-SURFEX data set (abbreviated as MESCAN in figures/tables; see Bazile et al 2017), a 2D surface analysis combining downscaled HARMONIE reanalysis fields and additional surface observations, which has also been produced in the EU UERRA project. It has a horizontal resolution of 5.5 km, is available for the period 1961 to present and covers the whole European domain. Six hundred eighty-six (758) grid points are averaged to construct the LEM (HEM). Note that since MESCAN-SURFEX uses HARMONIE as input, they can thus not be considered as independent of each other. (4) the COSMO-REA6 data set (abbreviated as REA6 in figures/tables; see Bollmeyer et al 2015), a 3D-regional reanalysis for Continental Europe produced by the Hans Ertel Centre for Weather Research (HErZ) and the German Weather Service DWD. It has a spatial resolution of about 6 km (0.055°) and is currently available for the period 1995–2017. Six hundred ninety-six (747) grid points are averaged to construct the LEM (HEM). Note that ERA5, HARMONIE and MESCAN-SURFEX assimilate T2m observations, while COSMO-REA6 does not. COSMO-REA6 might indirectly benefit from T2m observations that are used for the soil moisture analysis (see Bollmeyer et al 2015, section 2.2.3).
2.3. Observational data
As primary observational benchmark, we use the freely available swissmean (SM) temperature data set (MeteoSwiss 2019). It is a time series data set that integrates data from a relatively small sample of homogenized long-term series (19 stations) and the signature of the MeteoSwiss high-resolution (2 km) gridded temperature product (see Begert and Frei 2018 for details). A countrywide area-averaged time-series and time-series for three major sub-regions (among them a northern Swiss LEM below 1000 m asl and a northern Swiss HEM above 1000 m asl) are available in monthly, seasonal and annual resolution from the year 1864 to today. The data set has been extensively evaluated against the MeteoSwiss high-resolution (2 km × 2 km) gridded temperature product (Frei 2014). It delivers reliable and time-consistent area-mean estimates with an error of about 0.1 °C for monthly mean temperature (see Begert and Frei 2018). The swissmean LEM and HEM series are also used in the official climate bulletins of MeteoSwiss. The long‐term consistent gridded monthly temperature data set from Isotta et al 2019 is used for an upscaling exercise (see section 2.4). For comparison and as secondary benchmark, we use the E-OBS HOM data set (v19.0eHOM, abbreviated as E-OBS in figures/tables; see Squintu et al 2019), the homogenized version of the E-OBS data set (Cornes et al 2018). Over the Swiss domain, E-OBS HOM includes data from all 29 stations of the Swiss National Basic Climatological network (NBCN, see Begert et al 2007). E-OBS HOM has a spatial resolution of 0.1° (about 10 km), covers Europe and we use data for the period 1961–2017 in this study. Two hundred eight (230) grid points are averaged for the construction of the LEM (HEM).
2.4. Methods
We analyse time series for all months of the year and discuss the winter (December to February, DJF) mean series in more detail. We evaluate the error  the absolute error
  and the mean absolute error (MAE)
  of the temperature anomalies, where
  is the reanalysis temperature anomaly and
  is the benchmark (i.e. the SM) temperature anomaly at time step i with respect to the reference period defined in section 2.1. n is the number of time steps the MAE is computed for. We also compute the Pearson sample correlation coefficient r between the reanalysis series and the benchmark series on a monthly basis (see Wilks 2006). The errors are discussed for the full time range, data is available for the corresponding data set. In order to make a fair comparison between the different data sets, MAE and r are computed over the longest common period of the evaluated datasets, i.e. the 23 years (n = 23) from 1995 to 2017 and the 22 winters (n = 22) from 1995/6 to 2016/7. Linear trends are computed using the robust method by Theil–Sen (Theil 1950, Sen 1968) which determines the slope as the median of all possible slopes between data pairs. The trend significance is determined by the nonparametric Mann–Kendall trend test (Mann 1945, Kendall 1975). Trends with p-values smaller than 0.05 are classified as significant. To test the effect of the different grid resolutions of the data products on our results, we upscaled high-resolution 2 km (∼0.02°) grid data (see Isotta et al 2019) to the 0.055°, 0.11° and 0.25° reanalysis resolutions. The monthly MAE values of the upscaled LEM/HEM with respect to the high resolution 2 km mean are very small (<0.1 K), much smaller than those of the reanalysis data sets. This indicates that the observed low and high elevation means are very insensitive to upscaling. We therefore compute the LEM/HEM series using data on the native grid of the data products.
3. Results
3.1. Size and evolution of monthly errors
3.1.1. Low Elevation Mean (LEM)
The LEM errors vary considerably between the four reanalysis data sets (figure 1, left panel). ERA5 shows the smallest errors. There are no breaks or obvious drifts of the error. The error variability is slightly larger in the 1980s compared to later but the errors are mostly small. Roughly 12 (3)% of all absolute errors are greater than 0.25 (0.5) K in the period 1979–2018.
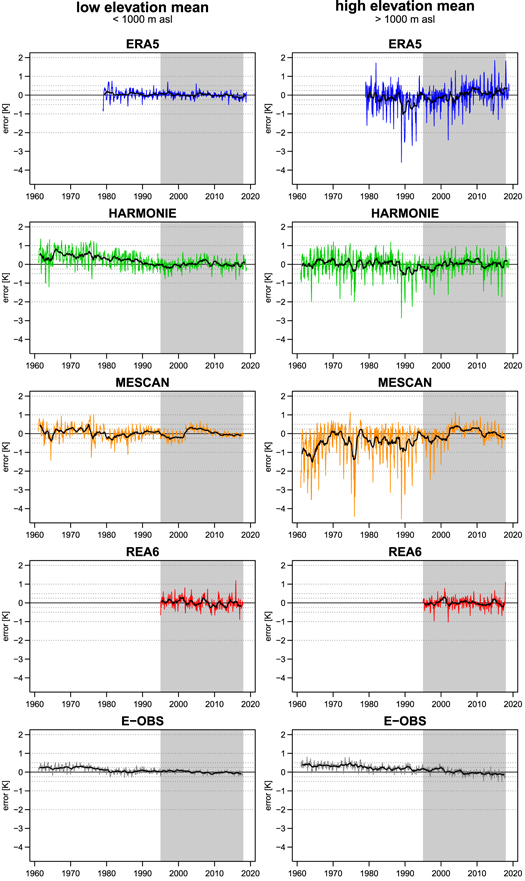
Figure 1. Evolution of the error (reanalysis minus SM benchmark, in K) of the monthly T2m anomaly (reference 1995–2017) for the northern Swiss LEM (<1000 m asl, left panels) and the northern Swiss HEM (>1000 m asl, right panels). Shown are ERA5 (blue, 1979–2018), HARMONIE (green, 1961–2018), MESCAN-SURFEX (orange, 1961–2017), COSMO-REA6 (red, 1995–2017) and E-OBS HOM (black, 1961–2017). The black curve shows a twelve-month moving average. The grey boxes highlight the common time range 1995–2017 used for the quantitative evaluation. The horizontal dotted lines show the ±0.25 K, ±0.5 K, ±1 K and ±2 K error limits chosen for the descriptions in the text.
Download figure:
Standard image High-resolution imageThe most important feature of HARMONIE is a systematic drift from positive errors of +0.5 K on average to no error between the 1960s and the mid-1990s. The error variability is especially large in the 1960s and 1970s and larger than the one of ERA5 after 1979. The error series of MESCAN-SURFEX shows several breaks, also in the recent past. It shows no systematic long-term error drift. The absolute errors are mostly smaller than 0.5 K and the error variability is somewhat smaller in recent decades. MESCAN-SURFEX errors tend to be larger than that of ERA5 but smaller than the one of HARMONIE. COSMO-REA6 shows no obvious drifts or breaks in the error series. The error variability is similar to the one of HARMONIE but larger than those of ERA5 and MESCAN-SURFEX. The errors of the secondary benchmark E-OBS HOM show a small break (∼0.2 K) around 1980, the time of the automation of the MeteoSwiss measurement network. Otherwise, the errors and the error variability are very small and clearly smaller than those of the reanalyses data sets.
The absolute error statistics for the common period 1995–2017 (see table 1 for all details) show that in this period ERA5 performs clearly best with 93.1% (5.8%) of months with absolute errors smaller than 0.25 K (between 0.25 and 0.5 K). The other three reanalyses HARMONIE, MESCAN-SURFEX and COSMO-REA6 perform similarly with 68.5%–75.7% (17.4%–24.6%) of months with absolute errors smaller than 0.25 K (between 0.25 and 0.5 K). Absolute errors larger than 0.5 K are relatively rare in the four reanalyses (1.1% in ERA5 to 7.7% in COSMO-REA6). Absolute errors larger than 1 K are only found for one month in COSMO-REA6. In E-OBS-HOM, absolute errors are always smaller than 0.25 K.
3.1.2. High elevation mean (HEM)
The smallest HEM errors among the reanalysis products are found for COSMO REA-6 (figure 1, right panel). Interestingly, the errors are even slightly smaller than those for the LEM. There are no breaks or obvious drifts. ERA5, HARMONIE and MESCAN-SURFEX all show larger errors for the HEM than for the LEM with negative errors of up to more than −4 K and positive errors up to 2 K in certain months. The spatial anomaly patterns in months with large differences between reanalysis and high-resolution observations can look quite different (see maps in figure S2). All products show some breaks and drifts over time. The most obvious problems are found for MESCAN-SURFEX, which shows a large error variability from the 1960s to the 1990s. The errors of the secondary benchmark E-OBS HOM show a small drift of ∼0.5 K from the 1960s to 2017, but as for the LEM, the error variability is much smaller than the one of the reanalysis products.
The absolute error statistics for the common period 1995–2017 (table 1) confirms that among the reanalysis products, COSMO-REA6 performs best with 73.2% of months with absolute errors smaller than 0.25 K and 21.4% absolute errors between 0.25 and 0.5 K. HARMONIE and MESCAN-SURFEX perform similar and ERA5 shows the largest absolute error variability. Especially for the larger errors, ERA5 lags behind. 20.3% of the months in ERA5 show absolute errors of 0.5–1 K, 8% show absolute errors larger than 1 K. In E-OBS-HOM, the absolute errors stay below 0.25 K in 89.9% of the months.
3.2. Seasonality of monthly errors
3.2.1. Low elevation mean (LEM)
Figure 2 (left panel) shows the LEM MAE for every month of the year using data from the common period 1995–2017. ERA5 shows the lowest MAE values of the four reanalysis data sets in all months except June and July where HARMONIE and MESCAN-SURFEX show slightly lower MAEs. The ERA5 values range between 0.07 and 0.16 K (mean: 0.11 K) with somewhat larger values in the winter months. ERA5 MAEs are only slightly larger than those of E-OBS HOM, whose values range between 0.05 and 0.09 K (mean: 0.07 K). E-OBS HOM errors show no seasonal cycle at all. HARMONIE shows the second smallest errors with values between 0.08 K (June) and 0.32 K (March) and a mean of 0.18 K. There is a tendency towards somewhat higher MAEs in winter and two higher values in March and April. Similar numbers (range: 0.10–0.28 K, mean: 0.18 K) are found for MESCAN-SURFEX. There is a clear seasonal cycle of the error with higher values in winter. COSMO-REA6 shows the largest errors with a clear seasonal cycle. The values range from 0.15 K (July) to 0.33 K (February) with a mean of 0.21 K. The correlation coefficients r between reanalysis and benchmark series are very high in all months with values between 0.97 and larger than 0.999 (see figure S3).
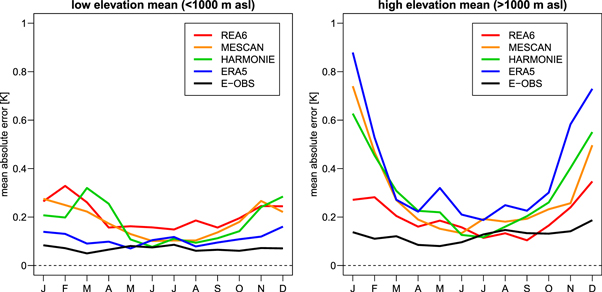
Figure 2. Monthly values of the mean absolute T2m anomaly error (MAE, in K) for the northern Swiss LEM (<1000 m asl, left panel) and the northern Swiss HEM (>1000 m asl, right panel). Shown are results for the common time period 1995–2017 with COSMO-REA6 (red), MESCAN-SURFEX (orange), HARMONIE (green), ERA5 (blue) and E-OBS HOM (black).
Download figure:
Standard image High-resolution image3.2.2. High elevation mean (HEM)
The HEM MAEs (figure 2, right panel) are larger than for the LEM for all data sets except COSMO-REA6. The best performance among the reanalysis data sets is found for COSMO-REA6 with MAE values between 0.1 K (September) and 0.35 K (December) and a mean MAE of 0.2 K. Values above 0.2 K are found in the winter half year (November to March). The COSMO-REA6 performance is similar to the one for the LEM, with some months where the HEM values are even smaller than those for the LEM. HARMONIE, MESCAN-SURFEX, and ERA5 all show strong seasonal cycles with small MAEs in summer in the order of 0.2 K and large values in winter (∼0.5 to almost 0.9 K in December and January). ERA5 performs worst at high elevations in most months. The E-OBS HOM MAE values are between 0.08 and 0.19 K (mean: 0.12 K). They show no clear seasonal cycle and are barely larger than the LEM MAEs. The correlation coefficients r between reanalysis and benchmark series are again very high with values between 0.97 and larger than 0.99 from February to October (for COSMO-REA6 and E-OBS HOM even for all months). In November, December and January lower values between 0.83 and 0.97 are found for HARMONIE, MESCAN-SURFEX and ERA5 (see figure S3).
3.3. Winter temperature evolution and trends
As shown above, the errors of the T2m anomalies are particularly large for the HEM in winter (figure 2) and are often not constant over time (figure 1). This can potentially influence the evolution and trends of the winter temperature series. For this reason, we evaluate the DJF errors and trends more in detail. The DJF absolute errors for the LEM are always lower than 0.5 K in all years for all considered data sets and there are no obvious breaks or drifts over time (figure 3, left panel). The situation is different for the HEM (figure 3, right panel). The errors are clearly different for the different data sets and particular time windows. In general, the errors are larger in the 1960s to the 1990s compared to the last 20–25 years. MESCAN-SURFEX shows particularly large errors with a clear negative bias from the 1960s to about 2000 with errors up to −3 K in individual years. Also HARMONIE tends to show predominantly negative biases between 0 and −1 K. Interestingly, all reanalysis data sets strongly underestimate the temperature anomalies in the years 1989 to 1993 by about 1 to more than 2.5 K. This is the period right after the abrupt warming around the year 1988 (Reid et al 2016, Saffioti et al 2016, Sippel et al 2019). E-OBS HOM, which in general is closest to the SM benchmark, does not show any bias peculiarities from 1989 to 1993 (figure 3, right panel).

Figure 3. Evolution of the T2m anomaly error (reanalysis minus SM benchmark, in K) of the winter (DJF) temperature 1960/1-2018/9 for the northern Swiss LEM (<1000 m asl, left panel) and the northern Swiss HEM (>1000 m asl, right panel). E-OBS HOM (black), COSMO-REA6 (red), MESCAN-SURFEX (orange), HARMONIE (green) and ERA5 (blue). The dotted horizontal lines show error ranges of ±0.5 K and ±1 K.
Download figure:
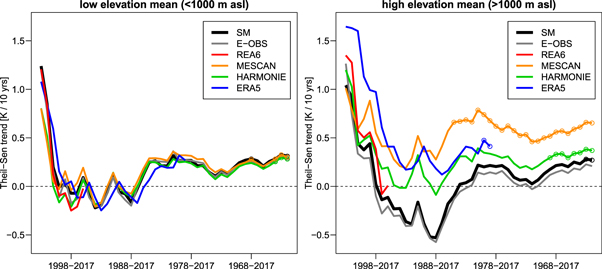
Standard image High-resolution imageThe above results show that the substantial errors in winter have indeed a pronounced influence on the estimate of recent winter trends. While the effect on the 15–57 year running window trend periods ending in the year 2017 is relatively small for the LEM (figure 4, left panel), it is considerable for the HEM (figure 4, right panel). All reanalysis data sets overestimate the winter trends for the HEM. The negative and very similar SM and E-OBS HOM trends in the last 20 to about 34 years are not found in ERA5, HARMONIE, and MESCAN-SURFEX and the longer term (50+) year trends are strongly overestimated. Due to the strong negative bias of MESCAN-SURFEX until after the year 2000 (see figure 3), it is no surprise that MESCAN-SURFEX shows the largest trend overestimations for 30+ year trends. COSMO-REA6 performs well for the short-term trends, but does not cover the period before 1995 where the other reanalyses have large errors. Most trends shown here are not statistically significant on the 5% level.
Figure 4. Running winter (DJF) Theil–Sen T2m trends (K per 10 yrs) for 15 (2002/3-2016/7) to 57 (1960/1-2016/7) year periods for the northern Swiss LEM (<1000 m asl, left panel) and the northern Swiss HEM (>1000 m asl, right panel). Significant trend estimates (Mann–Kendall trend test with p<0.05) are shown with an open circle. Colours as in figure 3. The x-axis ticks from left to right show 20, 30, 40 and 50 year running trends.
Download figure:
Standard image High-resolution image
4. Discussion
The temporal evolution of the monthly errors (figure 1) highlights a common problem of reanalysis products, namely drifts not related to climate change. Prominent reasons for this well-known feature are the non-constant number and the varying nature of observational inputs into the reanalysis (see Bazile et al 2017 for the example of MESCAN-SURFEX). The systematic drifts contribute to the winter temperature evolution deficiencies at high elevations. This is especially apparent for the MESCAN-SURFEX product (see figures 3 and 4) and shows that trend analyses using reanalyses remain challenging (see Kaiser-Weiss et al 2019). However, the errors found for the 1995–2017 period are rather moderate, even at high elevations. There are also hints that modern reanalyses have improved substantially compared to earlier reanalyses like ERA-40 (see Prömmel et al 2010).
Another point worth discussing is the fact that the analysed reanalyses perform worse at high elevations, especially in winter. To approach this question, it is important to note that on a monthly to seasonal time scale, elevation differences of the errors in the Alps are confined to the winter season and virtually inexistent in summer (see figure S4). In winter, the interplay between the synoptic-scale flow and the complex topography often leads to situations with strong elevation dependencies of temperature anomalies (e.g. cold-air pooling, fog and low stratus, elevation differences caused by fronts, see Hiebl and Schöner 2019, Rottler et al 2019, Scherrer and Appenzeller 2014, Salzmann et al 2015, Scherrer et al 2018). Low-resolution reanalysis products like ERA5 can potentially capture some of these features via the assimilation of station observations from different elevations. However, since those effects are badly represented in the smoothed model topography, the assimilated information is probably degraded quickly. It has been known for a long time that added value can be generated through higher-resolution and thus a better representation of the topography in mountain regions (e.g. Prömmel et al 2010, Feser et al 2011). It is therefore not astonishing that a higher-resolution reanalysis (COSMO-REA6) performs best for the high elevation mean temperature in winter. Note however, that high resolution alone is not a sufficient condition for a superior performance. The higher-resolution data sets COSMO-REA6 and MESCAN-SURFEX have a very similar grid spacing but perform quite differently for the HEM (figures 1, 2; table 1). The HARMONIE - MESCAN-SURFEX system assimilates T2m observations, COSMO-REA6 does not. Is seems that the assimilation of near-surface temperature observations can be problematic in high elevation regions (here investigated with the HEM) also for relatively high-resolution models. On the other hand, assimilation seems to work very well in less complex terrain. ERA5, HARMONIE and MESCAN-SURFEX all assimilating T2m observations outperform COSMO-REA6 for the LEM.
Table 1. Percentage of months with a certain absolute T2m anomaly error (K) for the four reanalysis data sets and the E-OBS HOM observational data set (italic). Shown are results for the northern Swiss LEM (<1000 m asl, top half) and the northern Swiss HEM (>1000 m asl, bottom half) in the common period 1995–2017 (total of 276 months, one month corresponds to ∼0.4%). The list is sorted descending by the highest percentage absolute errors smaller than 0.25 K. The numbers are rounded to one decimal place. A dot stands for no month in this category.
| AbsoluteT2m anomaly error (K) | <0.25 | 0.25–0.5 | 0.5–1 | 1–2 | >2 | |
|---|---|---|---|---|---|---|
| LEM <1000 m asl | ERA5 | 93.1 | 5.8 | 1.1 | . | . |
| HARMONIE | 75.7 | 17.4 | 6.9 | . | . | |
| MESCAN | 72.1 | 24.6 | 3.3 | . | . | |
| REA6 | 68.5 | 23.9 | 7.2 | 0.4 | . | |
| E-OBS HOM | 100 | . | . | . | . | |
| HEM >1000 m asl | REA6 | 73.2 | 21.4 | 4.7 | 0.7 | . |
| MESCAN | 59.4 | 23.2 | 14.9 | 1.8 | 0.7 | |
| HARMONIE | 51.1 | 31.9 | 14.1 | 2.9 | . | |
| ERA5 | 46.0 | 25.7 | 20.3 | 7.6 | 0.4 | |
| E-OBS HOM | 89.9 | 9.4 | 0.7 | . | . | |
Over Switzerland, E-OBS HOM performs very well in comparison with the SM benchmark. The very small errors, which are of similar magnitude year-round, confirm that over Switzerland E-OBS HOM incorporates enough information for a decent climate monitoring of larger area temperature means. Note that this is not a general statement on the quality of E-OBS for all regions in Europe. E-OBS quality depends on the station density that is locally very different in different regions.
5. Conclusions
The evaluation of near-surface temperature anomalies in four different reanalyses in the northern Alps for the last almost 60 years documents some of the challenges of temperature monitoring using modern reanalysis in mountainous areas. While all data sets perform reasonable well for the low elevation foothills in all seasons, most data sets show considerable errors for the high elevation mean in winter. At low elevations, the new global reanalysis ERA5 from ECMWF performs best, while the relatively high-resolution COSMO-REA6 is outperforming the other data sets in the Alpine setting at high elevations, especially in winter. The large errors at high elevations in winter, drifts over time, and a few years with large elevation dependencies of temperature anomalies after the abrupt temperature change around the year 1988, have a considerable impact on the winter trend estimates for the last two to six decades. All analysed reanalyses covering more than 25 years considerably overestimate winter temperature trends at high elevations. This shows the limitations of current regional reanalysis products even in the most recent decades and utmost care is necessary when using reanalysis data for near-surface temperature trend assessments in mountain regions. In the Swiss Alps, the high-quality station based monitoring product E-OBS provides a better estimate of regional climate variability than reanalysis products, especially in winter and high elevations. This shows that there is a continuous need for a reliable and dense in situ observational monitoring network in mountain regions. The results also indicate that a high-resolution representation of topography is a prerequisite for a good winter temperature monitoring in the Alps using reanalysis data. The best performing reanalysis at high elevations does not explicitly assimilate near-surface temperature observations, suggesting that the assimilation of near-surface parameters remains challenging over highly complex terrain. This study was limited to an analysis of relatively large-scale area-mean temperature anomalies in the well-monitored Swiss Alps. More research is needed to see which results are also valid in other mountain ranges and which once are not. In addition, future research could for example focus on the role of near-surface temperature assimilation in reanalyses, a more detailed look at the elevation dependence of the errors, on the influence of smaller scale processes or the performance of other relevant climate parameters.
Acknowledgments
The Copernicus Climate Change Service (C3S) is acknowledged for access to the ERA5, HARMONIE and MESCAN-SURFEX data, the German Weather Service (DWD) for access to the COSMO-REA6 data and the European Climate Assessment & Dataset (ECA&D) project for access to the E-OBS data set. I thank Moritz Bandhauer, Francesco Isotta, Sven Kotlarski and Tanja Weusthoff (all MeteoSwiss) and the reviewers for their valuable input.
Data availability statement
The data that support the findings of this study are available from the corresponding author upon reasonable request.