

Abstract
Eroding permafrost coasts are likely indicators and integrators of changes in the Arctic System as they are susceptible to the combined effects of declining sea ice extent, increases in open water duration, more frequent and impactful storms, sea-level rise, and warming permafrost. However, few observation sites in the Arctic have yet to link decadal-scale erosion rates with changing environmental conditions due to temporal data gaps. This study increases the temporal fidelity of coastal permafrost bluff observations using near-annual high spatial resolution (<1 m) satellite imagery acquired between 2008–2017 for a 9 km segment of coastline at Drew Point, Beaufort Sea coast, Alaska. Our results show that mean annual erosion for the 2007–2016 decade was 17.2 m yr−1, which is 2.5 times faster than historic rates, indicating that bluff erosion at this site is likely responding to changes in the Arctic System. In spite of a sustained increase in decadal-scale mean annual erosion rates, mean open water season erosion varied from 6.7 m yr−1 in 2010 to more than 22.0 m yr−1 in 2007, 2012, and 2016. This variability provided a range of coastal responses through which we explored the different roles of potential environmental drivers. The lack of significant correlations between mean open water season erosion and the environmental variables compiled in this study indicates that we may not be adequately capturing the environmental forcing factors, that the system is conditioned by long-term transient effects or extreme weather events rather than annual variability, or that other not yet considered factors may be responsible for the increased erosion occurring at Drew Point. Our results highlight an increase in erosion at Drew Point in the 21st century as well as the complexities associated with unraveling the factors responsible for changing coastal permafrost bluffs in the Arctic.
Export citation and abstract BibTeX RIS
Introduction
Permafrost influences 30%–34% of Earth's coastlines (Walker 2005, Lantuit et al 2012). Ongoing and anticipated changes in the Arctic System such as reductions in sea ice extent (Perovich et al 2017), rising air (Overland et al 2017) and sea surface temperatures (SSTs) (Steele and Dickinson 2016), relative sea-level rise (Richter-Menge et al 2011), warming permafrost (Romanovsky et al 2010, Smith et al 2010), and increased storminess (Simmonds and Rudeva 2012) involving more frequent storm surges (Vermaire et al 2013) may all interact to amplify arctic coastal dynamics (AMAP 2017). Changes in the Arctic System will likely increase the vulnerability of these coasts to erosion and alter coastal morphologies, ecosystems, carbon export to oceans, infrastructure, and human subsistence lifestyles (Arp et al 2010, Radosavljevic et al 2016, Fritz et al 2017, Obu et al 2017, Couture et al 2018, Farquharson et al 2018b).
Despite the prevalence of permafrost coasts in the circumpolar north and their apparent vulnerability to change, there remains a paucity of information regarding their recent dynamics and how this varies spatiotemporally. Lantuit et al (2013) identified only 15 coastal change detection studies conducted between 2008–2012 accounting for less than 1% of the Arctic permafrost coastline. Further, since most coastal change detection studies report rates averaged over years to decades, it is difficult to determine the relations between changes in environmental forcing and the response of the coast. For example, Lantuit et al (2011) assessed the change in mean annual erosion rates for the Bykovsky Peninsula in Siberia and found no connection with the storm climatology for the region over the 55 year study period. In a different region, Overeem et al (2011) indicated that the duration of open water conditions could be a good first order predictor of coastal erosion based on similar increases in open water duration and erosion rates for 1979–2002 and 2002–2007 for Drew Point, Alaska.
Better understanding short-term coastal dynamics in the Arctic is important because erosion of permafrost coastal bluffs impacts infrastructure, subsistence activities, wildlife habitat, and the permafrost carbon feedback. Hotspots of coastal erosion may be ideal locations to explore the direct impact of specific environmental forcing factors on Arctic coastal dynamics because higher rates can be detected more accurately with remote sensing data. In this study, we combined the use of high-spatial resolution (sub-meter) satellite imagery derived from optical sensors (Quickbird, IKONOS, GEOEYE, Worldview-1 and -2) to document a decade of annual open water season erosion along a 9 km segment of the Alaska Beaufort Sea Coast (ABSC) located near Drew Point (figure 1). Drew Point provides a potential indicator site for anticipating changes in ice-rich permafrost coastal bluffs because this coastline is located in a zone of rapidly changing sea-ice cover. Our decade-long time series was then placed in the context of historic remote sensing observations for the site between 1955–2007 (Jones et al 2009a). Our study attempts to directly link the sweeping changes occurring in the Arctic System over the last decade with coastal permafrost bluff erosion at an erosional hotspot on the ABSC. The unprecedented time series of eroding permafrost coastal bluffs facilitated correlation testing of annual erosion with open ocean water duration, SST, storm number, cumulative storm strength, thawing degree days, and near-surface permafrost temperatures.

Figure 1. The Drew Point study area, Alaska Beaufort Sea Coast (ABSC). (a) The overlapping footprint of remotely sensed imagery used in this study is outlined with the red rectangle. The location of the meteorological station is shown with the yellow dot. (b) The location of Drew Point along the ABSC. Historic erosion rates from Gibbs and Richmond (2017) are shown for the period 1947–2010.
Download figure:
Standard image High-resolution imageStudy area
ABSC setting and Drew Point
The ABSC is composed of a low-lying (maximum elevation of ∼10 m) tundra plain that extends ∼1950 km from the Canadian Border to Utqiaġvik (formerly Barrow), Alaska, USA. Spatial and temporal rates of coastal change along the ABSC are known to be highly variable (Jorgenson and Brown 2005, Lantuit et al 2012, Gibbs and Richmond 2015, 2017), due to variability in ground-ice content (and wedge-ice content in particular) as well as variation in erosional processes, geomorphology, lithology, coastal orientation, near shore bathymetry, and the presence of barrier islands (Jorgenson and Brown 2005). Jorgenson and Brown (2005) and Gibbs and Richmond (2015) reported that the long-term average erosion rate along the ABSC between the late-1940s and early-2000s was ∼2 m yr−1. However, some particular sites eroded as much as 16–20 m yr−1. Ping et al (2011) assessed 48, 1 km segments distributed across the ABSC and found that mean annual erosion between 1950–1980 was 0.6 m yr−1, but increased to 1.2 m yr−1 between 1980–2000. Mars and Houseknecht (2007) compared land loss due to erosion by differencing Landsat satellite imagery with legacy topographic map sheets and also found a doubling in the rate of erosion between 1985–2005 relative to 1955 and 1985. Jones et al (2009b) used more precise techniques based on aerial photography for the exposed and north-facing, 60 km segment of the ABSC between Cape Halkett and Drew Point and found that the erosion rate increased from 6.7 m yr−1 (1955–979), to 9.7 m yr−1 (1979–2002), to 13.6 m yr−1 (2002–2007). Barnhart et al (2014a) reported that the mean erosion rate over a 7-km stretch of coast at Drew Point was 15 m yr−1 (2008–2011) and 19 m yr−1 (2011–2012).
We focus on a 9 km stretch of the Drew Point coastline located in the western region of the ABSC about 100 km east of Utqiaġvik and 200 km west of Prudhoe Bay (figure 1). The dominant erosional process at Drew Point consists of thermo-abrasion (Jones et al 2009b), although thermo-denudation also occurs here (Wobus et al 2011) (figure 2). Bluff height ranges from 1.6–7.1 m, with a mean of 4.4 m above the mean water level during LiDAR data acquisition on 6 August 2011. The near surface sediments consist mainly of ice-rich Holocene-aged lacustrine silts with local peat accumulations and contain large ice wedges. Sediments underlying lacustrine silts consist of transgressive marine Pleistocene silts and clays with sandy horizons near the base of the eroding bluffs (Farquharson et al 2018a). Estimates of total volumetric ground-ice content for permafrost along these bluffs approaches 80%–90%, (Kanevskiy et al 2013), with segregated and pore ice volumes accounting for 50%–80%, and wedge ice contributing nearly 30% in some locations (Wobus et al 2011). The fine grained composition of the bluffs, means that eroded sediment is easily transported away and does not accumulate and protect the base of the bluffs as is common elsewhere. Estimates of ice-wedge polygon dimensions, range from 6 to 25 m across with a mean size of ∼15 m (Wobus et al 2011, Kanevskiy et al 2013). Ice wedges are approximately 1–4 m wide near the surface and typically penetrate 3–5 m down from the surface. The Drew Point area is underlain by continuous permafrost with mean annual ground surface temperatures of about −9 °C (Smith et al 2010). Permafrost at a depth of 20 m at coastal sites along the ABSC has warmed by 0.6 °C–2.2 °C between 1989 and 2008 (Smith et al 2010).
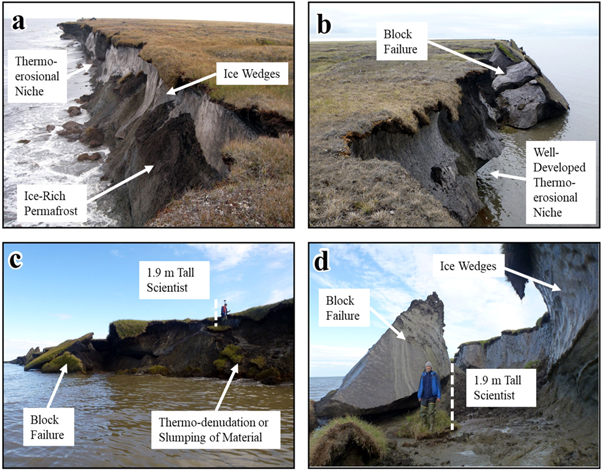
Figure 2. Field photographs demonstrating the dominant thermo-abrasion erosional process at Drew Point. Photos from the study coast showing (a) the exposed ice-rich bluff face and development of a niche prior to block collapse, (b) a well-developed niche and collapsed blocks of permafrost, (c) looking back towards a 5 m high bluff from a small boat showing collapsed blocks of permafrost as well as thermo-denudation to the right of the 1.9 m tall scientist, and (d) the base of the bluff looking along a series of ice wedges (failure plane) showing the collapse of a block of permafrost along a 7 m high bluff, with a 1.9 m tall scientist for scale.
Download figure:
Standard image High-resolution imageOffshore, water depths are shallow, the open water season is short, and the tidal range is on average only 15 cm. Nearshore water depth is less than 2 m within a distance of 0.5 km from the shoreline and increases to 3 m at a distance of 2.0 km from the coast. The nearshore open water duration at Drew Point has more than doubled between 1979–2009, increasing from ∼45 days to ∼90 days, with a higher proportion of the increase in open water duration occurring in the fall (∼0.9 days yr−1) relative to the early summer (∼0.7 days yr−1) (Overeem et al 2011). However, this area is prone to highly variable open water seasons and is influenced by sea-ice transport and break-up patterns from both the east and the west (Barnhart et al 2016). Between 2007–2012, the Beaufort Sea experienced the lowest September sea ice extents yet observed since the late 1970s (Ballinger and Rogers 2013) and has continued to exhibit similar patterns through 2017 (Perovich et al 2017). This increase in open water days has been accompanied by a warming trend in SST in the Beaufort Sea (Steele and Dickinson 2016). Air temperature has continued to increase in this region since 2000 as measured near Utqiaġvik, AK (Wendler et al 2012).
Rapid shoreline retreat rates observed along the ABSC may partially be explained by erosional processes uniquely associated with ice-rich permafrost coastal bluffs (Are 1988, Dallimore et al 1996). Lantuit et al (2008a) demonstrated a weak but statistically significant relation between ground-ice content and mean retreat rate, with higher mean annual retreat rates typically corresponding to coastlines with higher ground-ice content. Block failure following undercutting caused by thermo-abrasion and thaw slump activity (thermo-denudation) are common modifiers of Arctic coastal morphology and tend to be dominant erosional processes along ice-rich permafrost bluffs (Are 1988, Walker 1988, Günther et al 2012). Melting of ground ice is an important consideration as it can substantially reduce the volume of sediment input and cause thaw settlement in the nearshore, deepening the nearshore profile. Interestingly, observations made along this coast in 1901 (Schrader 1904) indicate that collapsed blocks could persist for 4–5 years (Leffingwell 1919). Such observations highlight that both the formation of erosional-niches followed by block collapse have been modifying this coast for at least the last century and that the combined impacts of climatic-oceanographic-geomorphologic conditional states have changed dramatically since the early 1900s.
Data and methods
Remote sensing observations and geospatial analysis
The primary objective of this study is to map coastal permafrost bluff changes and compare annual retreat rates with annual open water season duration and other factors to better understand the potential mechanisms responsible for the reported increase in erosion observed at Drew Point since the early 2000s (Jones et al 2009b, Overeem et al 2011, Barnhart et al 2016). We acquired ten suitable high spatial resolution satellite images from five different satellites: Quickbird, IKONOS, GEOEYE-1, and Worldview-1 and -2 (figure 3) for a 9 km segment of eroding permafrost bluffs located at Drew Point, Alaska, USA between 2008–2017. We only used the high-resolution panchromatic band provided by each of these satellites, with spatial resolutions between 0.5–1.0 m. The number of shoreline observations acquired in this study is 10, a significant increase from the previously available high spatial resolution observations, which was 4, for this site since the 1950s.
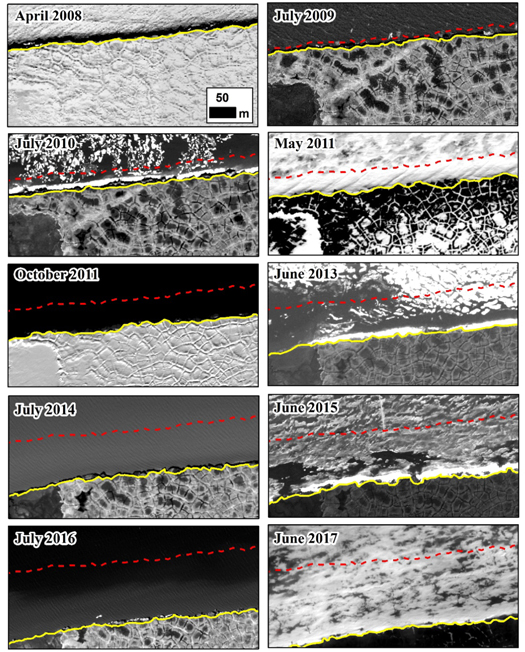
Figure 3. High resolution satellite images acquired for Drew Point between 2008–2017. The time series shows the same spatial domain in each frame at the same spatial scale. The respective coastal bluff position is shown in yellow in each frame. The red dashed line starting in July 2009 represents the 2008 coastline prior to the erosion season. More details on each image are provided in SOM table 1. Images copyright 2008–2017, DigitalGlobe, Inc.
Download figure:
Standard image High-resolution imageAirborne LiDAR data was acquired on 6 August 2011 for our study area, which provided a common base layer for georectifying all of the imagery. Initially, optical images were automatically orthorectified using the RPC information embedded in the image file and the LiDAR DTM (1 m postings), but the results showed variability in the position of ice-wedge intersections on the order of 2–5 m. To improve image rectification, we selected 20 ground control points per image using the LiDAR DTM as the base map. A second order polynomial transformation was applied resulting in the images being georectified to UTM NAD83 Zone 5N, with spatial resolutions ranging from 0.5–1.0 m. The mean rms associated with the georegistration process ranged from 0.44–0.85 m (SOM table 1), with a maximum individual registration point rms error always less than 1.5 m. Visual comparison of each optical image strip for our study area showed excellent spatial agreement and suitability for further analysis in spite of differing image acquisition conditions. Difficultlies in the use of automated approaches for delineating blufflines in high-spatial resolution optical imagery (as recently noted by Lantuit et al (2011) and Günther et al (2013, 2015)) required manual delineation of the coastal permafrost bluff line. The bluff line was manually digitized in each image independent of one another at a scale of 1:1000. We also included the bluff line position from 2007 aerial photography as reported in Jones et al (2009b) to expand annual coverage and have a complete decade of annual observations.
Table 1. Annual observations of coastal change and potential environmental forcing factors at Drew Point from 2007–2016. Mean, maximum, and daily OWD erosion values derived from high resolution satellite imagery. Storms and storm power value corresponding to the OWD between image acquisitions from the Drew Point Meteorological Station. Summertime thawing degree day (TDD) sums and near surface permafrost temperature (1.2 m depth) from June–November also derived from the Drew Point Meteorological Station. Sea surface temperatures (SSTs) derived from NOAA OISST V2 data from 71°N–72°N and 155°W to 153°W.
| Erosion year | OWD (Days) | Mean erosion (m) | Maximum erosion (m) | Daily OWD Erosion (m) | Storms (Number) | Storm power (m2 s−2 day/storm number) | TDD (air) | PF Temp (°C—June–November) | SST (°C) |
|---|---|---|---|---|---|---|---|---|---|
| 2007 | 84 | 22.2 | 41.7 | 0.26 | 9 | 1941 | 813 | −3.37 | 3.5 |
| 2008a | 107 | 15.9 | 48.8 | 0.15 | 9 | 1886 | 725 | −3.06 | 2.3 |
| 2009a | 96 | 19.4 | 44.1 | 0.20 | 13 | 2284 | 864 | −3.05 | 2.7 |
| 2010 | 84 | 6.7 | 19.6 | 0.08 | 8 | 3027 | 874 | −3.24 | 2.3 |
| 2011a | 88 | 17.0 | 42.1 | 0.19 | 9 | 2115 | 850 | −2.84 | 2.3 |
| 2012a | 105 | 22.6 | 43.0 | 0.22 | 17 | 1857 | 1230 | −2.94 | 2.0 |
| 2013a | 98 | 13.4 | 31.7 | 0.14 | 15 | 1155 | 999 | −2.89 | 1.5 |
| 2014a | 71 | 16.5 | 32.7 | 0.23 | 11 | 4870 | 644 | −2.61 | 2.0 |
| 2015 | 72 | 16.2 | 42.0 | 0.23 | 9 | 2484 | 947 | −2.66 | 1.1 |
| 2016 | 107 | 22.0 | 47.6 | 0.21 | 14 | 1315 | 910 | −2.57 | 2.0 |
aIndicates the time period between image acquistions spills over into adjacent open water season which has been accounted for.
Bluff position measurements were made at 10 m increments along the study coast using the Digital Shoreline Analysis System (DSAS v. 4.4) (Thieler et al 2017). This tool measures the change in distance between two vector lines relative to a baseline and is widely used to measure coastal changes in the Arctic (Jones et al 2008, 2009a, 2009b, Gibbs and Richmond 2015, 2017, Farquharson et al 2018). The baseline in our study was created by taking a buffer of the 2007 shoreline and isolating the offshore line vector. Transects were cast every 10 m along this baseline using a 200 m smoothing algorithm to account for subtle undulations in the coastline and to ensure perpendicular transects. This resulted in 888 transects along the ∼9 km baseline. Since two small segments of this coast represent areas with small streams flowing into the ocean without exposed coastal bluffs, these were removed from further analysis. The end result provided a measure of bluff line erosion along the study coast at 876 measurement points annually for the past decade.
While it is difficult to accurately assess errors in erosion rate measurements associated with this type of analysis (Lantuit et al 2011), we adopted techniques used in previous coastal change detection studies (Hapke 2005, Lantuit and Pollard 2008b, Jones et al 2009b, Gorkhovich and Leiserowiz 2011, Gibbs and Richmond 2017). These are based on the identification of factors that contribute to the error associated with feature delineation in the images under comparison (SOM table 1). Potential sources of error include the spatial resolution of the imagery, the rms error associated with image registration, and the ability to accurately map the bluffline in the same optical image, as a proxy for producers uncertainty as averaged from the digitization of the same image three times (SOM table 1).
Nearshore marine observations
We extracted daily and bi-daily sea-ice concentrations at Drew Point between 1979–2016 using Nimbus-7 SMMR and DMSP SSM/I-SSMIS Passive Microwave Data from the National Snow and Ice Data Center (NSIDC) to define annual open water periods (Overeem et al 2011). Using three, 25 km2 nearshore pixels, sea-ice concentrations <15% were flagged as open water. The open water duration was defined as the average of these three pixels exhibiting less than 15% sea ice concentration in a given year. The first, last, and total number of open-water days per year for each sampled pixel were compiled for the study period (figure 4). SST data were derived from the NOAA Optimum Interpolation (OI) SST V2 dataset (Reynolds et al 2002) for the three grid cells located between 71°N–72°N and 154°W to 152°W. Weekly SST data were averaged for the various open water periods determined with the NSIDC open water duration dataset. Locally, a time lapse camera was also installed on a pipe anchored into the subsea permafrost in August 2016 and provided hourly images for determining the wind speed and direction necessary for conducting geomorphic work which was used to determine storm conditions of interest (figure 5).
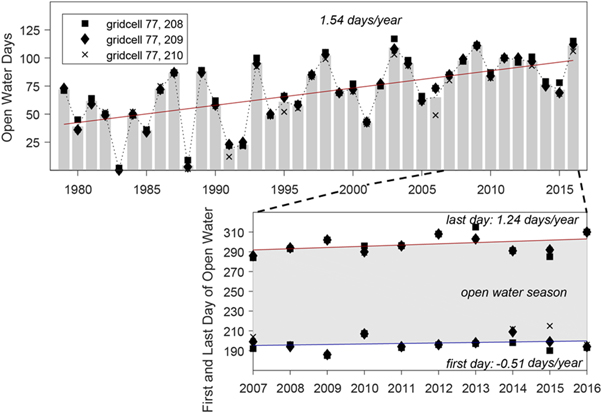
Figure 4. Open water duration determined at Drew Point from 1979–2016 using Nimbus-7 SMMR and DMSP SSM/I-SSMIS Passive Microwave Data from the National Snow and Ice Data Center (NSIDC). (a) The number of open water days using three 25 km2 nearshore pixels with sea-ice concentrations < 15% to determine 'open water' between 1979 and 2016. (b) The first and last day of the open water season between 2007–2016 for the same three pixels near Drew Point.
Download figure:
Standard image High-resolution image
Figure 5. Time lapse camera observations between 6 August 2016–13 September 2016. The images show block collapse, block degradation, and niche development for westerly, northerly, and easterly wind events associated with winds speeds of at least 5 m s−1. The blue arrow marks the starting bluff location in the 6 August image. Wind speed (m s−1) and direction (°) are provided below each image date. More than 20 m of permafrost coastal bluff line erosion occurred at this site during the 2016 erosion season.
Download figure:
Standard image High-resolution imageAtmospheric and terrestrial observations
Onshore, we collected hourly data for wind speed and direction and air and ground temperatures using the US Geological Survey meteorological station which has operated at Drew Point since 1998 (Urban and Clow 2016). We compiled hourly air temperature data from June–October to characterize the summer season, wind speed/direction data for the open water period for each respective year, and near-surface summer/fall (June–October) permafrost temperature data from 2007–2016. The hourly air temperature data have been summed to daily means and used to calculate the number of thawing degree days (based on 0 °C) for each period. The wind data and the time lapse camera (figure 5) were used to identify wind events or storms capable of forming erosional niches at the bluff base and/or collapsed block degradation (figure 5). The time lapse images showed that the geomorphologically significant winds were generally those with wind speeds greater than 5 m s−1 from directions of 240°–360° and 0°–90°. Thus, we modified the methods of Atkinson (2005) to represent winds exceeding 5 m/s from the directions mentioned above for a period of at least 12 h with no lulls >6 consecutive hours. Each wind or storm event was further summarized according to a storm-power metric (Atkinson 2005) taken as the square of a storm's average wind velocity relative to its duration. The various open water duration assessments were used to summarize storms or winds indicative of conducting geomorphic work in a given open water period. Permafrost temperature data were aggregated to summer/fall (June–November) seasonal means.
Results and discussions
Increase in erosion rates at Drew Point during the 21st century
Early 21st century, mean annual erosion has increased at Drew Point, ABSC when compared to the latter half of the 20th century (figure 6(a)). The increase in erosion reported in Jones et al (2009b) for the period 2002–2007 (16.3 m yr−1) relative to the 1955–1979 (7.0 m yr−1) and 1979–2002 (9.4 m yr−1) time periods has been sustained between 2007–2016 (17.2 m yr−1). This indicates that changes observed at this particular site are likely linked to ongoing shifts in the atmospheric, terrestrial, and/or marine conditions increasingly typical of the warming 21st century Arctic and not the result of enhanced erosion associated with a few catastrophic events where 25–40 m of erosion in a single year can have a big impact on the decadal-scale average (Are 1988, Lantuit et al 2012). In spite of a sustained increase in erosion of 17.2 m yr−1 at Drew Point, year to year variability in open water season erosion was as high as 15.9 m. The range in mean annual erosion of 6.7 m in 2010 to more than 22.0 m in 2007, 2012, and 2016 (figure 6(b)) provided the basis for standardizing nearly annual observations of coastal bluff change using the number of open water days between image acquisitions to explore various environmental drivers.

Figure 6. Permafrost coastal bluff erosion at Drew Point between 1955–2016. (a) Decadal-scale mean annual erosion rates from 1955–1979, 1979–2002, and 2002–2007 (Jones et al 2009b). Updated mean annual erosion rates for the past decade (2007–2016) presented in this study. Error bar represents standard deviation in measured erosion during the last decade. (b) Mean erosion from 2007–2016, based on annual erosion season determined by open water duration, for the same 9 km segment of study coast as in (a). Erosion values between 5–10 m shown in blue, 10–20 m shown in green, and greater than 20 m shown in red. The dashed line in (b) represents the mean annual erosion between 2007–2016.
Download figure:
Standard image High-resolution imageEvaluating erosion patterns based on open water duration
Erosion rates are typically reported on annual to decadal time-scales in the Arctic but focusing on the open water period when erosion is occurring may better resolve the processes driving coastal permafrost bluff retreat (Overeem et al 2011). Our nearly annual time series of high resolution satellite images allowed us to constrain open water season erosion between 2007–2016. In table 1, we report an erosion year which refers to the roughly annual period of image observations available for our study coast. Between 2007–2016, the average open water duration (OWD) was 91 days, but it ranged from 71 days (2014) to 107 days (2008 and 2016). In 2010, open water duration erosion was 0.08 m d−1 and more than 0.20 m d−1 in 2007, 2012, 2014, 2015, and 2016 (table 1). However, the difference in open water duration season did not correspond to periods of the lowest and highest observed coastal bluff losses. In 2008, 2009, and 2011–2014 the ability to bracket the open water period in a given year was not possible. However, OWD as derived from satellite remote sensing data constitutes our erosion year and thus we have considered the timing of image acquisition relative to measured erosion and accounted for this when summarizing erosional losses and open water days. Thus, when assessing erosion on a near-annual basis, the hypothesis that OWD is a good first order predictor of coastal erosion at Drew Point does not hold up.
Evaluating erosion patterns based on multiple forcing factors
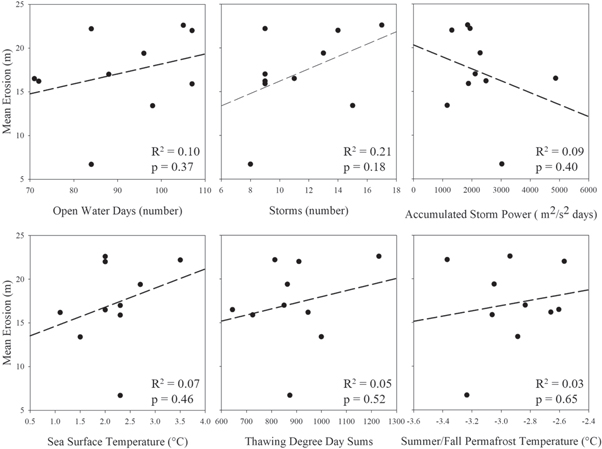
Factors contributing to patterns of coastal bluff retreat include open water season, SST, summer air temperature, and permafrost temperature, yet few studies have explored their correlation with rates of erosion (figure 7). Barnhart et al (2014b) indicated that the combination of OWD and the number of storms during this period were important factors controlling erosion at Drew Point. On average, there were ∼11 storms per year between 2007–2016. In the 2010 erosion year, the year with the lowest measured bluff retreat of 6.7 m, the fewest storms occurred (n = 8) and in the 2012 erosion year, the year with the highest measured bluff retreat 22.6 m, the most storms occurred (n = 17). While the assertion that the combination of the number of storms during an open water period holds true at Drew Point on the extreme end of observations, we find that the correlation between the two variables over the study period yields a low R2 (0.21) (figure 7) and an attempt to correlate variability in cumulative storm strength in a given erosion year yielded even lower relations (R2 = 0.09). We also correlated mean erosion year variables indicative of SST, summer air temperature, and permafrost temperature, and all were weak and not statistically significant (figure 7). Multiple linear regression, forward stepwise regression, and best subsets regression of our erosion year open water season time series at Drew Point did not reveal any statistically significant relations either.
Figure 7. Scatterplots of mean erosion between 2007 and 2016 and potential environmental forcing factors. Open water days derived from NSIDC, storms, storm power, thawing degree day (TDD) sums, and near surface permafrost temperature (1.2 m depth) derived from the Drew Point Meteorological Station, and sea surface temperature derived from NOAA OISST V2 data. All plots show coefficient of determination and linear regression lines (dashed).
Download figure:
Standard image High-resolution image
Permafrost coasts as an indicator of Arctic System change
Do the dynamics of permafrost coastlines serve as critical indicators of changes in the Arctic System?
Answering this question in a definitive way is difficult because few studies describe coastal erosion rates on an annual basis or during the most recent and rapid period of environmental changes in the Arctic. Based on decadal time-scales, observations at Drew Point, two additional examples from the ABSC, one from the Canadian BSC, and one from the Laptev Sea region in Siberia indicate an increase in permafrost coastal bluff erosion since the early 2000s. Tweedie et al (2012) documented recent annual erosion trends of 1–4 m yr−1 between 2003–2011, which is 2–4 times higher than historic rates reported for their ∼11 km study coast in Elson Lagoon in the western ABSC (Brown et al 2003). Along the eastern ABSC, Gibbs et al (2018) report that erosion along permafrost coastal bluffs at Barter Island increased from 1.6 m yr−1 (1979–2003) to 5.5 m yr−1 (2003–2017), a 3.4 fold increase. Irrgang et al (2018) report that decadal-scale erosion measured along a 210 km reach of the Yukon Territory mainland Canadian BSC increased from 0.5 m yr−1 (1970–1990) to 1.3 m yr−1 (1990–2011), a 2.6 fold increase. Observations from coastlines backed by syngenetic permafrost in the Laptev Sea region in Siberia also indicate erosion rates 1.5–3 times higher in the early 2000s relative to the period between 1950–2000 (Günther et al 2013, 2015). Thus, despite a poor correlation between any one environmental factor and rates of coastal erosion, accumulating evidence indicates multiple Arctic coastal sites have experienced increased erosion of permafrost coastal bluffs during the 21st Century.
What factors appear to be responsible for an increase in permafrost coastal erosion?
The detailed spatiotemporal observations between 2007–2016 presented in this study provide a range of coastal bluff loss magnitudes and variability in environmental conditions to attempt to partition out the factors most responsible for the increase in erosion since the early 2000s. However, there was no clear overarching factor or combination of factors that we compiled that could explain the high spatiotemporal erosion observations made possible at Drew Point with the satellite imagery. Annual observations from the Elson Lagoon study site on the western ABSC indicate that differences in sampling periods with high and low wave-driven wind activity influence bluff line erosion magnitude but correlations were inconclusive (Tweedie et al 2016). At Muostakh Island in the Laptev Sea, the two most important controls on annual erosion are OWD and summer air temperatures, with variation in TDD sums explaining the most variation (R2 = 0.95) (Günther et al 2015). However, observations over a period of three years or more highlight the importance of the coupled erosion of thermo-abrasion and thermo-denudation operating together in maintaining year-to-year trends in erosion (Günther et al 2015), the former of which we cannot directly measure with the satellite imagery used in this study. What these comparisons may illustrate is that there is no 'one size fits all' explanation for how Arctic coastlines will respond to changes in the Arctic System, a finding which highlights the need for regional based studies in the future.
How do various environmental forcing factors interact with one another to drive coastal permafrost bluff erosion?
The seasonality of coastline retreat and interannual variations of environmental factors suggest that increases in erosion are driven by lengthened periods of thermo-denudation and thermo-abrasion activity (Günther et al 2015). Interestingly, at Drew Point, multivariate analyses of the environmental data do not show significant correlations with our open water season erosion time series and thus failed to provide supporting evidence for this hypothesis. However, differences in the geological and geomorphological settings between the ABSC and the East Siberian coastline have to be considered in this regard, as in the latter region subaerial ground ice ablation at >20 m high bluffs may be more sensitive to air temperature increases compared to the low elevation thermo-abrasion dominated ABSC. The lack of significant correlations between mean annual erosion and the suite of environmental variables compiled in this study means we are likely not accurately capturing all of the environmental forcing factors at adequate resolutions or accuracies, that the system is conditioned by long-term transient effects or extreme weather events rather than annual variability, or that other not yet considered factors may be responsible for the increased erosion occurring at Drew Point.
One such factor might be related to the enhanced development of a cryopeg at Drew Point during the past several decades of permafrost warming in the region. During a drilling campaign conducted in April 2018, we encountered a cryopeg at Drew Point that ranged in elevation from 0.3 m asl to >2.3 m bsl. Ground temperature at this depth was ∼−8 °C yet the material was primarily unfrozen. It is conceivable that the 3 °C–4 °C permafrost warming in the region over the past several decades has increased the erodibility of the saline permafrost deposits located at this critical elevation where thermo-erosional niches actively develop during periods of elevated ocean water levels (Lorenson et al 2017). Additionally, since the block failure erosion mode is of erratic nature and nonlinear, interactions and dependencies of erosion rates to environmental forcing factors might have become blurred due to onshore resistance forces resulting from a predetermined ice wedge polygon system. While Overeem et al (2011) suggested that erosion occurring at Drew Point is non-fetch limited, including fetch in our analysis might also help to boost our ability to predict erosion at the site. In the open water season of 2012, for example, Thomson and Rogers (2014) highlight that waves in the Beaufort Sea developed beyond pure wind-driven seas and evolved into swells, which can travel further and have long-distance impacts in an ice free sea.
Better constraining Arctic coastal changes
Our study underscores the challenge in using remotely-sensed snapshots of landscape change to confidently identify the processes driving the observed increase in coastal permafrost bluff erosion rates along the ABSC. While our datasets facilitated a continuous suite of observed erosion over a decade for Drew Point, complex oceanographic and geomorphic feedbacks limit the ability of our approach to discern the impact of various environmental forcing factors. For example, empirically-based modeling approaches that have been employed in the Drew Point area have experienced a similar kind of limitation regarding process-based understanding. Our work, taken within the context of contributions from the rapidly-emerging Arctic coastal research community, encourages the pairing of carefully-designed field monitoring and multi-physics (i.e. oceanographic, thermal, and mechanical) model development. Taken together, this kind of 'measure and model' approach may further elucidate the sensitivities of Drew Point (and other indicator sites in the Arctic) to uncertain environmental futures.
Conclusions
Mean annual decadal-scale erosion rates during the early 21st century at Drew Point, Alaska are 2.5 times faster than historic rates measured between 1955–1979. While the present work provides a reliable observational dataset of erosion at Drew point, the nonlinear interaction between the environmental forcing factors responsible for erosion will require longer term measurements. The lack of significant correlations between mean annual erosion and the suite of environmental variables compiled in this study indicates that a longer term dataset is necessary before developing conclusions as to the interaction of forcing factors responsible for increased erosion occurring at Drew Point. Local occurrence of saline permafrost horizons that transform to an unfrozen state under generally warming conditions but still sub-zero temperatures compared to surrounding ice-rich permafrost, may possibly serve as one of those. Our analyses point towards the potential benefit of higher temporal resolution coastal observations and/or improved spatial resolution environmental datasets to better isolate and partition factors controlling erosion responses to environmental change. Our results highlight a sustained increase in erosion at Drew Point since the early-2000s as well as the complexities associated with unraveling the factors responsible for changing coastal permafrost bluffs in the Arctic.
Acknowledgments
BMJ, LMF, MX, and VER were supported by the National Science Foundation under grant OPP- 1745369. G G, I N, and F G were supported by ERC 399 #338335, HGF ERC-0013, and ESA GlobPermafrost. Addition funding support provided by Sandia National Laboratory, the University of Alaska Fairbanks Office of the Vice Chancellor for Research, and the USGS. We would like to thank Paul Morin (Polar Geospatial Center at University of Minnesota) and Tom Cecere (US Geological Survey) for tasking high-resolution satellite imagery for Drew Point. Any use of trade, product, or firm names is for descriptive purposes only and does not imply endorsement by the US Government.