


Abstract
Recent studies have used satellite-derived normalized difference vegetation index (NDVI) time series to explore geographic patterns in boreal forest greening and browning. A number of these studies indicate that boreal forests are experiencing widespread browning, and have suggested that these patterns reflect decreases in forest productivity induced by climate change. Here we use NDVI time series from Landsat, which has much higher quality and spatial resolution than imagery used in most previous studies, to characterize biogeographic patterns in greening and browning across Canada's boreal forest and to explore the drivers behind observed trends. Our results show that the majority of NDVI changes in Canada's boreal forest reflect disturbance-recovery dynamics not climate change impacts, that greening and browning trends outside of disturbed forests are consistent with expected ecological responses to regional changes in climate, and that observed NDVI changes are geographically limited and relatively small in magnitude. By examining covariance between changes in NDVI and temperature and precipitation in locations not affected by disturbance, our results isolate and characterize the nature and magnitude of greening and browning directly associated with climate change. Consistent with biogeographic theory, greening and browning unrelated to disturbance tended to be located in ecotones near boundaries of the boreal forest bioclimatic envelope. We observed greening to be most prevalent in Eastern Canada, which is more humid, and browning to be most prevalent in Western Canada, where forests are more prone to moisture stress. We conclude that continued long-term climate change has the potential to significantly alter the character and function of Canada's boreal forest, but recent changes have been modest and near-term impacts are likely to be focused in or near ecotones.
Export citation and abstract BibTeX RIS

Original content from this work may be used under the terms of the Creative Commons Attribution 3.0 licence.
Any further distribution of this work must maintain attribution to the author(s) and the title of the work, journal citation and DOI.
Corrections were made to this article on 10 January 2018. A focus issue link was added
1. Introduction
Boreal forests account for roughly 20% of the global carbon sink provided by forests and store about 32% of global forest carbon (Pan et al 2011). Because ecosystem function and forest health in boreal regions are intimately linked to seasonal temperature and precipitation regimes (Bonan et al 1992, Bonan 2008, Gauthier et al 2015), boreal forests are considered vulnerable to climate change (Lenton et al 2008). Indeed, a variety of recent studies point to changes in boreal ecosystems arising from increased frequency and intensity of summertime droughts (Angert et al 2005, Wang et al 2011, Dai 2012), permafrost degradation (Osterkamp et al 2000, Schuur et al 2008), and changes in insect and fire regimes (Kasischke and Turetsky 2006, Kurz et al 2008, Kasischke et al 2010), all of which increase the amount of carbon released to the atmosphere and provide positive feedbacks to climate warming (Randerson et al 2006, French et al 2011, Schaefer et al 2011). In addition, boreal ecosystems are experiencing longer growing seasons (Keyser et al 2002, Piao et al 2008, Xu et al 2013), drier summers (Angert et al 2005, Parida and Buermann 2014), altered fire regimes (Kasischke and Turetsky 2006, Balshi et al 2009, de Groot et al 2013), and changes in thermokarst extent and distribution (Schuur et al 2008). Recent studies have also suggested that tree mortality is increasing (Allen et al 2010, Peng et al 2011) and that boreal forest productivity is changing (Wilmking et al 2004, Lloyd and Bunn 2007, Ma et al 2012).
Because boreal forests are both extensive and remote, inventory data for this biome is not widely available and acquiring field data is challenging. Hence, many studies focused on large-scale changes in boreal forests have relied on remote sensing. In particular, a large and growing literature has used time series of normalized difference vegetation index (NDVI) data from the Advanced Very High Resolution Radiometer (AVHRR) to identify and map patterns of greening (increased NDVI) and browning (decreased NDVI), and have linked these trends to changes in forest productivity over large regions of boreal North America and Eurasia (Beck and Goetz 2011, Xu et al 2013). For example, using available fire databases to account for disturbance, Goetz et al (2005) and Beck et al (2011b) identified widespread browning trends in North American boreal forests. In a follow-on study, Guay et al (2014) compared trends across multiple sensors and different time periods. Their results also identified widespread browning in boreal forests, but with significant differences in geographic patterns and magnitudes across sensors.
While the AVHRR time series provides an important record of the Earth's terrestrial ecosystems over the last three decades, the quality of these data is compromised by a number of factors (Gutman 1999, Nagol et al 2009, Alcaraz-Segura et al 2010). Specifically, AVHRR data are collected at a nominal spatial resolution of 1.1 km. However, the most widely-used AVHRR data set is up-scaled to 8 km and possesses substantial geo-location uncertainty (Pinzon and Tucker 2014). Further, because the AVHRR instrument was designed for atmospheric remote sensing, its spectral and radiometric properties are sub-optimal for monitoring terrestrial ecosystems. To address this weakness, Ju and Masek (2016) performed a wall-to-wall analysis of NDVI trends in Canada and Alaska similar to those described above, but used data from Landsat, which covers roughly the same period as the AVHRR record, but provides imagery at 30 meter spatial resolution with much higher radiometric quality. Similar to previous studies (Neigh et al 2008, Fraser et al 2011, McManus et al 2012), they identified widespread greening above the boreal treeline, but showed substantial differences in boreal forest NDVI trends relative to results based on AVHRR data.
In this paper, we use the Landsat record to build upon and extend the results of Ju and Masek (2016) in two key ways. First, instead of analyzing all available imagery, we focus our analysis at a sample of locations encompassing over 400 000 km2 of Canada's boreal forest where imagery from adjacent Landsat orbits overlap, which increases the density of available observations, and by extension the robustness of our results, relative to locations where scenes do not overlap. This approach is important because identifying subtle trends in short NDVI time series is challenging. Further, because the repeat frequency of individual Landsat sensors is 16 days, the density of multi-temporal Landsat imagery is quite thin in many areas. Second, we use information related to forest type, disturbance history, and changes in precipitation and temperature regimes in Canada's boreal forest to characterize the role and relative contributions of disturbance history and climate change in observed geographic patterns of greening and browning.
More specifically, our analysis explores changes in Canada's boreal forest using NDVI time series acquired between 1984 and 2011 by the Landsat 5 Thematic Mapper (hereafter, simply Landsat). Using Landsat data we were able to isolate forest types, distinguish disturbed forests from undisturbed forests, and characterize ecosystem change in a way that was not previously possible. Our results indicate that the majority of changes in Landsat NDVI, in terms of both area and magnitude, reflect disturbance and post-disturbance recovery processes and do not indicate widespread ecophysiological responses to climate change. Further, we find that Landsat NDVI values in undisturbed areas of Canada's boreal forest were generally quite stable across the 28 year record that we examined. Where present, greening and browning linked to climate change were modest, not extensive, and concentrated in ecotones located at the boundary of the boreal forest climate envelope.
2. Data sets and methods
Study sites included in our analysis encompassed 46 locations ranging in size from 2400 km2 to 12 000 km2 that were situated in the overlap region between two or more Landsat scenes (hereafter, sidelap zones, figure 1) and spanned all five of the major ecozones in the Canadian boreal forest (Ecological Stratification Working Group 1996). To select these sites, we used the MODIS Vegetation Continuous Fields product (Hansen et al 2003) to identify sidelap zones with at least 10% tree cover. Among the sidelap zones that satisfied this criterion, we selected 46 via stratified random sampling. To provide a balanced sample, representative of forested areas within and across ecozones, the number of sites selected in each ecozone was allocated based on the forested area (as opposed to the total area) of each ecozone.

Figure 1. The Canadian boreal forest study area and the 46 sites used in the analyses (identified by red boxes) mapped on top of (a) ecozones (Ecological Stratification Working Group 1996), (b) AVHRR NDVI trends (Beck et al 2011), (c) tree cover from the MODIS VCF product (Hansen et al 2003), and (d) fire disturbance from the Canadian Large Fire Database (Stocks et al 2002). The sites were numbered in alphabetical order and their names are listed below the map.
Download figure:
Standard image High-resolution imageFor each site, all Landsat 5 Thematic Mapper (TM) L1T data available between 1984 and 2011 were acquired from the USGS archive (http://earthexplorer.usgs.gov/). These data are orthorectified, atmospherically corrected, and converted to surface reflectances by the USGS following standard best practices (Masek et al 2006, Loveland and Dwyer 2012, Markham and Helder 2012). Before performing our analyses, we pre-processed the image time series at each site to remove ephemeral contamination from clouds and other atmospheric effects that were not screened by the USGS (Zhu and Woodcock 2012). We then extracted maximum NDVI values at each pixel for each growing season, which we define here as occurring between day of year 180 and 240 (June 29–August 28 in non-leap years) (Sulla-Menashe et al 2016). As part of this process we evaluated whether variation in the day of year associated with annual maximum NDVI introduced spurious trends to NDVI time series (related to sub-seasonal dynamics in NDVI), and found no such effect (Sulla-Menashe et al 2016). Disturbance history at each pixel was characterized using the Canadian Large Fire Database (LFDB) (Stocks et al 2002), supplemented by forest and land cover changes that are not included in the LFDB (arising from undetected fires, insect damage, and human activity) that were identified using the Continuous Change Detection and Classification algorithm (CCDC) (Zhu et al 2012) (table S2). The Earth Observation for Sustainable Development of Forests (EOSD) land cover map of Canada (Wulder et al 2008), which is available at 30 m spatial resolution, was used to assign land cover and forest type labels to each Landsat pixel. To characterize climate (air temperature and precipitation) over the study domain, we used the Daily 10 km Gridded Climate Dataset for Canada, which covers all of Canada from 1950–2013 (National Land and Water Information Service, Agriculture and Agri-Food, Canada 2015).
Analysis of greening and browning trends in Landsat data was performed using panel regression techniques applied to 500 meter grids of Landsat data, where each panel included roughly 100–200 Landsat pixels. To do this, annual peak-summer Landsat 5 TM composites for 1984–2011 were reprojected to the equal area sinusoidal grid that is used to distribute data from NASA's Moderate Resolution Imaging Spectroradiometer (MODIS)3. Panel regression models were estimated for each 500 m panel using the plm package in R (Croissant and Millo 2008) to model linear trends in peak summer NDVI. Note that this approach is slightly different from methods used in previous studies, which have used both parametric and non-parametric methods to identify trends (e.g. Goetz et al 2005, Guay et al 2014). We used a panel regression-based framework because this method is well-suited for longitudinal (in this case gridded) time series that have a large number of points with relatively short time series (Hsiao 2014), and because the 500 m grid allows the Landsat data to be easily nested within (and compared to) MODIS or AVHRR time series.

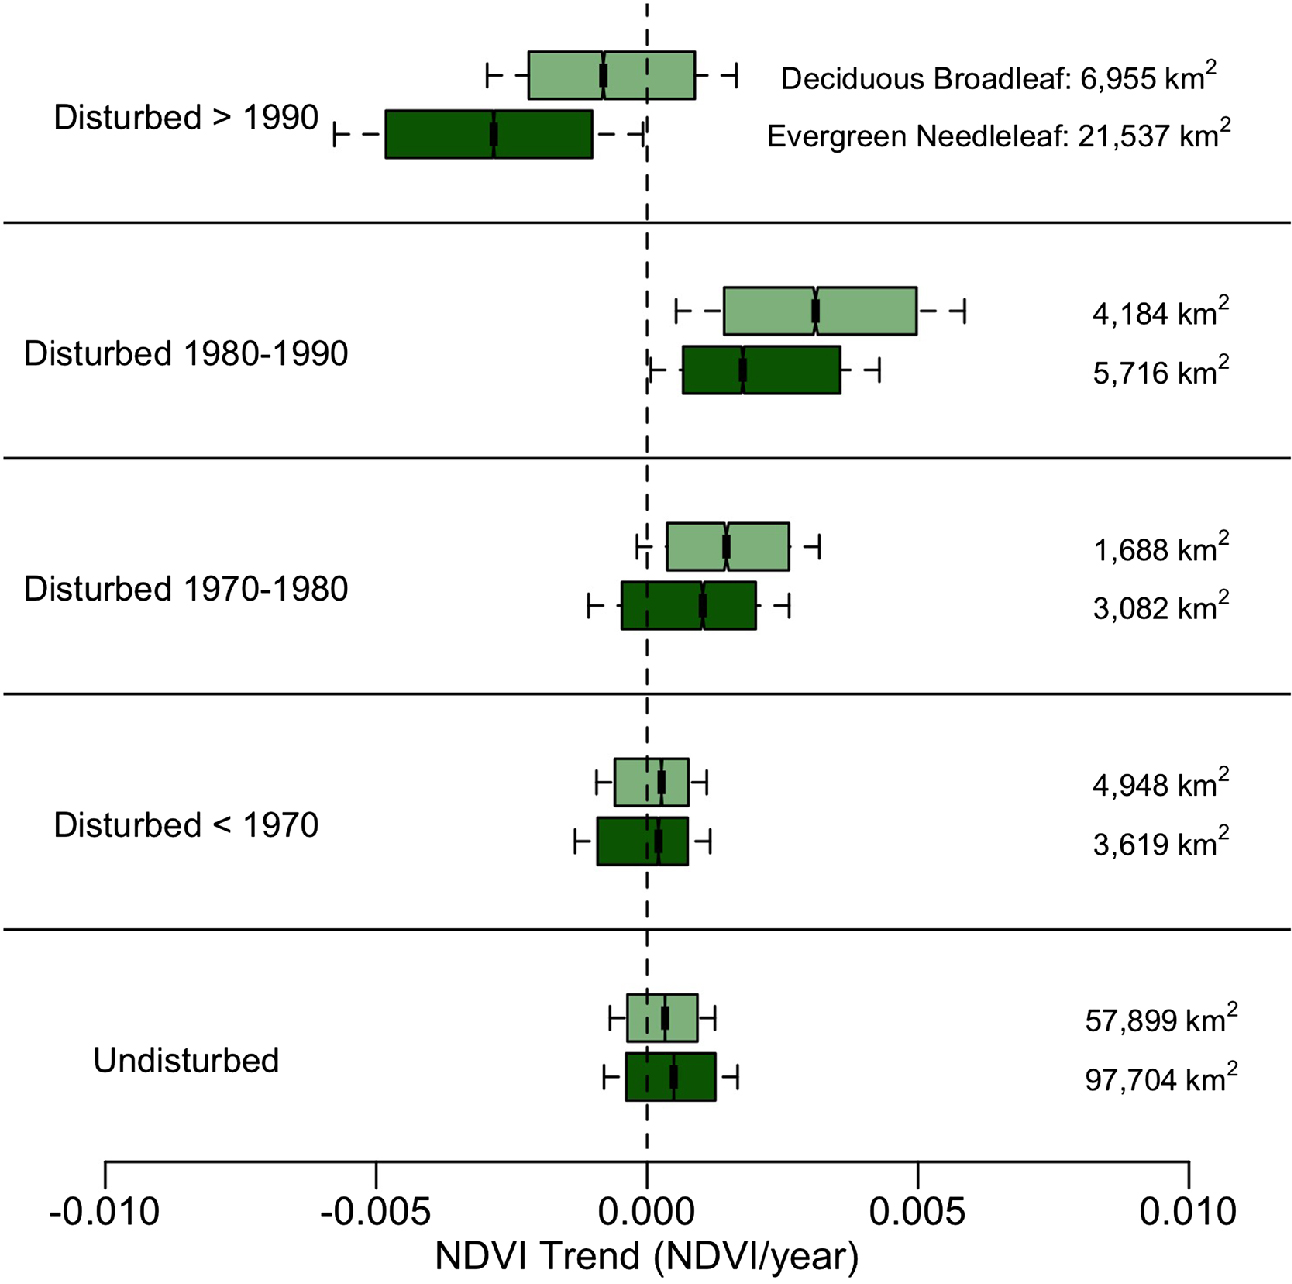
Figure 2. Boxplots for significant NDVI trends grouped by time since disturbance and forest type. The numbers to the right of the plot show the total area covered by Landsat pixels in each category. The historical disturbance information is from the Canadian LFDB (Stocks et al 2002) and was augmented by additional disturbances identified using the CCDC algorithm (Zhu et al 2012). The forest type information is from the EOSD land cover map of Canada (Wulder et al 2008).
Download figure:
Standard image High-resolution imageAncillary layers, including temperature and precipitation time series, and land cover and disturbance at the Landsat scale were summarized for each 500 m panel, and used to identify and compare trend results across different subsets of Landsat populations (e.g. disturbed versus undisturbed, conifer versus hardwood). To aggregate the land cover information to the panel-scale, we first condensed the 20-class EOSD map to a simpler 7-class version including water, non-vegetated land, non-forest vegetation, and four forest classes: treed wetlands, conifer forests, broadleaf forests, and mixed forests (Sulla-Menashe et al 2016). In a second step, a spatial filter was applied that removed edge pixels located between adjacent patches with different land cover types, thereby increasing overall confidence in land cover labels assigned to retained pixels and reducing the number of mixed pixels included in our analysis. As a final step, we computed the sub-pixel proportion of each land cover type within each 500 m panel. Forested panels were defined as panels with more than 60% forest cover and undisturbed panels were defined as panels with less than 10% disturbed area. For those panels identified as forested, we labeled each as either evergreen conifer or broadleaf deciduous based on a 50% threshold, and merged treed wetlands with evergreen needleleaf forests and mixed forests with deciduous broadleaf forests. Using these data, we performed two sets of analyses. First, we estimated NDVI trends, stratified by disturbance history and forest cover type, for each panel in each site. Second, we explored the nature and magnitude of spatio-temporal covariance between observed NDVI trends and climate forcing for undisturbed forest panels. As part of our analysis, we also examined trends in AVHRR GIMMS3g NDVI (Pinzon and Tucker 2014) over each of the study sites included in our Landsat-based analysis. More complete details regarding the data sets and methods used in our analysis are provided in the supplementary material, available at stacks.iop.org/ERL/13/014007/mmedia.
3. Results
Our analysis examined NDVI time series for 255 million Landsat pixels comprising 1 867 509 panels covering 400 877 km2, and spanning all major ecozones in Canada's boreal forest. This area includes almost 9% of the 3 million km2 of forested area in Canada's boreal zone (Brandt 2009). Our results clearly indicate that the most common and important source of change in NDVI time series is disturbance (figure 2), where the magnitude and direction of change depended on the timing of disturbance at each pixel. In disturbed forests, locations that were disturbed after 1990 generally showed negative NDVI trends, while those disturbed between 1980 and 1990 were dominated by positive NDVI trends. Significantly, NDVI values for forest pixels that were undisturbed or that were disturbed prior to 1970 were generally stable, with most locations exhibiting negligible NDVI changes.
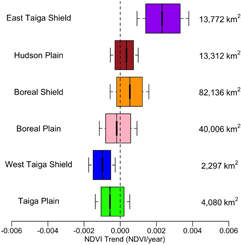
Figure 3. Boxplots of significant NDVI trends for undisturbed forest areas grouped by ecozone (Ecological Stratification Working Group 1996), with Eastern ecozones plotted on the top and Western ecozones on the bottom. The numbers to the right of the plot show the total area covered by Landsat pixels in each category.
Download figure:
Standard image High-resolution imageBy isolating and analyzing NDVI trends over undisturbed forests we were able to assess geographic patterns of NDVI changes in the context of local bioclimatic conditions (and changes therein). Undisturbed forests constituted 82% of the forested area in our panel data, of which 24% showed greening trends, 11% showed browning trends, 51% had no change (absolute value of the slope was less than 0.001 yr−1), and 13% showed absolute magnitudes of change greater than 0.001 yr−1, but which were statistically insignificant (p < 0.05).
Results from this analysis also show that in addition to being generally stable, Landsat NDVI time series in undisturbed forests displayed regional patterns that reflect differential sensitivity to geographic differences in both long-term mean climate and recent climate change (figures 3 and S1). Eastern and Central ecozones (East Taiga Plain, Hudson Plain, and Boreal Shield; figure 1), which have experienced warming but are generally not limited by moisture, were dominated by increases in NDVI. Undisturbed forests in Western ecozones (West Taiga Shield and Taiga Plain), which also experienced warming but tend to be drier and experience periodic moisture stress, showed modest decreases in NDVI (e.g. figures S5 and S7). The overall picture that emerged is one of relatively widespread (but modest) increases in NDVI and less disturbance in Canada's Eastern boreal forest, and relatively limited decreases in NDVI, but more extensive disturbance, in the West. In this context, it is important to note that the median magnitude of NDVI change for undisturbed forests in all ecozones was small (figures 2 and S1). For example, the median total change in Landsat NDVI for undisturbed forests in the East Taiga Shield, which had the largest magnitude of change, was less than 0.1 NDVI (figure 3, table S1). For comparison, we also computed AVHRR NDVI trends, stratified by forest cover and disturbance history, at each of our study sites (figures S8 and S9, table S3). Consistent with previous studies, results from this analysis show lower rates of greening and higher frequency of browning relative to corresponding results from Landsat.
To explore the bioclimatic basis of the results shown in figures 3 and S1 more fully, we plotted the direction and magnitude of observed Landsat NDVI trends for undisturbed forests on top of bioclimatic envelopes for five biomes described by Whittaker (1975) that broadly intersect the climate space occupied by (and adjacent to) boreal forests: tundra, boreal forest, temperate forest, woodland-shrubland, and temperate grassland-desert (figure 4). Superimposed on these envelopes are vectors showing changes in mean annual temperature and mean annual precipitation at each of our study sites during the study period, where the color of the vector indicates whether undisturbed forests in each site experienced overall increases or decreases in NDVI, and the width of the vector is proportional to the magnitude of observed change in Landsat NDVI.

Figure 4. Magnitude and direction of climate change at each study site described by changes between 1984 and 2011 in mean annual temperature and precipitation, along with the approximate location of climate envelopes for boreal forest and adjacent biomes according to Whittaker (1975) and adapted from Gauthier et al (2015). Each arrow shows the change in mean annual temperature and mean annual precipitation for a single site, where the color indicates whether undisturbed forests in the site experienced greening, browning, or no change. The width of the arrow indicates the slope in NDVI/year between 1984 and 2011.
Download figure:
Standard image High-resolution image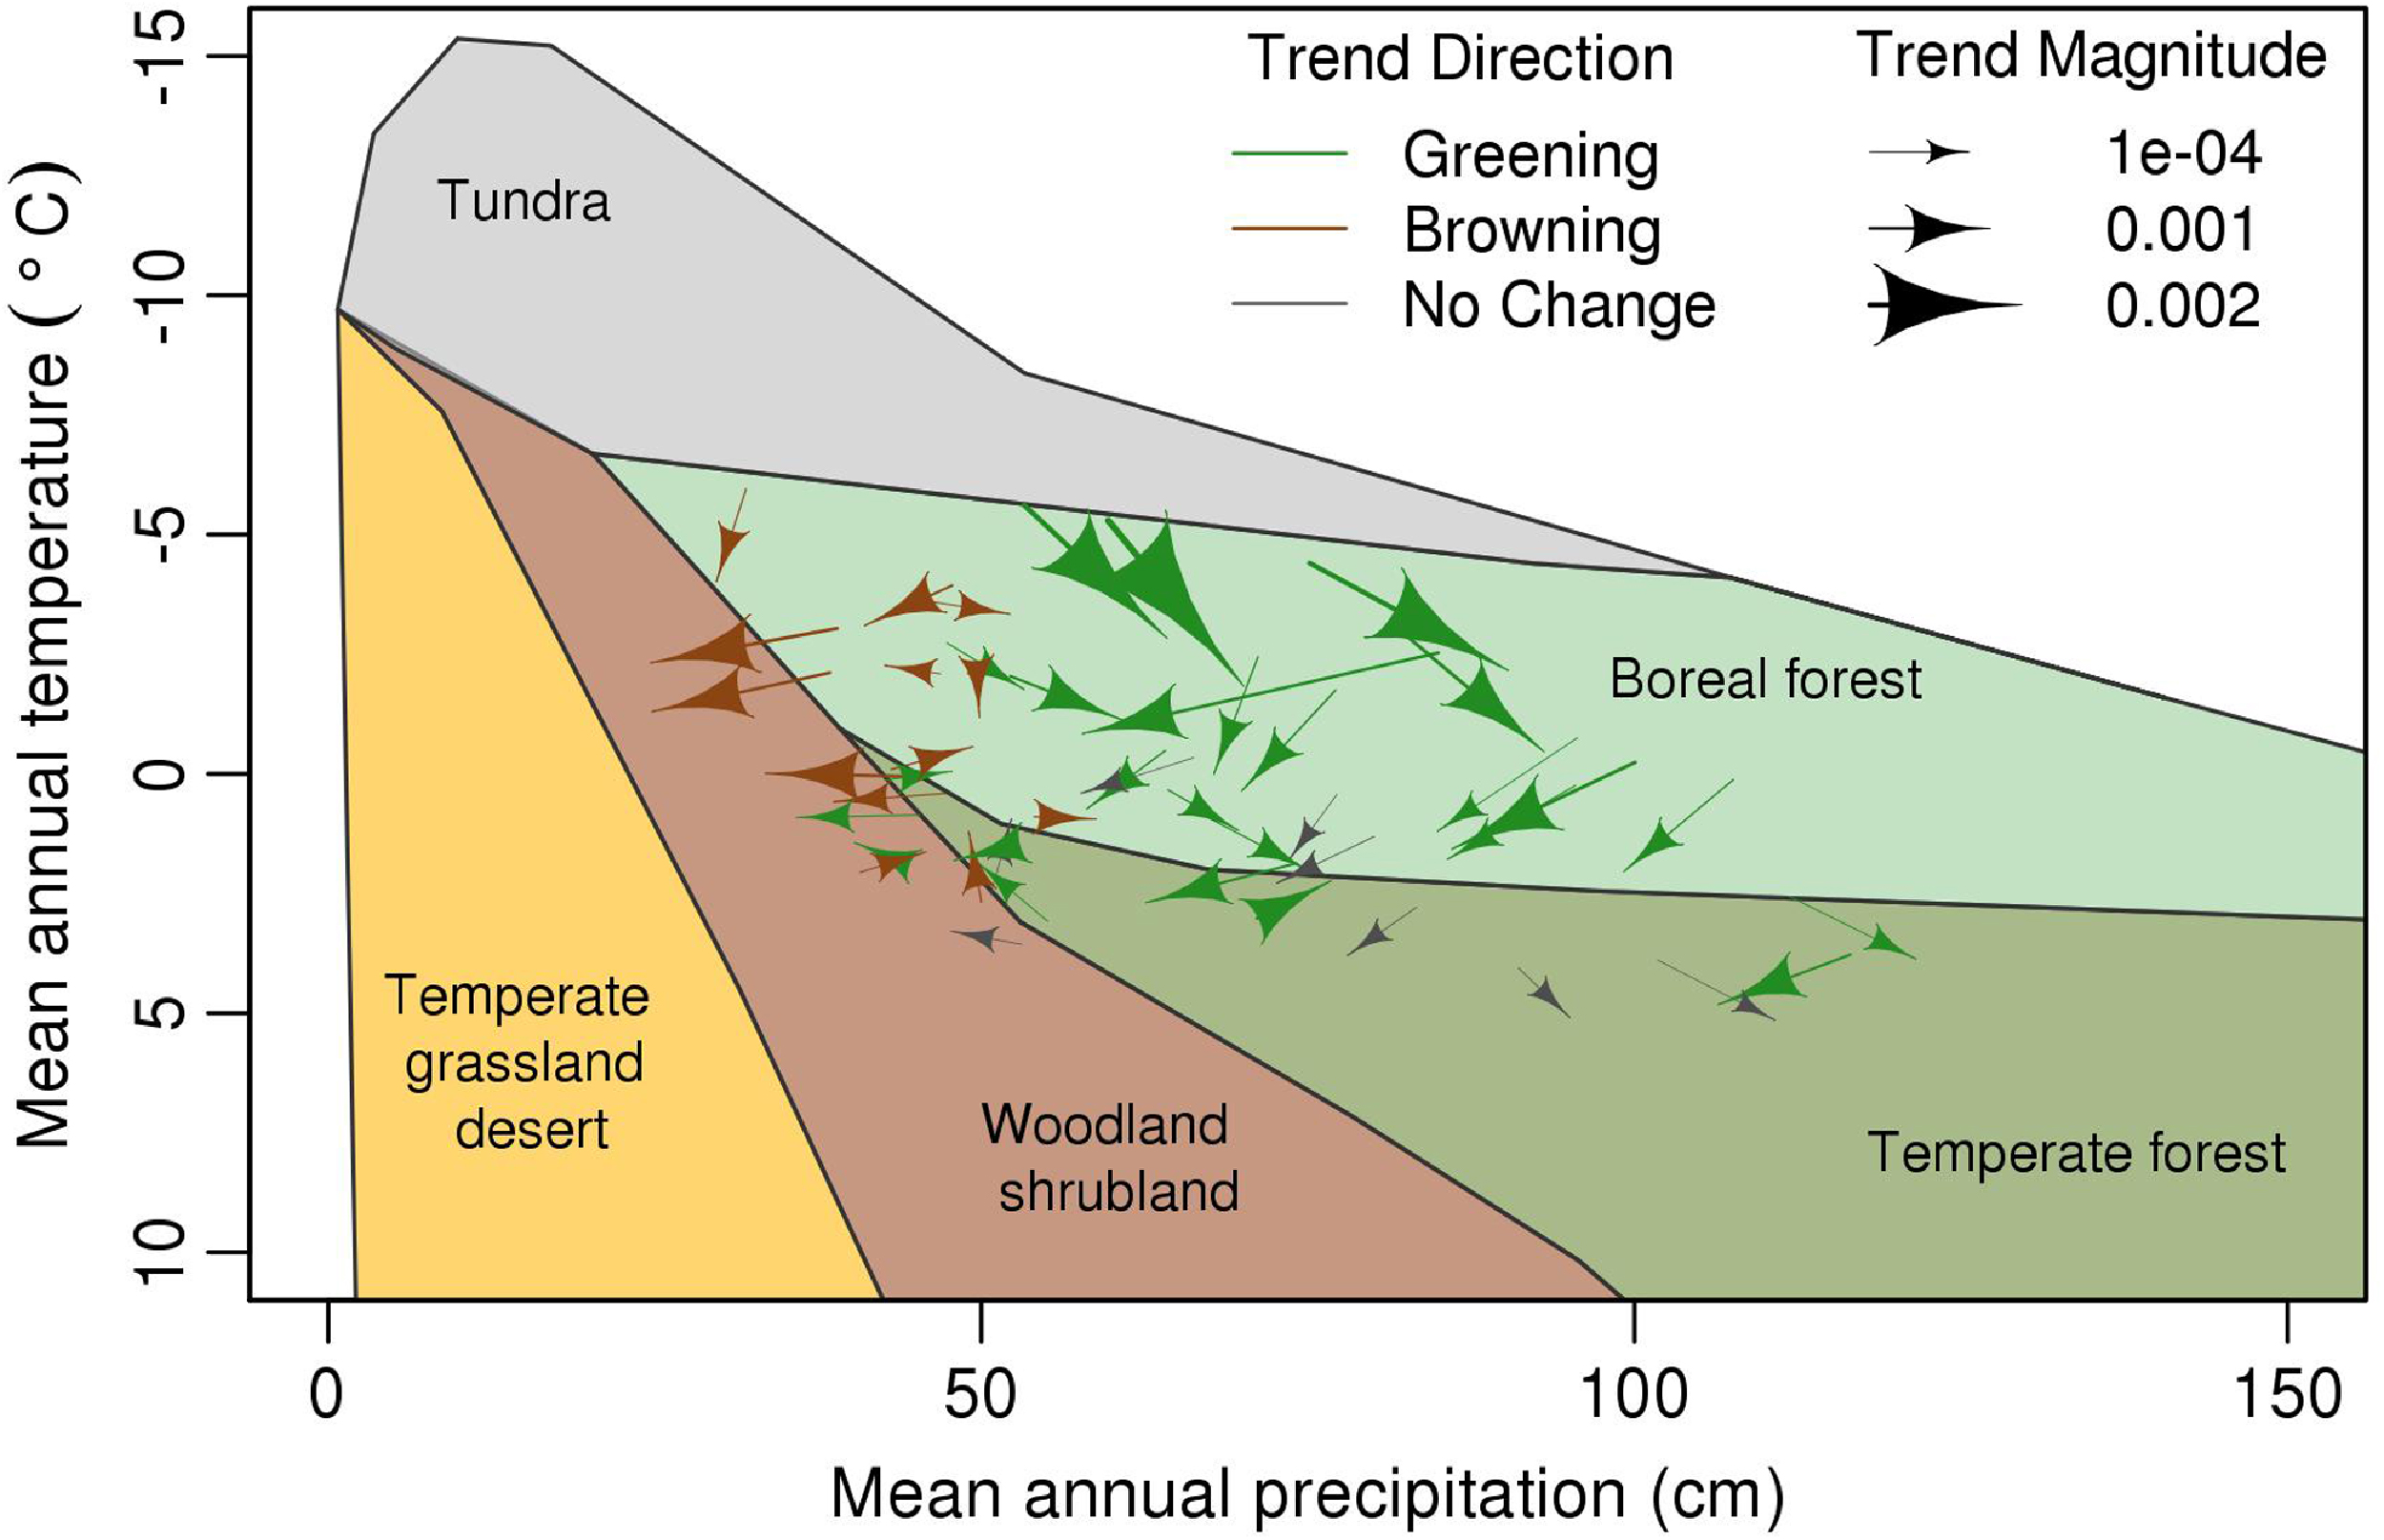
The large majority of sites included in our study experienced warming between 1984 and 2011 (table S1, figures 4 and S10). Temperature increases were modest at most sites, with the strongest warming occurring inside the boreal forest envelope near the tundra-boreal forest ecotone. Changes in mean annual precipitation were inconsistent at sites located in the boreal and temperate forest climate envelopes, while most sites in (or adjacent to) the woodland-shrubland envelope experienced drying. Undisturbed forests at sites located well inside the boreal forest climate envelope generally showed increasing NDVI trends, which suggests that warming, in the absence of moisture stress, is leading to increased green vegetation cover in these sites. Western sites located near the ecotone between the boreal forest and woodland-shrubland biomes, which are drier, generally showed decreasing NDVI trends. Overall, the patterns shown in figures 4 and S10 indicate that undisturbed forests in cooler and wetter regions of Canada's Eastern boreal forest tended to show increasing NDVI in response to warming, while undisturbed forests in Western Canada located at the bioclimatic boundary with woodlands tended to show decreasing NDVI, ostensibly in response to moisture stress.
4. Discussion
Mean annual temperatures in the sites we examined showed increases of 0.61 °C± 0.78 °C (mean ± 1 S.D.) during the study period. In contrast, changes in precipitation showed substantial variability; mean annual precipitation in Northwestern Ontario and Northern Quebec increased by as much as 13.8%, while areas of Central Quebec, Southern Ontario, and Northern Alberta decreased by up to 27.6% (figures 4 and S10, table S1). The key question that we address here is what, if any, is the ecological signature of climate change observed in NDVI time series from Landsat. Our results show that in Eastern and Central Canada, where ecological function is most strongly limited by temperature, increasing NDVI was much more common than decreasing NDVI in undisturbed forests. In Western regions, where moisture limitation is more important, decreasing NDVI was much more common. In other words, our results show that the impact of climate change on Canada's boreal forest is not uniform and depends on bioclimatic context: in the East, warming leads to increased NDVI, even in regions where precipitation has decreased. In the West, warming, in combination with regional decreases in precipitation, is mostly associated with decreasing NDVI.
Canada's boreal forest is geographically extensive, and much of it is remote. Hence, remote sensing provides an invaluable source of information related to the biogeography and ecological impacts of climate change in this biome. However, remote sensing-based characterization of change in boreal forests requires image time series with two important attributes. First, because changes in NDVI are often subtle, the geometric accuracy and radiometric fidelity of surface reflectance data used to create NDVI time series are critically important. Second, disturbance is frequent and extensive in Canada's boreal forest. Hence, characterization of how climate forcing is linked to changes in NDVI requires image time series from which exogenous sources of variance unrelated to changes in climate (i.e. disturbance) have been removed.
Here we argue that the Landsat archive, which spans essentially the same time period as the AVHRR record but provides 30 meter imagery with much higher radiometric and geometric qualities, provides a vastly superior basis for analysis and characterization of change in boreal forests. Leveraging this improved data quality, the results presented in this paper provide a significantly revised interpretation of what long-term NDVI time series tell us about the ecological impacts of climate change in Canada's boreal forest. Specifically, in contrast to previous studies based on AVHRR data suggesting that climate change is leading to widespread browning and decreases in boreal forest productivity, the vast majority of changes in Landsat NDVI were associated with disturbance, not climate change. Undisturbed forests, on the other hand, were quite stable and showed only small changes in NDVI. At the same time, our results do suggest evidence of direct ecophysiological impacts in undisturbed forests located in ecotones, where temperature or moisture controls limit the bioclimatic suitability for boreal forests. We therefore conclude that while continued long-term climate change has the potential to substantially alter the character and function of Canada's boreal forest, recent impacts (excluding those related to fire regimes) have been more modest than previous remote sensing-based studies have suggested, and near-term impacts are likely to be concentrated in ecotones at the edges of Canada's boreal forest bioclimatic envelope.
Finally, it is important to note that while this paper has focused on isolating greening and browning trends associated with disturbance from those caused by climate change, a variety of evidence points to complex connections (and changes) in the relationship between disturbance regimes and climate change in Canada's boreal forest (Kasischke and Turetsky 2006, Balshi et al 2009, de Groot et al 2013). In particular, warming and drying trends in boreal Canada clearly favor higher frequency of both fires and insect disturbance. Hence, browning trends in undisturbed forests in Western Canada also reflect conditions that are increasingly favorable for disturbance. Similarly, it is important to note that during the time period included in our analysis atmospheric CO2 concentrations have increased by roughly 50 ppm, which may have affected productivity in different ecozones (for example via water use efficiency, fertilization, etc.) (Girardin et al 2016, Forkel et al 2016). A full accounting of interactions among climate change, CO2 fertilization, greening and browning, and disturbance regimes in boreal forests is beyond the scope of the paper. However, given projected rates of climate change in boreal Canada, continued study is warranted to more fully understand how future changes in boreal temperature and precipitation regimes will affect coupled patterns of productivity and disturbance in this vulnerable, and geographically extensive biome.
5. Conclusion
We used 28 years of Landsat data to characterize greening and browning trends across Canada's boreal forest. Using Landsat data, we were able to distinguish changes arising from climate forcing from those caused by disturbance. The large majority of greening and browning that we detected was caused by disturbance, not climate change. In undisturbed forests, our results indicate that ecophysiological responses to climate change are restricted to bioclimatically sensitive regions of Canada's boreal forests, and where present, ecological responses were relatively modest and not extensive. In undisturbed forests of Western Canada, NDVI trends were more commonly negative, suggestive of stress and decreasing productivity. In Eastern Canada, increasing NDVI was more common, suggesting increasing vegetation cover and higher productivity.
We conclude that continued climate change is likely to have both positive and negative ecological impacts in boreal forests, where the nature and magnitude of these impacts will depend on local bioclimatology. In addition to extending and complementing recent work by Ju and Masek (2016), our results demonstrate that high quality remote sensing time series with spatial resolutions capable of discriminating landscape-scale properties and processes are required to elucidate and differentiate among multiple sources of variability in time series of remotely sensed imagery.
Acknowledgments
This study was part of the Arctic-Boreal Vulnerability Experiment (NASA grant NNX15AU63A), and was also supported by NASA Terrestrial Ecology Program (NASA grant NNX14AD57G). A special thanks is given to Chris Holden for developing software used to pre-process Landsat data.
Footnotes
- 3
Note that the true resolution of MODIS is 463 meters, which is the actual grid size that we used; we refer to these data here using the 500 meter convention that is widely used in the community.