

Abstract
In sub-Saharan Africa (SSA), tropical dry forests and savannas cover over 2.5 million km2 and support livelihoods for millions in fast-growing nations. Intensifying land use pressures have driven rapid changes in tree cover structure (basal area, biomass) that remain poorly characterized at regional scales. Here, we posed the hypothesis that tree cover structure related strongly to senesced and non-photosynthetic (NPV) vegetation features in a SSA tropical dry forest landscape, offering improved means for satellite remote sensing of tree cover structure compared to vegetation greenness-based methods. Across regrowth miombo woodland sites in Tanzania, we analyzed relationships among field data on tree structure, land cover, and satellite indices of green and NPV features based on spectral mixture analyses and normalized difference vegetation index calculated from Landsat 8 data. From satellite-field data relationships, we mapped regional basal area and biomass using NPV and greenness-based metrics, and compared map performances at landscape scales. Total canopy cover related significantly to stem basal area (r2 = 0.815, p < 0.01) and biomass (r2 = 0.635, p < 0.01), and NPV dominated ground cover (> 60%) at all sites. From these two conditions emerged a key inverse relationship: skyward exposure of NPV ground cover was high at sites with low tree basal area and biomass, and decreased with increasing stem basal area and biomass. This pattern scaled to Landsat NPV metrics, which showed strong inverse correlations to basal area (Pearson r = −0.85, p < 0.01) and biomass (r = −0.86, p < 0.01). Biomass estimates from Landsat NPV-based maps matched field data, and significantly differentiated landscape gradients in woody biomass that greenness metrics failed to track. The results suggest senesced vegetation metrics at Landsat scales are a promising means for improved monitoring of tree structure across disturbance and ecological gradients in African and other tropical dry forests.
Export citation and abstract BibTeX RIS
1. Introduction
Tropical dry forests (TDFs) cover over 2.5 million km2 across sub-Saharan Africa (SSA) and provide critical habitats, ecosystem services and natural resources for countries with the world's fastest-growing human populations (Campbell 1996, Rudel et al 2013). Land use and climate change pose significant threats for African TDFs. Increasing demand for agricultural land and forest resources has driven high net deforestation rates since 2000 across SSA. (Rudel et al 2013). TDFs provide key resources such as timber and wood-based fuels, which comprise over 70% of total energy consumption in SSA (Kebede et al 2010), and important sources of alternative income for smallholder farmers who face unpredictable crop harvests because of shortening, increasingly variable rainy seasons (Lyon and Dewitt 2012, Luoga et al 2000). Rainfall and temperature variability may also affect tree productivity and capacity for regrowth following disturbance. Amid rising pressures on trees and forests, initiatives such as World Resource Institute's AFR100 landscapes are calling for increased attention to conservation of African TDFs and sustainable use of forest resources (WRI 2016).
Given current land use pressures, there is a need for improved capacity to monitor attributes of tree cover structure at landscape scales, such as basal area and biomass, in order to guide forest conservation. Remote sensing offers synoptic, repeatable means of measuring tree cover and structure at landscape scales. Recent satellite-derived products such as Global Forest Watch (GFW) forest maps are promising developments (Hansen et al 2013). However, as they are calibrated at global scales, their methods are not well tuned to quantify tree and forest structure variability in shorter-stature forests and woodlands (< 5 m stem heights, canopy cover < 50%) common across African TDFs. GFW forest change thresholds only count forest loss or gain areas as regions experiencing > 50% canopy cover changes, and thus miss many regions of forest area loss and gain occurring in open-canopy (< 50% cover) woodlands (Hansen et al 2013). GFW's own accuracy assessments reflect these problems, which show a 48% false-negative rate in detection of forest cover loss in SSA, and a 52% false negative rate across tropical forests globally (Tyukavina et al 2015). Other global land cover map products (GlobCover at 300 m resolution, MODIS land cover version 5 (MCD12Q1) at 500 m resolution) also show high rates of disagreement in Africa (Fritz et al 2011). Although more recent work has focused on refining remote sensing approaches for African forests across gradients from Congo to South Africa (Hansen et al 2016), little work has addressed how forest structure and land cover relate to within-landscape gradients such as forest regrowth age, management, or disturbances in African TDF regions.
The first challenge for optical remote sensing of tree structure in African and other TDFs is to understand how land cover, encompassing canopy and ground cover features, and stem structure relate in the field. In African TDFs, landscapes are complex mosaics of mature and increasing proportions of regrowth forest areas, shifting agricultural fields and village areas with patch sizes from 0.5−5 ha (Mayes et al 2015). Mature TDFs have highly variable basal area (5–30 m2 ha−1) and aboveground biomass (50−150 Mg ha−1) (Williams et al 2008, Kalaba et al 2013a, McNicol et al 2015, Chidumayo 2013). Tree cover exists with highly variable sets of canopy and ground cover features across age, disturbance and edaphic regions including closed and open-canopy forests, woodlands and seasonally flooding grasslands.
An important part of addressing the challenge above is examining how multiple types of land cover features relate to tree structure. Greenness-related field and satellite measures underlie many widely used global methods for optical remote sensing of tree structure (Hansen et al 2013, Baccini et al 2012). However, past studies in African dry forests have found that greenness measures alone, such as the satellite-derived normalized difference vegetation index (NDVI), have correlated only moderately to canopy and forest structure (Ribeiro et al 2008, Halperin et al 2016). Non-green land cover components, such as woody stem density and canopy structure, or patterns in leaf litter, senesced grass or exposed substrate, can also relate to forest structure. Studies of tree structure with remote sensing in North American Pacific Northwest, Russian and Brazilian forests have found non-green land cover metrics correlated as well or better to aspects of tree structure than greenness measures (Sabol et al 2002, Adams et al 1995, Healey et al 2005). While past studies have collected tree inventories to assess forest structure changes across regrowth chronosequences in African dry forests (Williams et al 2008, Kalaba et al 2013b, Chidumayo 2013, McNicol et al 2015), none have collected data on canopy and land cover features alongside stem inventories to study how green and non-green land cover materials relate to forest structure.
The second challenge to remote monitoring of tree cover structure is identifying how local to regional field data on land cover and forest structure relate to remotely sensed data. Developing field-to-satellite data relationships is akin to developing appropriate calibration curves with laboratory instruments, such as reflectance or mass spectrometers, using known standards that span an expected range of analyte concentrations for a set of samples. African TDFs occupy the low end (50−250 Mg C ha−1) of typical global tropical forest biomass ranges (200–500 Mg C ha−1) (Baccini et al 2012, Aber and Mellilo 1991). Recent moderate-resolution optical (Landsat, 30 m pixel) and radar-based assessments (ALOS-PALSAR, 12–25 m pixel scale) show that the majority of forest change events occur at small spatial scales of < 2 ha (Ryan et al 2012, Mayes et al 2015). At < 2 ha spatial scales in these low-biomass regions, there is poor understanding of how land cover features vary across landscape-scale gradients of forest structure pertaining to edaphic conditions, stand age or disturbance history.
Our goals in this paper are to: (1) characterize relationships among stem structure, canopy and land cover features reflecting landscape-scale gradients in tree structure, (2) relate field data to satellite-derived green and non-green land cover metrics in an African dry forest landscape, and (3) map and assess patterns in tree stem structure at landscape scales. We test a hypothesis that exposure of senesced vegetation ground cover features, modulated by tree canopy cover, relates inversely to tree basal area and biomass, and can serve as a comparable or improved indicator of tree stem structure to green vegetation-based metrics. Subsequently, we produce new satellite-derived maps of tree basal area and aboveground biomass and assess their results through comparisons with field data and known landscape-scale trends in tree cover structure.
2. Methods
Our study design combined use of field and remotely sensed data to improve understanding of how land cover relates to tree structure, and how optical satellite data can be used to model tree structure in an African TDF landscape. The basic sections of our study and their relationships to one another are illustrated in a schematic diagram keyed to relevant parts of the methods section (figure 1).
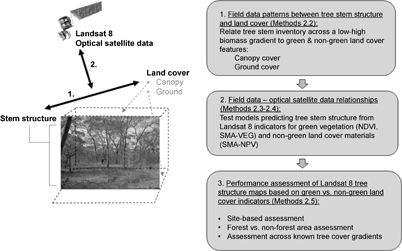
Figure 1 Flowchart depicting major parts of the study and associated methods. (1) Field study of tree structure–land cover relationships, with land cover separated into canopy and ground cover features. (2) Quantification of relationships between field data and Landsat 8 satellite metrics of non-green and green land cover features. (3) Computation and assessment of new tree structure maps (basal area, biomass) based on optical remote sensing indicators of green and non-green land cover features.
Download figure:
Standard image High-resolution image2.1. Study area
Our study area is located in central Tabora Province, western Tanzania, in the northeastern miombo woodlands (5.0 °S, 32.8 °E) (figure 2). Tree covered areas span dense forest and woodland areas (canopy cover 50%–100%), areas of sparse canopy cover (< 20%) in lower-lying seasonal drainages (locally called mbuga), and agricultural areas largely but not completely cleared of tree cover (canopy cover <10%) (figures 3(b)−(d)) (Frost 1996). Mean annual temperature is 23.9 °C and mean annual precipitation is 770 mm (2000–2009), with 90% falling between November and May. In 2012, Tabora had a population of 2.3 million people and experienced high rates of forest turnover and net deforestation from the mid-1990s–2010s typical of many miombo landscapes during this time. Forests in the study region fall under a variety of management regimes, including nationally managed reserves (Igombe Forest Reserve) and village-managed forest areas (figure 2(a)). Of standing regional forest cover in 2011, an estimated 16% consisted of regrowth since 1995 (Mayes et al 2015).

Figure 2 Location of the Tabora, Tanzania study area. (a) Tabora, Tanzania (black polygon) is located in the northeastern part of the miombo woodlands (green) which span 2.5 million km2 across their sub-Saharan Africa ecoregion. (b) Land cover of Tabora, Tanzania shown in a Landsat 8 false-color image mosaic from June–July 2015. Tree cover-dominated TDF regions predominate to the south, shown in darker greens. Village areas, which dominate the northern half of the province, are a mix of shifting cultivation, mature and regrowth woodlands. The gray box indicates the remote sensing training region, and yellow dots indicate locations of field sites (more details in figure 2). Reprinted from Mayes M T et al (2015). Copyright, with permission from Elsevier.
Download figure:
Standard image High-resolution image
Figure 3 Locations of field sites, regions of interest and image validation sites for forest monitoring in Tabora Region, Tanzania. (a) Landsat 8 false-color image of the 2470 km2 training area in the dry season, 14 July 2015, with land cover appearing as in figure 1. Dark-bordered yellow dots indicate 18 sites across a forest regrowth chronosequence where field data were sampled (photos of regrowth sites shown in figure S1). Boxes 1 and 2 indicate two regions for forest monitoring with different land management regimes: 1—Igombe Forest, a nationally managed forest reserve; 2—the Millennium Villages Project, Mbola region, a locally-managed village landscape. (b)–(d) Photos of landscape-scale tree cover gradients from July 2015, including (b) dense woodland (50%–100% canopy cover), (c) sparse woody vegetation (10%–50% canopy cover), often at boundaries of seasonal drainages (black arrow), and (d) little to no-tree cover (cleared) areas (< 10%). Across regions 1 and 2, we chose 35–40 image-validation points for evaluating maps of tree structure across the high-low biomass gradients pictured in (b)−(d). On the map in (a), green dots indicate dense tree cover validation points, black dots indicate sparse tree cover, and white dots indicate low or cleared tree cover areas.
Download figure:
Standard image High-resolution image2.2. Field data
We measured tree stem structure and land cover features across 18 woodland sites spanning a forest regrowth chronosequence of ages 3 yr to maturity in the early to mid-dry season (July 2015) (figure 3(a), supplementary figure S1). At this time, agricultural fields are harvested, while most trees retain moderate canopy leaf cover, which maximizes the landscape-scale contrast in land cover materials across gradients of tree cover. We chose regrowth field sites using a combination of remote sensing, field visits and interviews with local people. All sites had > 3 yr since fire, prior history of maize cultivation, flat topography (slope < 2%) and sandy soils (texture > 70% sand). Of accessible, intact mature forest sites, three were under national jurisdiction of the Tanzania Forest Service in Igombe Forest Reserve and three were in village-managed areas (figure 3(a)).
Field site sizes and locations were established balancing needs to measure large enough areas to relate to 30 m resolution Landsat data (Mayes et al 2015, Elmore et al 2000), adequately sample representative distributions of forest structure across space (Woollen et al 2012), and find comparably sized areas across the landscape without severe recent disturbance. We chose a 0.25 ha field site design (50 × 50 m) used previously to quantify carbon stock accumulations across miombo forest chronosequences in Mozambique (Williams et al 2008). Sites were located as far as possible from boundaries such as roads or field edges. We measured tree stem structure, canopy and land cover in a spatially aligned manner within four circular sub-plots of 10 m radius, located using a stratified random sampling design in each quadrant of field sites (Williams et al 2008).
For tree cover structure, we inventoried stem basal diameter and diameter-at-breast-height (dbh) at 1.3 m for all trees > 5 cm dbh in the sub-plots. Allometric relationships specific to the miombo and global dry tropics were used to convert stem sizes to biomass (table 1). Basal area and biomass were summed across all plots and normalized to the sum of sub-plot areas (∼ 1/8 ha) to calculate tree basal area and biomass density (Williams et al 2008).
Table 1. Allometric equations used to calculate tree biomass from field data.
| Reference | Equation | Source country | Notes |
|---|---|---|---|
| Chidumayo 2013 | log (B) = 2.553*log(dbh) − 2.563 | Zambia | MAP 894 (44) mm yr−1 (1967–2009) |
| Ryan et al 2011 | log (B) = 2.601*log(dbh) − 3.629 | Mozambique | MAP 850 (269) mm yr−1 (1956–1969, 1998–2007) |
| Malimbwi et al 1994 | log (B) = 2.603*log(dbh) − 2.959 | Tanzania | MAP not reported. Study location along Dar es Salaam-Morogoro Road. |
| Brown et al 1989 | B = 34.47–8.067*(dbh) + 0.659*(dbh)2 | Pan-dry tropics | Global dry tropics |
Notes: log = natural logarithm. B = Biomass in kg. dbh = diameter at breast height (1.2 m) in cm.
For canopy structure, we recorded two types of data at circular sub-plot centers, and at 5 m and 10 m positions along three radii at 120 degrees to each other for a total of seven data points per sub-plot. First, we measured plant-area index (PAI) data using an LAI-2200 photosensor (LiCOR, Lincoln, NE) at 1.3 m height. Second, we took spherical densitometer (grid-etched convex hemispherical mirror) surveys of cover conditions, following a classical United States Forest Service method (Strickler 1959, Korhonen et al 2006), accounting for four cover types (green leaf, senesced leaf, woody material and open sky (no material)) (see supplementary text 1-ST1 available at stacks.iop.org/ERL/12/085004/mmedia). For ground cover data, at the same seven points where canopy data were taken, we used a modified point-line transect method and tallied, summed and averaged proportions of the following land cover materials: leaf litter, green grass, senesced grass, woody litter, roots/stems, charred organic matter, ash, and bare substrate. The point-line transect method has been used widely in measuring land cover in semi-arid regions and has been shown to scale successfully between ground and satellite data (Pilliod and Arkle 2013, Elmore et al 2000).
2.3. Satellite data and image analysis
We acquired six Landsat 8 OLI scenes from June–July 2015 from the NASA/USGS ESPA system covering Tabora Province (paths 170-2, rows 63–65), which were pre-processed to surface reflectance using the L8SR algorithm (Vermote et al 2016). The image mosaic was subset to a 2750 km2 study area encompassing field sites (figure 2(b), figure 3(a)). Using the six visible, near and shortwave infrared optical bands with 30 m resolution, we conducted spectral mixture analyses (SMA) using field-validated endmembers (EM) to model land cover (Mayes et al 2015). SMA models pixel reflectance values as linear multiplicative sums of the reflectance of known materials, subject to constraints that EM fractions must equal 1 and there are no negative values, and acts as a physical modelling technique that estimates the proportion of known materials that comprise landscape surfaces (Adams and Gillespie 2006, Adams et al 1995). We used a fixed-endmember SMA approach, using single endmembers for four materials consistent with categories used for canopy and ground cover data: green vegetation (GV), non-photosynthetic vegetation (NPV), substrate and shade, which were chosen from georeferenced field sites with high proportions of these materials, and successfully used for forest change mapping in Tabora, Tanzania (Mayes et al 2015) (supplementary figure S2). Outputs of SMA are images with pixel values from 0–1 representing modeled proportions of endmember materials comprising land cover surfaces. We calculated NDVI images to compare how this commonly used greenness-based measure for land cover performed against SMA for representing miombo tree cover structure. To deal with image variability from scene to scene, we normalized EMs and NDVI to scene summary statistics by calculating Z-scores on a per-pixel basis.
2.4. Analyses of patterns within field data on stem structure and land cover, and between field and Landsat satellite-based green and non-green land cover metrics
We assessed patterns among field data on forest stem structure and land cover (canopy and ground cover) and satellite data across forest sites and site age groups, using analysis of variance (ANOVA), Tukey's honest significant difference means comparisons (p < 0.05) and ordinary least-squares linear regression. Given log-normal distributions of basal area and biomass, we developed log-linear models to predict tree structure (natural log-transformed basal area, biomass) from satellite data using three Landsat-derived indices: two of the SMA output images (Landsat SMA-NPV and SMA-GV) and NDVI. Landsat SMA-NPV, SMA-GV and NDVI values were extracted for 3 × 3 pixel regions chosen over GPS points for field sites. Of the 18 field sites, 17 were used to develop linear models—one site (S07, mature village forest) showed evidence of moderate burned area on the ground that confounded its SMA results (supplementary table S1) and relationships between stem structure and land cover. Using these models, we mapped basal area and biomass maps for the 2750 km2 (275 000 ha) training region (figure 3(a)).
2.5. Assessment of forest basal area and biomass maps based on satellite NPV and green vegetation metrics
We evaluated the performance basal area and biomass maps based on non-green (Landsat SMA-NPV) and green land cover (Landsat SMA-GV, Landsat-NDVI) metrics in three ways. First, we back-compared satellite-based estimates of tree structure to field site data. Second, we compared map estimates of average basal area and biomass for forest and non-forest land cover across the training area, delineated by a Landsat SMA-based thresholding method developed for mapping miombo woodland land cover changes (Mayes et al 2015), and compared forest vs. non-forest structure estimates to other published miombo forest data. Third, we compared the performance of map biomass estimates across regions of dense, sparse and low tree cover conditions, shown in figures 3(b)−(d), using 38–41 image validation points from two subset regions: a nationally managed forest reserve (Igombe Reserve) and a village-managed regions (Millennium Villages Project communities), shown in figure 3(a). We conducted analysis of variance (ANOVA) for tree biomass estimates with tree cover type (dense woodland, mbuga and cleared) and remote sensing index as independent variables, with the goal of assessing the degree to which NPV (SMA-NPV) and greenness-based models (SMA-GV, NDVI) could differentiate tree structure across known landscape-scale gradients.
3. Results
3.1. Field data patterns in stem structure, canopy and ground cover features across regrowth, mature and disturbed miombo forest sites
Forest stature, defined by various indices (basal area, biomass, stem density, height, volume), all increased with site age (p < 0.05, figure 4, table 2, all ANVOA F-values in table S1). Basal area differed significantly among all regrowth site age classes, ranging from 1.04 ± 0.37 m2 ha−1 (mean ± standard error) at 3–4 yr sites to 29.4 ± 6.03 m2 ha−1 at village-managed mature forest sites (figure 4(a), table 2). Biomass varied from 1.7 ± 0.7 Mg ha−1 at 3–4 yr sites to 99.7 ± 27.7 Mg ha−1 at village forest sites. (figure 4(b), table 2). Though differences were not statistically significant, in site-level data, village-managed forest field sites had strong trends of higher stem density, basal area and biomass compared to nationally managed forest sites (table 2, figure 4).
Table 2. Forest structure variability by regrowth site age class across a miombo woodland landscape in Tabora, Tanzania. Values listed are age class means with standard errors. Values by column not sharing letters differed significantly in analyses of variance (ANOVA) and Tukey's honest significant difference tests (p < 0.05).
| Forest site age year | N sites | Stem density Stems ha−1 | Basal area m2 ha−1 | Height m | Biomass C Mg ha−1 | Volume m3 ha−1 |
|---|---|---|---|---|---|---|
| 3–4 | 3 | 138 ± 50.6c | 1.05 ± 0.368c | 3.18 ± 0.74c | 0.85 ± 0.35d | 2.51 ± 1.04d |
| 10–24 | 3 | 756 ± 108ab | 7.41 ± 1.15b | 5.05 ± 0.06bc | 4.71 ± 0.43bc | 14.4 ± 1.30bc |
| 30–40 | 3 | 891 ± 154a | 21.9 ± 1.43a | 8.02 ± 0.41ab | 22.1 ± 3.09ab | 70.2 ± 9.84ab |
| Mature—Village >100 | 3 | 897 ± 104a | 29.4 ± 6.03a | 11.4 ± 0.97a | 49.9 ± 13.9a | 160 ± 44.9a |
| Mature—Reserve >100 | 3 | 531 ± 137abc | 18.6 ± 0.819abc | 9.19 ± 1.57a | 38.1 ± 4.49a | 122 ± 14.8a |
| Disturbed⁎ 6–19 yr | 3 | 307 ± 37bc | 2.26 ± 0.444bc | 4.06 ± 0.38bc | 1.48 ± 0.34cd | 4.29 ± 1.06cd |

Figure 4 Field-measured forest structure patterns across regrowth and mature miombo tropical dry forest sites in Tabora, Tanzania. (a) Basal area relationships to forest site age class. (b) Biomass relationships to forest site age class. Letters atop bars indicate significant class differences in ANOVA and Tukey's honest significant difference tests, wherein groups not sharing letters have significantly different mean basal area or biomass values (p < 0.05).
Download figure:
Standard image High-resolution imageTotal plant canopy area measured by photosensor (plant-area index, PAI, ratio m2 m−2) increased with site ages, from 0.308 ± 0.163 at 3–4 yr sites to 1.16 ± 0.382 at mature village sites (p < 0.05, ANOVA F-values in table S1) (figure 5(a)). Conversely, the proportion open-sky area of the canopy, tallied from spherical densitometer survey (units of proportional canopy area), decreased significantly with increasing site age from 0.699 ± 0.105 at 3–4 yr sites to 0.187 ± 0.050 at village-managed mature forest sites (figure 5(c)). Trends in canopy material fractions with site age were moderately positive for woody material, and were weak for green leaf material (figures 5(b) and (d)). Below these canopy structure changes, ground cover materials were dominated by leaf litter and senesced grass fractions across all sites (>0.6) (figure 4(d)).

Figure 5 Field-measured canopy and ground cover features across regrowth and mature miombo tropical dry forest sites in Tabora, Tanzania. (a) Canopy plant-area index (PAI). (b) Canopy-cover proportions of green leaf and woody material measured by spherical densiometer. (c) Proportions of open sky area comprising canopy survey measurements by spherical densiometer. (d) Summed proportions of leaf litter and senesced grass comprising ground cover measured by point-line transect. Letters atop bars indicate significant class differences in ANOVA and Tukey's honest significant difference tests (p < 0.05).
Download figure:
Standard image High-resolution imageIn continuous relationships between canopy cover and forest structure across all sites, PAI related positively to basal area (r2 = 0.815, p < 0.01) and biomass (r2 = 0.635, p < 0.01) (figure 6(a)). Canopy open sky fraction related inversely to basal area (r2 = 0.763, p < 0.01) and biomass (r2 = 0.552, p = 0.002) (figure 6(b)). No significant relationship existed between the proportion of green leaf area in the canopy to basal area (r2 = 0.105, p = 0.103) or biomass (r2 < 0.01, p = 0.330) (figure 6(c)).

Figure 6 Relationships among field-measured canopy cover and stem structure variables across miombo woodland forest sites in Tabora, Tanzania. Figure sub-panels consist of three rows. (a) Total canopy plant-area index (PAI) vs. basal area and biomass. (b) Proportion of open-sky area in canopy area surveys (spherical densiometer survey) vs. basal area and biomass. (c) Proportion of green leaf material in canopy area (spherical densiometer surveys) vs. basal area and biomass.
Download figure:
Standard image High-resolution image3.2. Satellite land cover characterizations and their relationships to field data
Landsat SMA successfully modeled land cover with low root-mean square error (< 0.01) and greater than 90% of pixels with reasonable endmember proportions (table 3). The SMA-NPV fraction comprised the highest mean proportion of land cover materials per pixel (0.40 ± 0.15) and showed the highest sensitivity to varying land cover mixtures (table 3). Mean per-pixel green vegetation fractions of land cover were lower (0.15 ± 0.07) and less variable.
Table 3. Average pixel-level compositions of land cover features modeled by linear spectral mixture analysis (SMA) of Landsat 8 satellite data in the Tabora, Tanzania training region, July 2015.
| Image date | Endmember | Mean ± σ | % < 0 | % > 100 |
|---|---|---|---|---|
| 14 July 2015 | Vegetation | 0.154 ± 0.071 | 0.969 | 0 |
| NPV | 0.396 ± 0.151 | 0.140 | 0.056 | |
| Substrate | 0.121 ± 0.091 | 7.41 | 0 | |
| Shade | 0.328 ± 0.083 | 0.011 | 0 | |
| RMS | 0.008 ± 0.002 |
Landsat SMA-NPV metrics had equal or stronger relationships than greenness metrics to field data on land cover and stem structure. Landsat SMA-NPV had a significant positive linear relationships with open-sky fraction of the canopy (r2 = 0.632, p < 0.001), consistent with increasing exposure of NPV ground cover (figure 7(a)). Positive linear relationships occurred but were not as strong between canopy PAI and Landsat SMA-derived GV (r2 = 0.514, p < 0.001) and NDVI (r2 = 0.484, p < 0.001) (figures 7(b) and (c)). Inverse correlations of Landsat SMA-NPV to basal area and biomass were stronger than direct correlations of stem structure greenness metrics (Landsat SMA-GV and NDVI) (figure 8). Log-linear regression models showed significant relationships among scene-normalized (Z-score) SMA-NPV and green satellite metrics (Landsat SMA-GV and NDVI), and tree basal area and biomass (table 4). The predictive models of forest structure based on satellite NPV metrics were stronger than models based on greenness metrics.

Figure 7 Relationships of satellite-derived land cover metrics to field-measured canopy cover in a miombo woodland, Tabora, Tanzania. (a) Landsat SMA-NPV vs. canopy proportion open sky (spherical densiometer survey). (b) Landsat SMA-GV vs. total canopy plant-area index (PAI) (LAI-2200 photosensor measurement). (c) Landsat NDVI vs. PAI.
Download figure:
Standard image High-resolution image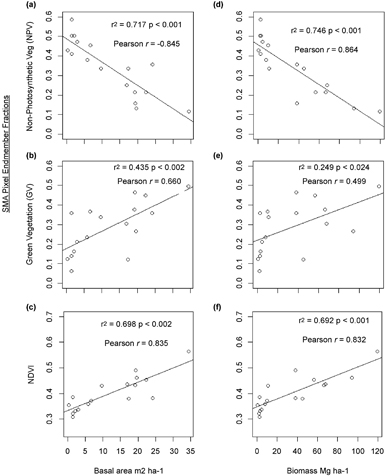
Figure 8 Relationships of satellite-derived land cover metrics to field-measured forest stem structure in a miombo woodland, Tabora, Tanzania. (a) Landsat SMA-NPV vs. basal area. (b) Landsat SMA-GL vs. basal area. (c) Landsat-NDVI vs. basal area. (d) Landsat SMA-NPV vs. biomass. (e) Landsat SMA-GL vs. biomass. (f) Landsat-NDVI vs. biomass.
Download figure:
Standard image High-resolution imageTable 4. Linear relationships modeling forest structure variables with Landsat 8-derived senesced vegetation and green vegetation land cover metrics in a miombo woodland landscape, Tabora, Tanzania.
| Forest structure variable | Relationship | r2 |
|---|---|---|
| Basal area (A, m2 ha−1) | log(A+1) = 1.908–2.364⁎NPVZ | 0.67 (p < 0.001) |
| log(A+1) = 1.465 + 2.167⁎VEGZ | 0.64 (p < 0.001) | |
| log(A+1) = 1.661 + 0.825⁎NDVIZ | 0.58 (p < 0.001) | |
| Biomass (B, kg ha−1) | log (B) = 9.049—3.859⁎NPVZ | 0.66 (p < 0.001) |
| log (B) = 8.364 + 3.413⁎VEGZ | 0.57 (p < 0.001) | |
| log (B) = 8.658 + 1.325⁎NDVIZ | 0.55 (p < 0.001) |
z Scene-normalized vegetation index (Z-score).
3.3. Basal area and biomass maps derived from NPV and greenness satellite metrics, and results from three performance assessments
In Landsat-derived maps, > 90% of pixels were modeled within published ranges for basal area (0–35 m2 ha−1) and miomass (0–200 Mg ha−1) in miombo forests (supplementary table S2). In the first map performance assessment, back-comparison of map biomass estimates to field site data, SMA-NPV maps estimated biomass with mean absolute value errors of 12 Mg ha−1 across all sites, 30% lower than mean absolute errors for SMA-GV (19 Mg ha−1) and NDVI maps (18 Mg ha−1) (table 5). All metrics tended to overestimate biomass at 3–4 and 10–24 yr regrowth site classes, with SMA-NPV metrics showing the closest estimates to field values (supplementary tables S3–S4). The magnitudes of overall average satellite map errors relative to field data were larger than the field biomass values for 3–4 and 10–24 yr sites, but smaller than regrowth and mature forest stand biomass.
Table 5. Back-comparisons between satellite and field-measured woodland biomass estimates across miombo woodland field sites in Tabora, Tanzania. Data presented are the absolute values of differences between field biomass, and satellite biomass estimates based on NPV and GV metrics, summarized by forest age and management classes (means ± standard errors). Full results of back-comparison analyses are shown in tables S2−S3.
| Site category | | Field–SMA-NPV biomass | Mg ha−1 | | Field–SMA-GV | Mg ha−1 | | Field–NDVI biomass | Mg ha−1 |
|---|---|---|---|
| 3–4 yr n = 3 | 4.9 ± 1.8 | 6.5 ± 3.7 | 5.3 ± 2.9 |
| 10–24 yr n = 3 | 7.5 ± 2.1 | 13 ± 11 | 9.2 ± 7.9 |
| 30–40 yr n = 3 | 29 ± 15 | 26 ± 13 | 30 ± 9.3 |
| Mature > 100 yr village managed n = 2 | 16 ± 11 | 28 ± 2.8 | 27 ± 7.6 |
| Mature > 100 yr Igombe Reserve n = 3 | 17 ± 4.6 | 44 ± 5.2 | 41 ± 2.8 |
| Disturbed 6–19 yr N = 3 | 0.7 ± 0.4 | 1.2 ± 0.2 | 0.9 ± 0.1 |
| Overall | 12 ± 3.5 | 19 ± 4.6 | 18 ± 4.2 |
In the second assessment of map performance, comparison of mean forest and non-forest area stem structure estimates at landscape scales, both SMA-NPV and greenness metric-based maps estimated mean forest cover basal area and biomass to be 300% larger than non-forest land cover areas (table 6, figure 9). For forest cover, SMA-NPV estimates of average basal area (16.0 ± 9.55 m2 ha−1) and biomass (46.1 ± 43.0 Mg ha−1) were higher than greenness metrics (basal area < 13 m2 ha−1; biomass < 36 Mg ha−1) (table 6). For non-forest, the SMA-NPV-based maps' estimates for basal area (4.23 ± 4.01 m2 ha−1 ) and biomass (7.14 ± 11.2 Mg ha−1) were in the middle of the range of field-measured basal area and biomasses for 3–4 and 10–24 yr regrowth sites (table 2).
Table 6. Satellite-based average basal area and biomass for forest and non-forest land cover areas in a miombo woodland landscape, Tabora, Tanzania, modeled from Landsat 8-derived senesced NPV and GV land cover metrics. The table accompanies maps in figure 9. Values shown are means ± standard errors. Forest and non-forest land cover types were delineated following a regional approach accounting for variable phenology (Mayes et al 2015). Z subscripts indicate Z-score (scene-normalization) of land cover metrics (see Methods).
| Model type | Land cover type | Basal area m2 ha−1 | Biomass Mg ha−1 | Biomass carbon Mg C ha−1 |
|---|---|---|---|---|
| NPVZ | Forest | 16.0 ± 9.55 | 46.1 ± 43.0 | 23.1 ± 21.5 |
| Map: figure 9(b) | Non-forest | 4.23 ± 4.01 | 7.14 ± 11.2 | 3.57 ± 5.58 |
| VEGZ Map: figure 9(c) | Forest Non-forest | 12.2 ± 9.28 2.09 ± 1.99 | 31.4 ± 36.8 2.94 ± 3.81 | 15.7 ± 18.4 1.47 ± 1.91 |
| NDVIZ | Forest | 13.0 ± 9.48 | 35.2 ± 41.3 | 17.6 ± 20.6 |
| Map figure 9(d) | Non-forest | 2.47 ± 1.28 | 3.14 ± 1.93 | 1.57 ± 0.96 |

Figure 9 Satellite-derived basal area and biomass maps, based on Landsat 8 NPV and green vegetation metrics, for a miombo woodland landscape in Tabora, Tanzania. (a) Forest/non-forest land cover map for 14 July 2015, created using SMA-based thresholding (Mayes et al 2015), showing forest in green, non-forest in magenta, and areas not mapped in black (water, urban, burned areas and scene edges). Regions of interest for forest monitoring are 1. Igombe Reserve and 2. Millennium Villages area (see Methods and figure 3). Yellow dots in land cover map show locations of field sites. (b)−(d) Basal area and biomass maps derived from Landsat image metrics extend across rows: (b) Landsat SMA-NPV; (c) Landsat SMA-GV; (d) Landsat NDVI.
Download figure:
Standard image High-resolution imageIn the third assessment, comparison of map biomass estimates across known gradients in tree structure at image validation points, biomass varied significantly by tree cover type and remote sensing index (table 7). The SMA-NPV maps significantly differentiated biomass among all woodland types in both national reserve and village-managed landscape areas (figure 10, supplementary table S5). The greenness indices differentiated biomass between dense woodlands and other types, but not between sparse mbuga and cleared areas (figure 10, table S5).
Table 7. Analysis of variance (ANOVA) assessing the effects of tree cover type and remote sensing index (abbreviated remote index) on satellite-derived biomass estimates in two regions of interest in a miombo woodland landscape, Tabora, Tanzania. Results accompany figure 10.
| Region of interest | Linear model fit tree type + remote index | Factor | F-ratio | P |
|---|---|---|---|---|
| 1. Igombe Forest Reserve National management | r2 = 0.938 p < 0.001 | Tree cover type | 2400 | <0.001 |
| Remote index | 10.2 | <0.001 | ||
| 2. Millennium Villages Village management | r2 = 0.794 p < 0.001 | Tree cover type | 685 | <0.001 |
| Remote index | 2.42 | 0.090 |

Figure 10 Comparison of satellite-based aboveground biomass estimates from image validation sites across a gradient of three tree cover types, based on Landsat NPV and green vegetation indicators, at Igombe National Reserve (Box 1 in figures 3 and 9) and a village-managed landscape (Box 2 in figures 3 and 9, Millennium Village area) in Tabora, Tanzania. Bars represent mean biomass estimates for groups of 38–41 image validation sites selected for each tree cover type from a 14 July 2015 Landsat 8 image (see Methods). Means comparison tests (Tukey honest significant difference) for biomass were performed for each management region separately; values not sharing letters by region of interest differed significantly in Tukey honest significant difference tests (p < 0.05).
Download figure:
Standard image High-resolution image
4. Discussion
4.1. Canopy cover to stem structure relationships across regrowth forests
Relationships among field-measured stem and land cover features yielded practical new insights for optical remote sensing of stem structure in an African dry tropical woodland landscape. Canopy cover-mediated exposure of NPV ground cover materials emerged as a land cover pattern that related strongly to tree structure in the early dry season. There was an inverse relationship of high NPV ground cover exposure to the sky at low basal area/biomass sites, and low NPV exposure at high basal area/biomass sites. Gradients in total canopy cover, illustrated by large ranges in PAI (< 0.4–1.2 m2 m−2) and densiometer open-sky fraction data (>80% to 20%), were larger and related much more consistently to stem structure than the patterns of any single canopy component such as green-leaf material (varying from less than 10% to about 40% in densiometer measurements) or woody material. There was no significant relationship between tree structure and the proportion of green leaf cover in the canopy at this time of year, after the onset of senescence. This result makes sense in the context of ecological processes affecting deciduous forest green leaf cover beyond stand age or disturbance. Green leaf cover alone is affected by many factors that could confound its relationship to basal area and biomass in the early dry season, including variable phenology across tree species (Frost 1996), and landscape-driven edaphic factors such as topographic position and soil moisture (Fisher et al 2006).
4.2. Relationships between field data on forest structure and Landsat satellite SMA-NPV and greenness metrics
We used land cover relationships to tree structure in the field to test the scalability of our hypotheses to Landsat satellite-derived metrics. Strong inverse correlations among satellite-derived SMA-NPV fractions to basal area (r = −0.85) and biomass (r = −0.86) at spatial scales of about 1 ha (3 × 3 30 m pixel groups averaged over field sites), were driven by the net land cover signal of decreasing ground NPV exposure with increasing canopy cover, which correlated directly with basal area and biomass. Inverse relations of satellite- NPV to basal area (r2 = 0.72) and biomass (r2 = 0.75) were stronger than direct relationships of Landsat SMA-GV fraction and NDVI to stem structure (r2 < 0.70). These results indicate a strong potential for the use of non-green land cover indices, together with greenness-based land cover metrics, to model tree basal area and biomass across African TDF landscapes. Other recent studies have shown the value of using not only multiple non-green and green land cover metrics, but also ancillary data on landscape variables to map aspects of tree structure across African forests (Hansen et al 2016, Halperin et al 2016). Strong total canopy cover relationships to basal area and biomass also suggest that emerging radar sensors, such as Sentinel-1, may hold promise for mapping miombo and other African TDF biomass in combination with optical satellite data.
4.3. Assessments of satellite maps for basal area and biomass based on senesced vegetation and greenness indices
All senesced and green vegetation metric-based maps accurately estimated landscape-scale ranges of tree basal area and biomass in comparison to published miombo woodland tree inventories (basal area 0–35 m2 ha−1; biomass 0–150 Mg biomass ha−1 or 0–70 Mg ha−1 biomass carbon (C) ha−1) (Frost 1996, Williams et al 2008, Kalaba et al 2013a). All metrics also captured large differences in tree structure between forest and non-forest land cover, >10 m2 ha−1 in basal area and > 30 Mg biomass ha−1. These results indicate that SMA-NPV, SMA-GV fraction images, or NDVI-based maps would all be capable to tracking miombo tree structure trends associated with large changes (e.g. deforestation) landscape scales. Similar approaches may be transferrable for coarse landscape-scale forest structure monitoring in other global TDFs, or using other optical remote sensing data sources such as the new Sentinel-2 sensors.
Together, the first map assessment of back-comparison to field site measurements and the third map assessment involving image validation points both suggested the SMA-NPV metric estimated above-ground tree biomass values more accurately and with greater sensitivity to variability across different tree cover types than the greenness metrics, particularly for low-biomass (< 30 Mg ha−1) regions. Using a guideline of only estimating biomass variability or change at twice or more than the magnitude of a metric's error or uncertainty, the SMA-NPV metric could in theory resolve biomass variability or change of about 25 Mg ha−1, given its overall remotely sensed-field biomass mean absolute value differences of 12 Mg ha−1 across all sites. With mean absolute value differences in map-field biomass estimates of > 18 Mg ha−1, the greenness measurements would have a resolving power of detecting biomass variability or change at rates closer to 40 Mg ha−1. The image validation point analyses further demonstrated the advantages SMA-NPV metrics showed over greenness metrics. From past miombo woodland research, sparse woody biomass at the periphery of mbuga regions in miombo landscapes has been measured at 15–30 Mg ha−1(Frost 1996, Woollen et al 2012). Those values are intermediate between the 10–24 yr (10 Mg ha−1) and 30–40 yr regrowth forest sites (40 Mg ha−1) we measured. In both national reserve and village-managed landscapes, the SMA-NPV metric estimated similar mean biomass around mbuga peripheries at 24 Mg ha−1, significantly different from mature forests (>80 Mg biomass ha−1) and cleared areas (<5 Mg ha−1). In contrast, the greenness metrics underestimated mbuga periphery woody biomass of about 5–10 Mg ha−1, which does not differentiate mbuga from cleared area biomass. These comparisons indicate that the SMA-NPV senesced vegetation metric showed better accuracy and precision for modeling tree biomass relative to the green vegetation metrics, particularly in intermediate to low-biomass areas.
Given these performance assessments, the Landsat-scale tree structure maps we present may be useful for a number of forest and tree structure monitoring applications. These include monitoring biomass changes not only from clearing, but also from degradation of mature to 30–40 yr regrowth forests (biomass > 40 Mg ha−1) by harvests for timber or wood-fuel production, which can occur at scales of > 25 Mg ha−1 biomass removals (Luoga et al 2002). Another application is studying how governance regimes, land tenure structures or management plans relate to tree structure. For example, the scales of difference in tree structure variability we measured on the ground between village and nationally-managed forest areas (biomass > 20 Mg ha−1; basal area >10 m2 ha−1) were detectable with the Landsat SMA-NPV indicators. The SMA-NPV indices also show promise over greenness metrics for monitoring biomass changes of smaller magnitudes in lower to moderate tree biomass areas (20–30 Mg ha−1) associated with agroforestry or forest restoration projects. Given the uncertainties, however, none of the remote sensing approaches could be considered accurate for estimating stem structure variability or change below or between ranges of the 3–4 and 10–24 yr regrowth field sites (<10 Mg ha−1 or basal area < 10 m2 ha−1).
This study highlights three key opportunities for further work in quantitative optical remote sensing to monitor tree cover in TDF landscapes. First, there is need for more field data on tree structure and land cover in African dry tropical landscapes to enable more rigorous calibration and accuracy assessment of remote sensing products. Second, there is a need to refine remote sensing methods to monitor smaller biomass changes and tree structure variability in low-biomass regions. Other SMA approaches that characterize land cover at sub-Landsat pixel scales, such as multiple-endmember spectral mixture analyses or use of automated SMA methods such as the Carnegie Landsat Analysis System are promising approaches (Roberts et al 1998, Asner et al 2009). Data-fusion approaches merging optical with active remote sensing data (e.g. radar, LiDAR) have proved effective for mapping tree structure in African TDFs and across the global tropics for larger areas (Ribeiro et al 2008, Baccini et al 2012, Saatchi et al 2011), and may also be useful. The availability of Sentinel-1 radar data at 10 m globally since 2014 presents strong opportunities for integrative analyses with optical image archives. High resolution (< 1 m) remote sensing observations of tree structure, such as those from small drones, may also prove useful for improved scaling between field and satellite data (Tang and Shao 2015, Paneque-Galvez et al 2014). Three, further integration of repeat local community monitoring and scientific research on land cover-forest structure relationships is an opportunity to improve forest monitoring capabilities and inform assessment of local management effects on forest and tree cover condition.
5. Conclusions
We found that senesced vegetation land cover features in the early dry season related significantly to tree structure measured in the field and by satellite in the western Tanzanian miombo woodlands. Our field data showed that canopy cover-mediated exposure of non-photosynthetic vegetation (NPV) on the ground (senesced litter and grass cover) had strong inverse correlations to tree basal area and biomass across a gradient of young to mature and disturbed forest sites. In contrast, we found no significant relationship between the proportions of green leaf material in tree canopies to tree structure. Landsat satellite metrics for senesced vegetation materials (SMA-NPV fractions), sensitive to exposure of senesced vegetation ground cover materials, had inverse relationships to canopy cover and tree structure that were comparable to or stronger than direct correlations of greenness measures (SMA-vegetation, NDVI) to tree structure. Basal area and biomass maps based on Landsat metrics for senesced (SMA-NPV) and green vegetation (SMA-vegetation fraction, NDVI) performed similarly for high-biomass forested areas, but senesced vegetation-based maps produced more reasonable ranges of basal area and biomass estimates in low-biomass and non-forest areas. While more field data are needed to validate the landscape-scale tree structure estimates of these pilot maps, our results demonstrate that senesced vegetation metrics at Landsat scales have promise to improve quantification of tree structure conditions and change in African TDF ecosystems.
Acknowledgments
We thank staff of Tanzania Western Zone Agricultural Research Institute at Tumbi, Tabora (Fabian Bagayrama, Peter Matata, Kassim Massibuka, Ismail Raishidi, Temba Gilbert), members of the Millennium Villages Project—Tabora Office (Kagya Eliezer) and New York staff (Claire Ward), Tabora Development Foundation Trust (Dick Mlimuka, Moses Maganga, Sadiki Omari) for their assistance with project logistics, locating field sites, translation, field and laboratory work. We thank the Tanzania Forest Service, Tanzania Forest Research Institute (TAFORI) and Tanzania Army Anti-Poaching Unit for help securing site access, and locals of villages in Uyui District, Tabora, Tanzania for their time discussing land use history and permission sampling forests on village land. We also thank faculty and staff at Marine Biological Lab Ecosystems Center for assistance with sample processing and loaning of field instruments (PIE-LTER). The project was funded by the US National Science Foundation Partnerships for International Research and Education (PIRE) program, project title 'Ecosystems and Human Well-Being' (Award # 0968211) PI Chris Neill. Additional research and dissertation support was provided to Marc Mayes from Brown University. The project was completed with permission and cooperation from the Tanzania Commission on Science and Technology (COSTECH Permit Nos. 2013-261-NA-2014-199 and 2015-183-ER-2014-199). M Mayes was also supported by a Dissertation Fellowship at Brown University during completion of the research. Publication fees were supported by a Nature Conservancy NatureNet Science Fellowship, based at Princeton University, to Marc Mayes.