
Abstract
Increased use of natural gas has been promoted as a means of decarbonizing the US power sector, because of superior generator efficiency and lower CO2 emissions per unit of electricity than coal. We model the effect of different gas supplies on the US power sector and greenhouse gas (GHG) emissions. Across a range of climate policies, we find that abundant natural gas decreases use of both coal and renewable energy technologies in the future. Without a climate policy, overall electricity use also increases as the gas supply increases. With reduced deployment of lower-carbon renewable energies and increased electricity consumption, the effect of higher gas supplies on GHG emissions is small: cumulative emissions 2013–55 in our high gas supply scenario are 2% less than in our low gas supply scenario, when there are no new climate policies and a methane leakage rate of 1.5% is assumed. Assuming leakage rates of 0 or 3% does not substantially alter this finding. In our results, only climate policies bring about a significant reduction in future CO2 emissions within the US electricity sector. Our results suggest that without strong limits on GHG emissions or policies that explicitly encourage renewable electricity, abundant natural gas may actually slow the process of decarbonization, primarily by delaying deployment of renewable energy technologies.
Export citation and abstract BibTeX RIS

Content from this work may be used under the terms of the Creative Commons Attribution 3.0 licence. Any further distribution of this work must maintain attribution to the author(s) and the title of the work, journal citation and DOI.
Fossil fuels supply approximately 87% of the primary energy used worldwide [1], and the carbon dioxide (CO2) emissions from burning these fuels are the main cause of climate change [2]. Avoiding the negative impacts of climate change while meeting growing world energy demand depends upon transforming our energy system to one that relies on technologies that do not emit CO2 to the atmosphere [3, 4].
Scenarios of energy use and CO2 emissions have for decades anticipated a gradual reduction in carbon emitted per unit of energy consumed, or 'decarbonization', beginning with the replacement of coal and oil with fossil natural gas [5–7]. This is because natural gas-fired power plants emit ∼57% less CO2 per kilowatt-hour (kWh) than coal-fired plants, and are on average 20% more efficient at converting fuel energy to electricity than coal plants [8]. In the US, 41% of electricity is currently generated by coal-fired power plants [9], and natural gas has been promoted as a means of reducing CO2 emissions [10–13]. The potential for natural gas to reduce US emissions has become increasingly salient as innovations in hydraulic fracturing technology have dramatically increased domestic supplies of gas [14, 15], and as proposed federal regulations on CO2 emissions from stationary sources are projected to increase the substitution of natural gas for coal [16].
Several highly publicized studies have questioned the climate benefits of the recent boom in natural gas on the basis that reductions in CO2 emissions may be partially or completely offset by fugitive emissions (i.e. leakage) of the greenhouse gas (GHG) methane during its extraction and transport to final consumers [17–20]. A smaller but growing number of studies have begun to focus on the effect of natural gas on future energy use, and found that abundant natural gas may help lower the compliance costs of a carbon cap [12] but, absent a climate policy, may do little to affect future GHG emissions [21, 22]. Most of these studies have used gas supply as estimated by the US Energy Information Agency (EIA), and examined one to two climate policies: no climate policy, cap and trade, or a carbon tax.
Here, we build on these studies in three ways: first, given the uncertainty around future gas supplies and production costs, we use expert elicitation methods to gather a range of natural gas supply curves (i.e. the total natural gas available as a function of the wellhead price of gas) to examine the future composition of the power sector and GHG emissions. Second, we test the sensitivity of the US energy system to the elicited gas supplies through a simplified, one-region energy-economic model, MARket ALlocation (MARKAL). Lastly, we assess these effects across three different types and levels of climate policy: no policy, a moderate carbon tax, and a strict carbon cap. We also examined the effect of a strong federal renewable portfolio standard (RPS). Results from the three climate policies suggest abundant natural gas may aid in decreasing coal use, but at the same time will delay the use and price-competitiveness of lower-carbon renewable energy sources. Only the federal RPS brought about similar levels of renewable electricity use across gas supplies, as the mandate for renewable use lessened competition between natural gas and renewable energy sources. The effect is that abundant natural gas does little to reduce GHGs in our model outputs, even assuming very low rates of methane leakage.
Methods
Briefly, our analysis consisted of two parts: (1) using expert elicitation methods [23, 24], we gathered a range of plausible natural gas supply curves, and (2) assessed the effects of the different supply curves on the future technological composition of the power sector and GHG emissions, using the energy model MARKAL. (Details of our elicitation methods and results, as well as of our parameterization of MARKAL, are described in the Supplementary Information.)
With the growth of hydraulic fracturing technology there has been variation in assessments of US technically recoverable gas resources and, particularly, the costs and profitability of future extraction, yielding a wide range of supply curve estimates [11, 25, 26]. Expert elicitation has proven useful in assessing such uncertain parameters [e.g., 23, 24]. We elicited judgments of natural gas experts from a variety of domains (including industry, academia, and finance) to characterize the range of uncertainty [27, 28]. Table 1 lists the 23 experts who participated and their affiliations.
Table 1. List of the 23 experts whose judgments we report and model in this study. The numbers that identify experts in figures were randomly assigned and do not correspond to the order they are listed in this table.
| Name | Affiliation |
|---|---|
| Blasingame, Thomas A. | Texas A&M University, College Station, TX |
| Borns, David | Sandia National Laboratories, Livermore, CA |
| Braitsch, Jay | US Department of Energy, Washington, DC |
| Brooks, Allen | G Allen Brooks, LLC, Houston, TX |
| Choi, Tom | Deloitte MarketPoint LLC, Washington DC |
| DeLaquil, Pat | DecisionWare Group, Annapolis, MD |
| Dumitrasc, Alina | Galway Group, Houston, TX |
| Hansen, James | KMS Financial, Seattle, WA |
| Hoffman, Ken | MITRE Corporation, Bedford, MA |
| Ingraffea, Anthony | Cornell University, Ithaca, NY |
| Jensen, James | Jensen Associates, Ellinwood, KS |
| Kokkelenberg, Edward | Cornell University, Ithaca, NY |
| Medlock, Kenneth B. | Rice University, Houston, TX |
| Nichols, Chris | US Department of Energy, Washington, DC |
| Pickering, Gordon | Navigant Consulting, San Francisco, CA |
| Powers, Bill | Powers Energy Investor, Chicago, IL |
| Ratner, Michael | Congressional Research Service, Washington dc |
| Reilly, John | Massachusetts Institute of Technology, Cambridge, MA |
| Ross, Martin | Duke University, Durham, NC |
| Stibolt, Robert | Galway Energy Strategy, Houston, TX |
| Tierney, Susan | Analysis Group, San Francisco, CA |
| Weyant, John | Stanford University, Palo Alto, CA |
| Zittel, Werner | Energy Watch Group, Berlin, Germany |
The elicited supply curves were used as sensitivity cases in MARKAL [29], a linear programming, energy systems optimization model. Its objective function is the minimization of the discounted total system cost formed by the summation of capital, fuel, and operating costs for energy resources, infrastructure, conversion, and end use technologies. It has been used to assess issues such as least-cost energy systems and cost-effective policies for emissions reductions. We used the national single region US MARKAL, a standard MARKAL model where energy service demands are inelastic.
Inputs in the model come from the US Environmental Protection Agency (EPA) MARKAL database (EPANMD), including current and future energy demands, resource supplies (including exports), costs, and technologies, developed primarily from the EIA's 2013 Annual Energy Outlook report, extrapolated to 2055 using National Energy Modeling System outputs [9]. The national single region model includes existing and pending federal EPA environmental regulations, but does not include state-level policies such as RPS. EPANMD has been peer-reviewed and is publicly available upon request.
Our only model modification, beyond gas supply, was inclusion of a 20% learning rate for solar power (i.e. a 20% reduction in price for each doubling of cumulative production), in line with solar price trends over the past few decades [30, 31]. Although our analysis focuses on model results that include this learning rate, we also assess the sensitivity to learning by modeling all gas supply and policy scenarios with no learning. We adjusted the model to more closely replicate trends in declining solar technology costs, as multiple studies suggest renewable energy deployment is most strongly influenced by technology costs, as well as the stringency of the climate policy [32, 33].
We assessed the effects of varying gas supplies under three different levels of climate policies: (1) no new policies, (2) a tax of $25/ton CO2 in 2013 that increases by 5% per annum in real dollars (moderate policy), and (3) a cap that reflects the Obama administration's stated goal [34] of reducing CO2 emissions by 17% in 2020, 42% in 2030, and 83% in 2050 relative to 2005 levels (stringent policy). The cap's goal for 2030 is stronger than the EPA's 2014 proposed rule that would lower carbon emissions from existing power stations up to 30% by 2030, relative to 2005 levels [35]. We also assessed the effects of gas supply under a federal RPS that required increasing levels of renewable electricity use [33].
The MARKAL model selects from available energy technologies to meet projected US energy demand at the lowest cost through 2055 [29]. Outputs should not be treated as a forecast but instead as comparisons of how changes in natural gas supply and carbon policy may affect future US energy use and investment. The model is not transparent about infrastructure decisions, and the single region model excludes interregional constraints such as pipelines, which might affect use of natural gas by the power sector. However, the different gas supplies modeled here ultimately affect energy use in MARKAL by changing the price of natural gas, offering an indication of how the power sector may respond in aggregate to different economic conditions such as infrastructure costs and constraints.
Results
Figure 1 shows the experts' estimated curves of maximum, minimum, and expected natural gas supply. The supply curves span more than an order of magnitude, with between 1 × 10¹³ m3 and 11 × 1013 m3 (355–3900 trillion ft3) of gas available at a wellhead price of $4.74 per gigajoule (GJ) ($5 per million Btu), and between 2.7 × 10¹³ m3 and 30 × 1013 m3 (960–10 400 trillion ft3) expected at a wellhead price of $47.35 per GJ ($50 per million Btu). The experts' supply curves are within the range of previous estimates, but tend toward high supply at a given price [11, 25, 26]. We used the mean of the experts' expected, maximum, and minimum supply curves to define reference, high, and low gas supply scenarios, respectively (figure 1). The percentage differences between these scenarios (e.g., high supply is 32% greater than reference supply at $35 per million Btu in figure 1) were then used to adjust the default gas prices in MARKAL (see appendix B of [22]).

Figure 1. The gray lines show 23 experts' judgments of maximum, minimum, and expected US natural gas available at different wellhead prices. The red, yellow and green lines show the mean of the experts' maximum, expected and minimum supply curves, respectively. The percentage difference between these mean curves were used to adjust the default supply of gas in the energy-economic model MARKAL. Note that the expected supply curve shifts slightly down in price between $25 and $30, because some experts thought no additional gas would be supplied beyond $25 per million Btu.
Download figure:
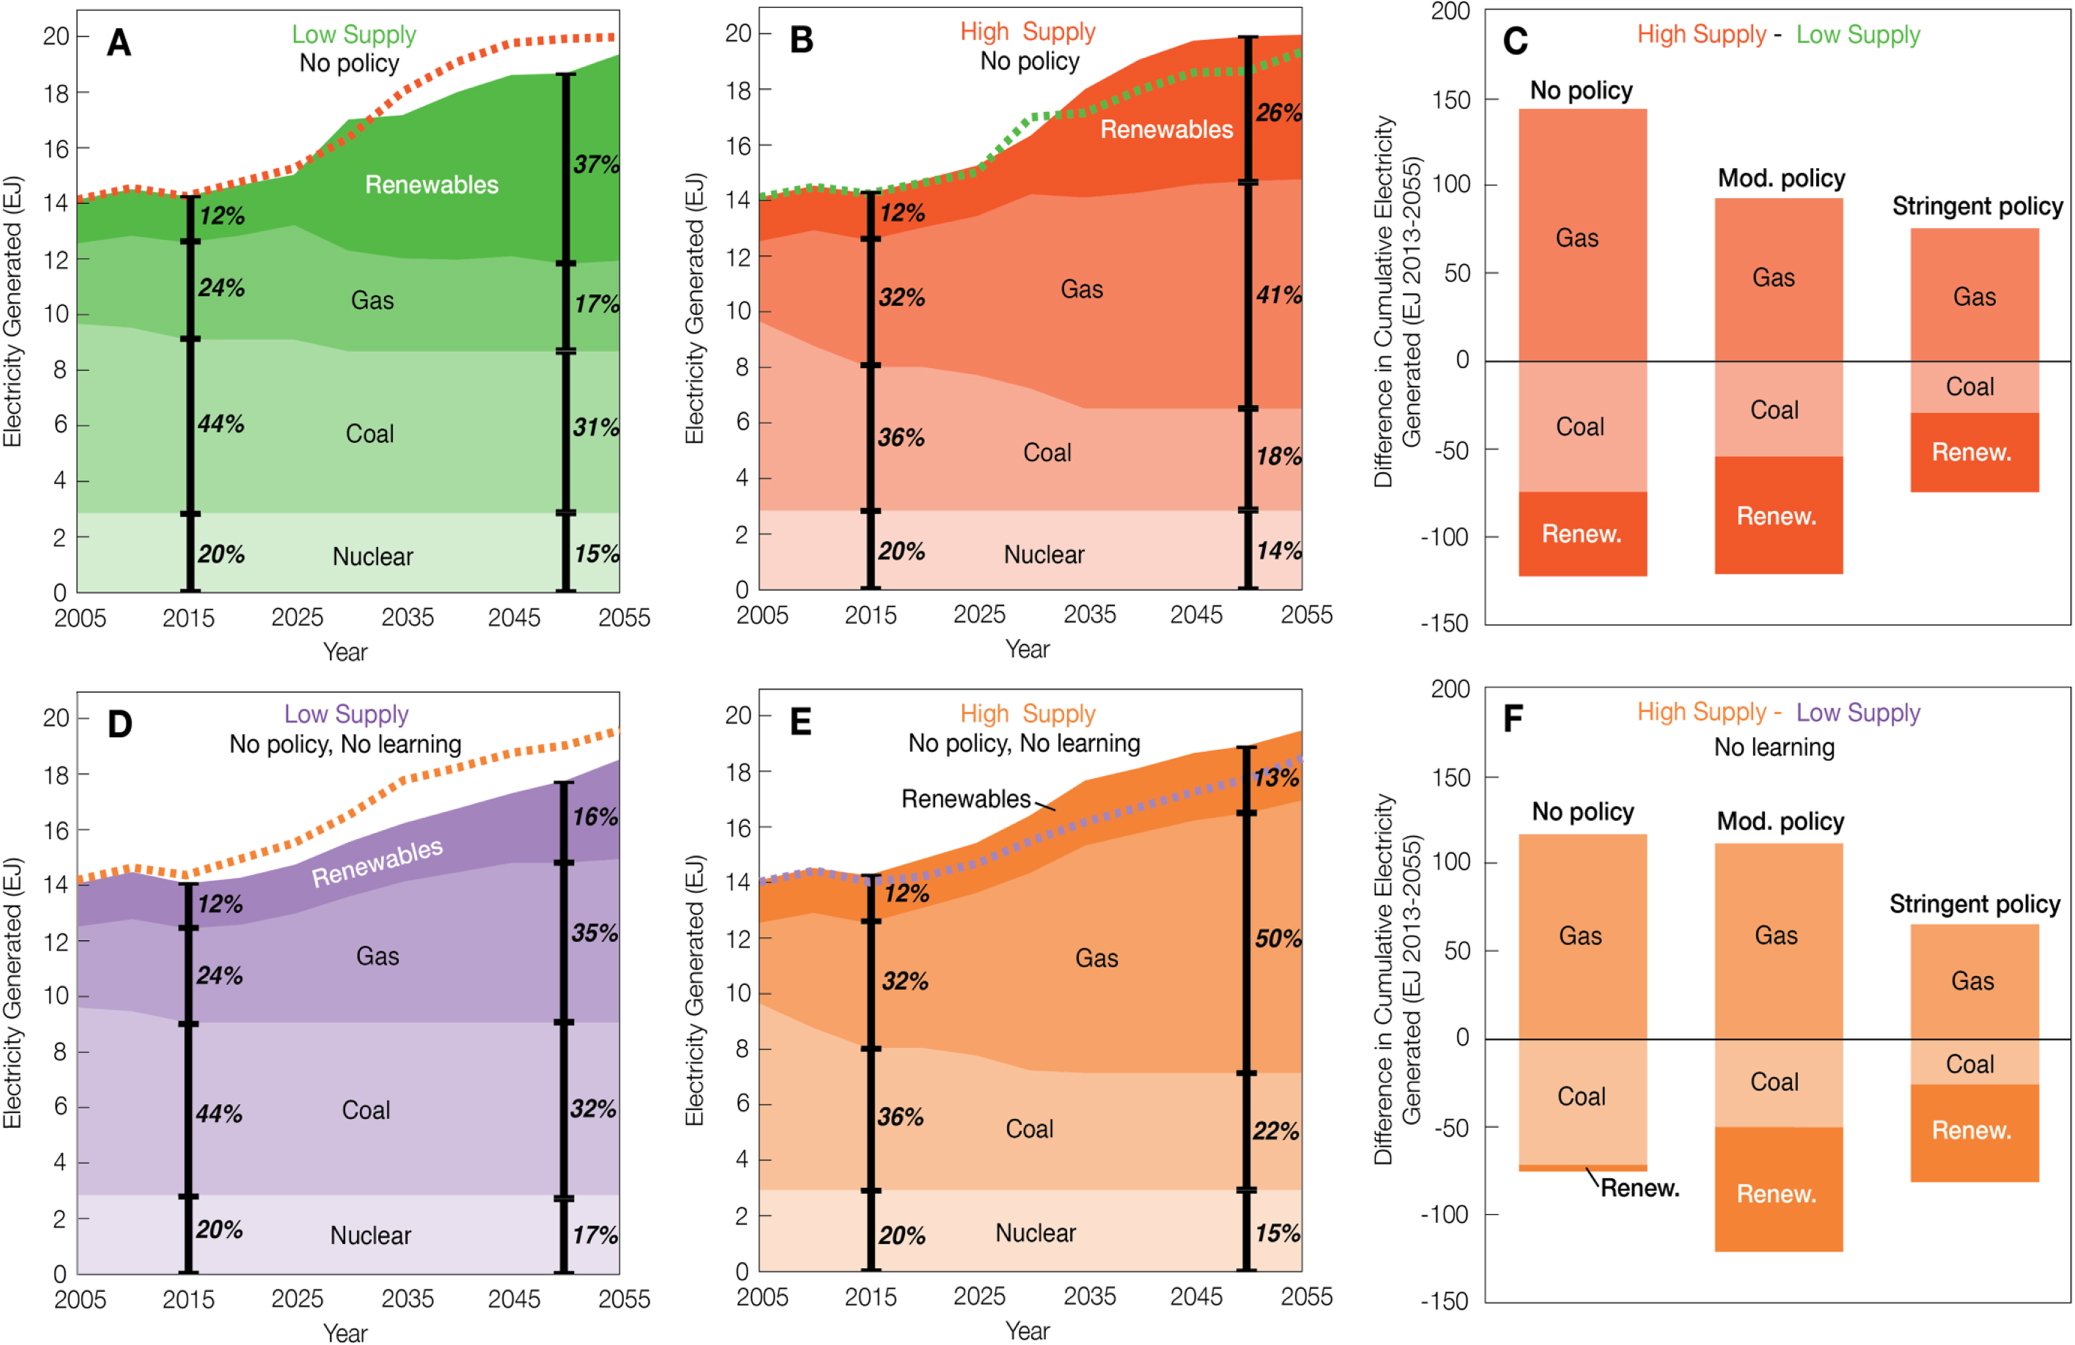
Standard image High-resolution imageFigures 2(A) and (B) show the modeled effect of natural gas supply on US electricity generation through 2055 with no new climate policies. Under the low gas supply scenario, the proportion of electricity from coal power plants decreases modestly from 44% in 2015 to 31% in 2050 (figure 2(A)). In contrast, under high gas supply, the proportion of electricity from coal declines from 36% in 2015 to just 18% in 2050 (figure 2(B)). Although less coal is used, the model results show that increased gas supply also significantly reduces the penetration of lower-carbon renewable energy technologies (hydropower, on- and off-shore wind power, and photovoltaic and concentrated solar power). In the high gas supply scenario, renewables provide 26% of all electricity in 2050 (figure 2(B)), but in the low gas supply scenario, renewables generate 37% of electricity in 2050 (figure 2(A)). Greater supplies of natural gas also increase demand for electricity in the model; total electricity generation in 2050 is about 7% greater in the high gas supply than the low gas supply scenario (dashed lines in figures 2(A) and (B)). This difference reflects a shift from other energy carriers because overall energy demand in the MARKAL model is perfectly inelastic.

Figure 2. Higher natural gas supplies lead to increased use of gas for electricity generation at the expense of both coal and renewables. Under the low gas supply scenario and assuming no new climate policies, renewables provide 37% of all electricity in 2050 (A), while under the high gas supply scenario (B), renewables provide 26%. The dashed lines show total electricity consumption for low and high gas supply; electricity generation is somewhat higher when gas is more abundant. Across a range of climate policies, high gas leads to large increases in electricity from gas, and significant decreases in both coal and renewables (C). Compared to a scenario without the 20% learning rate for solar, there is little growth in renewable electricity under no climate policy for both low (D) and high gas supply (E), and less renewable electricity and coal for high gas supply across the climate policies (F).
Download figure:
Standard image High-resolution imageAcross all climate policies, high natural gas supply results in reductions in both coal and renewable energy use compared to low supply—and the amount of gas used for electricity exceeds the coal and renewable energy it replaces without new climate policies (figure 2(C)). Other US modeling studies have found higher natural gas supply decreased future renewable energy use and increased electricity use, whether there was no climate policy [21], cap and trade [12], or a renewable energy standard [36]. (See table S1 for a more detailed comparison.)
For comparison, figures 2(D)–(F) show the same results as figures 2(A)–(C) but assuming no reduction in the price of solar energy with deployed capacity (i.e. no learning). With no assumed learning and no climate policy, there is little growth in renewable electricity: coal use declines modestly, and gas use expands to half the overall generation mix by 2050 (figures 2(D) and (E)). However, under moderate and stringent climate policies, high natural gas supply still results in large reductions of renewable electricity use compared to low supply when no learning is assumed (figure 2(F)). Our model results suggest that future decreases in solar energy prices will affect the level of renewable energy deployed, but will not prevent the competition between gas and renewables when a climate policy is in place.
In our results, natural gas supply does not have a noticeable impact on the use and deployment of nuclear energy or carbon capture and storage (CCS) technologies. The use of nuclear energy in our simulations is constant regardless of gas supply or policy, providing about ∼3 exajoules (EJ) of electricity annually through 2055 across all gas supply and policy scenarios (figures 2(A)–(D)). The model deploys CCS only in conjunction with new climate policies. In the stringent policy case, CCS is deployed on gas- and coal-fired power plants by 2045 under the high and reference gas supply scenarios. In contrast, CCS is deployed only on coal plants in the low gas supply scenario.
Figure 3 shows the modeled effect of more abundant natural gas on the mix of US power sources over time. Averaging across the different climate policies we modeled, natural gas generates the same amount of electricity as coal in just 8 years (2022) under high gas supply, but it takes 15 years (2029) to reach this parity under low gas supply (figure 3(A)). Conversely, renewables generate the same amount of electricity as natural gas in an average 15 years (2029) in the low gas supply, but it takes more than twice as long—36 years (2050)—in the high gas supply scenario (figure 3(B)). This suggests greater supplies of natural gas may accelerate the phase-out of coal-fired electricity, but could also result in even longer delays in the deployment of renewable energy technologies.

Figure 3. Averaging across the three climate policies, natural gas is used to generate the same amount of electricity as coal eight years from now (in 2022) under high supply, 11 years from now (in 2025) under the reference supply and 15 years from now (in 2029) under low supply (A). Yet high gas supply also delays deployment of renewable energy technologies: renewables do not generate the same amount of electricity as gas until 36 years from now (in 2050) under high supply versus 22 years from now under reference supply and 15 years from now under low supply (B). Shaded areas indicate the range across the climate policies.
Download figure:
Standard image High-resolution imageAs an alternative climate policy scenario, we assessed the effect of a federal RPS on electricity use. Unlike the other climate policies modeled, the RPS requires a certain level of renewable electricity use, rather than encouraging its use through a price or cap on carbon emissions. We assumed an RPS that mandates 20% of US electricity come from renewable sources by 2020, 30% by 2030, 40% by 2040, and 50% by 2050—a higher and longer standard than most existing, state-level standards [37]. Under this RPS, only slightly less renewable electricity was used when gas was abundant, and renewable use was not delayed like the other climate policies, suggesting the RPS decreased competition between natural gas and renewables in the power sector. Instead, abundant gas led to greater fuel switching from coal to natural gas in remaining non-renewable electricity use: under high gas supply, coal provided 16% of total electricity use in 2050, compared to 21% for low gas supply.
Figure 4 shows the modeled effect of natural gas supply on GHG emissions from the US electricity sector through 2055, including the CO2 emissions produced during combustion and leakage of methane over the full life cycle of the gas. The lines in figure 4(A) and bars in figure 4(B) assume a system-wide leakage rate of 1.5% of produced natural gas and a global warming potential of 28 for methane, consistent with the latest estimates of the EPA and IPCC for leakage and warming potential, respectively [38, 39]. Shading in figure 4(A) and whiskers in figure 4(B) indicate the effect of assuming 0% to 3% leakage, thus reflecting the broader range of leakage estimates that can be found in the literature [40–43], including the best-case in terms of the climate benefits of gas (i.e. 0% leakage).

Figure 4. Panel A shows that the supply of natural gas has a small effect on annual GHG emissions from the power sector 2005–55 relative to climate policy (the solid lines reflect an assumed methane leakage rate of 1.5%, and the shaded area indicate the range if 0–3% leakage is assumed). Abundant gas is most effective at reducing emissions when renewable electricity is mandated (RPS) and forces gas to compete more directly with coal, although the RPS is a stronger driver of the emission reductions than gas supply. Differing supply of natural gas has little effect on cumulative GHG emissions 2013–55 across the climate policy cases and leakage rates (B; bar heights assume leakage rate of 1.5% and whiskers indicate that range if 0–3% leakage is assumed).
Download figure:
Standard image High-resolution image
The relatively tight pairing of lines in figure 4(A) reflect the fact that climate policy is ultimately a much more important determinant of GHG emissions than natural gas supply in our simulations—a finding similar to a recent Energy Modeling Forum analysis on the effect of high and low shale gas supply on US CO2 emissions compared to a carbon tax [22]. In our results, annual emissions in 2055 are the same or greater in the high gas supply scenario, assuming a leakage rate of 1.5%, for all policy cases except the RPS. Under the RPS, abundant gas helps decrease annual emissions more quickly than low gas, as the competition between gas and renewables is constrained. Even still, the RPS policy has a much greater effect on emissions than does gas supply (figure 4(A)).
Some studies have noted that abundant natural gas may help lower the costs of compliance with a climate policy [11, 12]. Examining the shadow cost of CO2-equivalent for the stringent climate policy, the availability of high-supply, low-cost gas lowers the compliance costs associated with the carbon cap in intermediate years ($30/tonne versus $10/tonne in 2030 and $73/tonne versus $47/tonne in 2040), although the prices grow more equal by the end of the time horizon as the cap becomes more stringent ($223/tonne for high gas and $162/tonne for low gas by 2050). In the moderate climate policy (a carbon tax), high gas supply initially speeds up decarbonization of the power sector due to the availability of lower cost gas, but evens out toward the end of the model period as low gas supply brings about more renewable energy than high gas, leading to similar carbon intensities.
Cumulatively, abundant gas makes little difference to US emissions 2013–55 (figure 4(B)). Abundant gas helps reduce emissions modestly when renewable electricity is mandated (RPS), resulting in 9.1 Gt less emissions than low gas at 1.5% leakage—a reduction of about 13%, the highest of any policy scenario. For the other three climate policies (none, moderate, and stringent) and assuming a leakage rate of 1.5%, the high gas supply scenario resulted in at best 3.2 Gt CO2-eq less emissions, or at worst 1.1 Gt CO2-eq more emissions, than the low gas supply scenario—a change in cumulative emissions between −6% and +2%. Varying assumed leakage rates to either 0 or 3% does not substantially change this result: Cumulative emissions in the high gas scenario are reduced by a maximum of 9% (4.6 Gt CO2-eq) relative to the low gas supply scenario under our moderate climate policy when leakage is neglected (figure 4(B)). In contrast, cumulative emissions increase by 5% (2.6 Gt CO2-eq) in the high gas scenario under our stringent climate policy when a leakage rate of 3% is assumed (figure 4(B); cf figure S1 shows the mean of experts' leakage estimate is 2.9%). Similarly, Newell and Raimi found the EIA's 2013 estimate for high gas supply compared to reference gas supply [44] had little effect on cumulative US GHG emissions for 2010–40, with a difference of −1.5% to 0.3% depending upon the methane leakage rate and global warming potential (across all industry sectors, excluding transport) [21].
Discussion
We have examined the effect of our elicited gas supplies on future US electricity use through the energy model MARKAL. We find the generation mix is highly influenced by variations in gas supply, as abundant gas consistently results in both less coal and renewable energy use. This effect of abundant gas on renewable energy is dampened by a price or cap on carbon but still holds, as there is less renewable energy across all climate policies; only the RPS resulted in similar amounts of renewable electricity use for both low and high gas supply, as the policy's mandated renewable electricity use decreased market competition between natural gas and renewables. We also see that over time renewable electricity becomes more cost-competitive with coal, but less so under abundant gas. As MARKAL is a cost-optimization model, this suggests increased natural gas supply has a large effect on energy prices that delays up to decades the time period over which renewable energies become economically competitive. Under no climate policy, abundant natural gas aids in decarbonization of the energy sector, but also increases energy use. The combined effect of abundant natural gas on both renewable energy and overall energy use in our outputs essentially canceled out the climate benefits of substituting natural gas for coal, regardless the leakage rate.
Although the finding that natural gas alone will not significantly reduce CO2 emissions is consistent with previous reports, [11, 22, 45], we believe the important implications for climate-energy policy are nonetheless not widely appreciated (e.g., 46). Many policymakers and climate-energy analysts accept natural gas as a lower-carbon energy resource that can "bridge" us from coal to lower-carbon resources such as solar and wind [10, 12]. Concerns about the US shale gas boom have therefore often focused instead on environmental and health impacts (e.g., groundwater contamination) [47–49] and methane leakage rates [17–20]. Yet our study and others suggest that increased use of gas may not lead to substantial reductions in GHG emissions where gas competes with renewables in the energy market. On the other hand, the effect of more abundant gas supply on GHG emissions is so small that the quantity of methane leaked may ultimately determine whether the overall effect is to slightly reduce or actually increase cumulative emissions.
Some analysts have noted that natural gas may complement and support variable renewable energy technologies such as wind and solar by providing flexible back-up power that can ramp up quickly [50, 51]. The model we use, MARKAL, is not well-suited to evaluating the potential for this relationship because it does not represent the details of dispatch, unit commitment, and other short-term facets of grid operation. Nonetheless, our results suggest that the degree by which the gas and renewables are complementary will be affected by the amount of natural gas available. The costs of wind and solar can be expected to decrease with increased deployment (e.g., 30), but more abundant natural gas may delay deployment and thereby increase the time period over which renewable energies decrease in cost. Along these lines, another MARKAL study examining electricity use under a clean energy standard with high gas supply brought about considerably less solar energy than our outputs [52]; this difference may be due to our introduction of a 20% learning rate for solar, which substantially increased the amount of solar energy in our outputs (figures 2(D)–(F)). Future studies could more specifically examine the effect of natural gas supply on the learning rate of solar energy, in addition to their potentially synergistic applications.
Although we do not vary the amount of US exports of natural gas or coal in the model, there are domestic and global implications of such trade. A recent study by Sarica and Tyner found that increasing US natural gas exports contracted domestic gas supply, encouraging both increased coal and renewable energy use [53], similar to our results for low gas supply. On the other hand, increased export of US coal has the potential to increase GHG emissions in other parts of the world. For example, a study by Broderick and Anderson argued that increased use of natural gas in the US has been accompanied by increased exports of US coal, and the increased global emissions related to the exports has completely offset US emissions reductions from increased natural gas use [54].
Conclusion
Our model results show that scenarios of more abundant natural gas, based on input from 23 experts (table 1 and figure 1), lead to substitution of gas for both coal and renewables in the US power sector. We observed such market competition between gas and renewables in climate policy cases that taxed or capped CO2 emissions, but not where a RPS mandated the level of renewable electricity use. Where gas and renewables compete in our simulations, increased use of gas therefore has little net effect on power sector GHG emissions; only climate policies bring about a significant reduction in future emissions from US electricity generation, relative to present levels. Further, our results suggest that coal use will continue to decline in the US electricity sector, but will decline most if natural gas is abundant and stringent climate policies are adopted. Similarly, the use of renewable technologies continues to increase in our model results, but increases least when natural gas is abundant and there is no new climate policy. We conclude that increased natural gas use for electricity will not substantially reduce US GHG emissions, and by delaying deployment of renewable energy technologies, may actually exacerbate the climate change problem in the long term.
Acknowledgments
We thank the experts listed in table 1 for their participation in this project, as well as Karen Fries, Ken Caldeira, David Keith, Jabe Blumenthal, Max Henrion, Michael Levi, David Hughes, and Chris Nelder. The work was supported by Near Zero, a non-profit organization. We also thank two anonymous reviewers for helpful comments.