
Abstract
With more than 60% of the land farmed, with vulnerable freshwater and marine environments, and with one of the most intensive, export-oriented livestock sectors in the world, the nitrogen (N) pollution pressure from Danish agriculture is severe. Consequently, a series of policy action plans have been implemented since the mid 1980s with significant effects on the surplus, efficiency and environmental loadings of N. This paper reviews the policies and actions taken and their ability to mitigate effects of reactive N (Nr) while maintaining agricultural production. In summary, the average N-surplus has been reduced from approximately 170 kg N ha−1 yr−1 to below 100 kg N ha−1 yr−1 during the past 30 yrs, while the overall N-efficiency for the agricultural sector (crop + livestock farming) has increased from around 20–30% to 40–45%, the N-leaching from the field root zone has been halved, and N losses to the aquatic and atmospheric environment have been significantly reduced. This has been achieved through a combination of approaches and measures (ranging from command and control legislation, over market-based regulation and governmental expenditure to information and voluntary action), with specific measures addressing the whole N cascade, in order to improve the quality of ground- and surface waters, and to reduce the deposition to terrestrial natural ecosystems. However, there is still a major challenge in complying with the EU Water Framework and Habitats Directives, calling for new approaches, measures and technologies to mitigate agricultural N losses and control N flows.
Export citation and abstract BibTeX RIS

Content from this work may be used under the terms of the Creative Commons Attribution 3.0 licence. Any further distribution of this work must maintain attribution to the author(s) and the title of the work, journal citation and DOI.
1. Introduction
In contemporary political debates it is often argued that the development of a green economy, with high levels of environmental protection, and the promotion of low-emission production chains, is an efficient pathway to sustainable economic growth (Carter 2007, The Commission on Nature and Agriculture 2013). In line with this it is argued that environmental protection and pollution mitigation are compatible with the benefits of economic growth, and that the costs are less than the environmental and resource costs of not protecting the environment resources (Stern 2007, OECD 2011, Jacobs 2013). This perspective implies that green growth can be promoted through correcting for environmental market failures, not only by market based incentives, but also by regulation that requires minimum efficiency standards. This may be particularly relevant for agriculture and the related bio-based production sectors (Parajuli et al 2014), where OECD (2011) emphasizes that 'an understanding of how growth occurs (production methods) is at least as important as how much growth takes place'.
Sustainable production methods imply a focus on all aspects of the agricultural production (Gu et al 2011). This paper deals with nitrogen (N) as a critical nutrient in agriculture. With N being central both as an input factor affecting agricultural production and as a critical component for pollution of the aquatic, marine, terrestrial and atmospheric environments (Sutton et al 2011), N policy and regulation is crucial for a sustainable production.
Denmark is here taken as an example of how concerns for agricultural production can be balanced against environmental protection concerns. It is one of the most intensively farmed regions in the world, where more than 60% of its land surface is used for agriculture, it has a food export that is more than twice the national consumption (FAO 2014), and has one of the most well-developed environmental regulation systems in the world (van Grinsven et al 2012).
For centuries, Denmark has been a major food supplier to the neighbouring countries, first with live steers to Germany and surplus cereals to Norway, and subsequently with butter and bacon to Britain and other overseas countries, following the introduction of cooperative dairy and slaughterhouses in the late 1800s (Bjørn 191748-9326, Odgaard and Rømer 2009). Initially the food production surplus was driven by biologically fixed N inputs from grass-clover and pulses (Kjaergaard 1994, Dalgaard and Kyllingsbæk 2003) and a significant expansion of the proportion of land ploughed (Dam and Jakobsen 2008). However, the largest expansion in the food production took place after world war II, and was driven by synthetic N-fertilizer inputs, increasing from 15 kg N ha−1 agricultural land in 1945 to 143 kg N ha−1 when it peaked in 1983 (Dalgaard and Kyllingsbæk 2003, Dalgaard et al 2009), and falling to the 74 kg N ha−1 it is today (Statistics Denmark 2012).
The expansion of agricultural N inputs after world war II gradually led to a parallel increase in agricultural N surpluses, and significantly increased N leaching to groundwater (Hansen et al 2011). With more than 60% of the land farmed and a 7500 km long coastline with shallow estuaries and coastal waters, this has resulted in severe environmental problems, and according to the EU Nitrate Directive Denmark has designated the whole territory as nitrate vulnerable. Increasing groundwater nitrate concentrations exacerbated the problems since the drinking water supply in Denmark is almost 100% groundwater based and, consequently, approximately 15% of the land was designated as nitrate vulnerable abstraction areas in 2005 (Hansen and Thorling 2008).
From 1985 and onwards the following series of political action plans to mitigate losses of N and other nutrients were implemented (updated from Dalgaard et al 2005, Kronvang et al 2008, Mikkelsen et al 2010):
- A.1985 Action Plan on nitrogen, phosphorus and organic matter (NPo)
- B.1987 Action Plan for the Aquatic Environment I (AP-I)
- C.1991 Action Plan for Sustainable Agriculture
- D.1998, 2000 Action Plan for the Aquatic Environment II (AP-II)
- E.2001 Ammonia Action Plan
- F.2004 Action Plan for the Aquatic Environment III (AP-III)
- G.2009 Green Growth Plan
- H.2011 Draft Plans for River Basin Management Plans (RBMPs), implementing the EU Water Framework Directive (WFD)
As a result of the early attention to marine pollution, the first action plans were based on both national and international political initiatives. Already in 1972 Denmark, France, Iceland, Norway, Portugal, Spain, and Sweden signed the Oslo Convention, prohibiting the direct dumping of harmful substances at sea. After the inclusion of among others the United Kingdom, The Netherlands and Germany, this treaty was amended in 1981 and is today included in the OSPAR (1992) 'Convention for the Protection of the Marine Environment of the North–East Atlantic'. The Danish action plans have subsequently been used to implement the EU Nitrates Directive of 1991 (The Council of the European Communities 1991), and the WFD in year 2000 (The European Parliament and the Council of the European Union 2000). Moreover, at an international level the ambitions of reducing nutrient loads to the environment are also important parts of treaties in relation to the HELCOM Baltic Marine Environment Protection Commission (The Helsinki Commission 2008), The Marine Strategy Framework Directive (The European Parliament and the Council 2008), and the from 1983 and onwards enforced UN Convention on Long-range Transboundary Air Pollution (CLRTAP 1979, Sutton et al 2014).
These initiatives and actions have led to significant reductions in N surplus from Danish agriculture (figure 1). The development in N surplus aligns well with the implementation of action plans and also with nitrate concentration in groundwater.
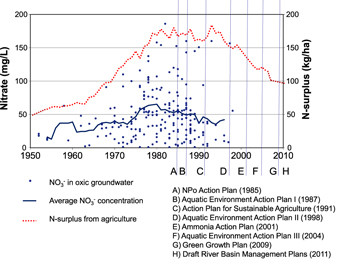
Figure 1. Relation between the nitrogen (N) surplus from Danish agriculture and the 5 yr moving average nitrate (NO3−) concentrations in Danish oxic groundwater samples (updated from Hansen et al 2011). The vertical lines labelled A–H indicate the timing of the series of major Danish action plans to reduce nitrogen pollution of the aquatic or atmospheric environment (for further details, see text and table 2).
Download figure:
Standard image High-resolution imageThe objective of the present paper is to review and discuss listed developments in N management and environmental impacts in Denmark and the different types of policy action, pinpointing trends, challenges and prospects for improved future actions. We present a typology of the policy actions and the related effects on N surplus and N efficiency. Moreover, we assess the effects on the specific N loadings to the environment with special emphasis on loadings to the aquatic and atmospheric environments. Finally, we synthesize and discuss the relevant N flows cascading from agriculture to the environment, via stocks of N in soils, water, atmosphere and biomass, and through the various oxidation steps of reactive nitrogen (Nr); i.e., in the form of nitrate (NO3−), ammonia (NH4), nitrous oxide (N2O), nitrogen dioxide (NO2), etc, with their impacts on nature and environment, production, consumption, economic costs, benefits and public health.
2. Materials and methods
2.1. Nitrogen data
Information on agricultural N inputs and outputs were collected, with focus on the period from 1990 until today, but also including longer time series back in time. In the analyses of N flows and balances, we delineated the system boundary to comprise the entire primary production of the Danish agricultural sector, including cropland, livestock and grazing lands, but excluding processing industry (slaughter houses, flour mills etc). This means that inputs include chemical fertilizers (all imported, since no national production), feedstuff (mainly imported concentrates) and urban and industrial waste products used as soil amendments, but not animal manures, which are entirely produced and recycled within the agricultural sector, as no national export or import of animal manures take place in Denmark (contrary to some other European countries, e.g. The Netherlands). Outputs accounted for include cash crops (cereals, seeds etc sold), milk, eggs, meat and live animals exported, but not fodder crops produced and fed to animals within the agricultural sector. National and regional data are collected from Statistics Denmark (1968, 1969 and 1961–2012) and supplemented by farm and field scale data available via the Danish Research Register for Agriculture, FRJOR (2014), including geo-coded information about all Danish livestock, manure and housing systems, fertilizer use, standard yields and the crops grown on all commercial farms.
Values for N fluxes into the environment are queried from the National Monitoring and Assessment Programme for the Aquatic and Terrestrial Environment (NOVANA), including the discharge at 178 near-coast gauging stations covering 57% of the entire land area of Denmark. Total nitrogen (TN) concentrations are measured at 118 monitoring stations based on discrete sampling at a frequency of 12–26 times per year (mean: 18 samples per year) (Windolf et al 2011). The runoff and loading of TN from the ungauged areas is then calculated utilizing a national model (DK-QN) (Windolf et al 2011), and annual loads of TN from point sources are provided from national databases under the NOVANA programme (Jensen et al 2012).
Simultaneously, N depositions were monitored in the form of wet depositions (bulk samplers) and dry depositions estimated from measured ambient air concentrations and dry deposition velocities determined on the basis of meteorological data derived by MM5 model calculations performed within the Danish THOR system (Ellermann et al 2010, 2012, Brandt et al 2000). Depositions to water systems were estimated as average values from the island based monitoring stations, and assumed representative for marine conditions, while terrestrial depositions are estimated as average values from the land based monitoring stations. In the Danish NOVANA programme, dry deposition of ammonia is furthermore computed using the Danish Ammonia Modelling System (DAMOS: Geels et al 2012, Hertel et al 2013) applied on a routine basis to 129 selected nature areas around the country and verified by comparisons to results from campaign measurements (Sommer et al 2009). The DAMOS model consists of a combination of the long-range transport model Danish Eulerian Hemispheric Model (DEHM: Christensen 1997, Frohn et al 2001) and the local-scale plume model OML-DEP (Hertel et al 2006, Sommer et al 2009). We did not take account of bi-directional ammonia fluxes in the calculations, because deposition of local ammonia represents less than a third of the nitrogen deposition on land (and less at sea) and including bi-directional fluxes would only change the results a few per cent, but would require much more detailed input data. The present ammonia emission inventory for Denmark is based on information at single farm level and accounts for local agricultural practice that plays a significant role for the temporal variation in emissions (Hertel et al 2012). The inventory is based on information from the above national databases (Nielsen et al 2011). A standardised ammonia emission for each livestock farm and associated fields is then estimated based on information on animal type/number and type of crops. The final inventory includes: the total annual ammonia emission from identified point sources (farms, storages etc) in Denmark, and from area sources, i.e., field emissions from the growing of crops as well as emissions resulting from the application of manure and mineral fertilizer. The area sources are distributed in a 100 × 100 m grid covering all of Denmark (Plejdrup and Gyldenkaerne 2011), and the temporal variation in emission is described by 15 additive functions reflecting different agricultural activities and a 16th function describing the contribution from traffic (Skjøth et al 2004). Examples of emission distributions are presented in Geels et al (2012).
Data on nitrate concentrations in groundwater, from certified professional laboratories, was queried from the national Danish geological and hydrological database JUPITER. A subgroup of 194 points in oxic groundwater, where the groundwater recharge age has moreover been determined using the chlorofluorocarbon (CFC) method, allows the comparison of long-term changes in N surplus in agriculture with changes in nitrate content of oxic groundwater (figure 1). In addition, nitrate trend analyses in 152 individual monitoring points were performed (figure 7, left), and 11 518 samples from 3757 oxic monitoring points, sampled from 1967−2011, were used to create a national overview (figure 7, right). The CFC analyses were performed according to the procedure of Laier (2005) and Hinsby et al (2008) as described in Hansen et al (2011).
The national emissions of nitrous oxide were calculated using the standard IPCC emission factor approach (Nielsen et al 2013). These calculations use national inventories of N in fertilizers and manures applied as well as N in various types of manure storages and estimates of ammonia volatilization and nitrate leaching.
Changes in soil organic matter content of agricultural mineral soils was monitored by sampling in 1986, 1997 and 2009 in a Danish nationwide square grid net (7 × 7 km) and analysed for soil organic carbon content (Taghizadeh-Toosi et al 2014). Soils were sampled in three layers, 0–25 cm, 25–50 cm and 50–100 cm. The measured changes in soil carbon content were converted to changes in soil N by assuming a carbon to N ratio of 10 for the labile soil organic matter (Thomsen et al 2008).
The costs of the measures implemented in previous action plans are based on ex-post and ex-ante analyses made from 2003 until today looking at the cost-efficiency of the measures both before and after implementation (Jacobsen 2004, 2012b, Jacobsen et al 2004, Børgesen et al 2009).
2.2. A typology for nitrogen management policies
To analyse the trend in N management policies over years, the major measures implemented in Denmark 1985–2014 are listed and classified according to the following matrix (table 1).
Table 1. Typology for the classification of N policy measures. Each of the combinations could be either N input based (for example regulation of mineral fertilizer inputs) or N output based (for example maximum ammonia emissions to a defined habitat area).
| General regulation | Geographically targeted regulation | |||
|---|---|---|---|---|
| Input based | Output based | Input based | Output based | |
| Command and control (C&C) | X | X | X | X |
| Market-based regulation and governmental expenditure (MBR) | X | X | X | X |
| Information and voluntary action (IVA) | X | X | X | X |
The first category, command and control (C&C), is the classic regulation type, where a certain action or pollution practice is forbidden by law, controlled by the authorities, and fined if the law is violated. In contrast, the second category marked-based regulation (MBR) includes all types of MBR and governmental expenditure that directly affect the market and thereby the economic optimum for production and hence pollution. This category covers both: (i) market-based instruments where the management and pollution behaviour are regulated via market incentives, typically via a green tax (for example N-taxation) under the polluter pays principle (Carter 2007), (ii) other types of MBR (for example N quotas combined with manure trading possibilities), and (iii) governmental expenditure, that in the form of subsidies affects the market in a similar way to taxes, but by encouragement rather than inhibition. Governmental expenditure is not necessarily under the polluter pays principle (for example, most of the EU agri-environmental policy measures are under this category, as they are designed to promote environmentally friendly production practices, but financed by the EU member states budgets and not via a specific farm tax; Buller et al 2000). Finally, the remaining types of policy measures are classified as information and voluntary action (IVA). This includes knowledge production and communication of information about more sustainable N-management practices and technologies via research and extension services (which may be subsidized), and actions by 'individuals or organizations doing things to protect the environment that are neither required by law nor encouraged by financial incentive', and which 'the government can encourage through a range of communicative strategies' (Carter 2007).
The typology further distinguishes between general versus geographically targeted regulation, which is especially relevant for N management policies, because both the risk of N losses, the pressure of N load to the environment, and the sensitivity of the environment depend strongly on local geology, soil, climate and recipient ecosystems (Blicher-Mathiesen et al 2014). 'General regulation' measures are implemented equally in all parts of Denmark, whereas 'geographically targeted regulation' measures are implemented differently (i.e. localized) depending on specific geographical conditions (for instance, with different N regulations for different watersheds, and different regulations depending on the sensitivity of the receiving environment to N losses, see Jacobsen et al 2007).
Finally, the regulation type can be either N input based (for example, regulation of fertilizer inputs) or N output based (for example, maximum ammonia emissions to a defined habitat area).
2.3. Nitrogen surplus and efficiency
In line with OECD (2000), the main indicators used in the present paper comprise N surplus and N use efficiency (NUE, or just N-efficiency). As mentioned above, system boundary comprises the entire primary production of the Danish agricultural sector, including cropland, livestock and grazing lands, and the N surplus and NUE. The agricultural N surplus is defined as N input minus N output in agricultural products from the agricultural sector (equation (1)), while N efficiency is defined as N output in agricultural products per unit N input (equation (2))

Annual values for N inputs and N outputs are derived from national agricultural statistics (1968, 1969 and 1961–2012) according to Vinther and Olsen (2013) and Kyllingsbæk (2000). N inputs include N in commercial fertilizers and urban and industrial waste materials spread to the fields, N in imported concentrate feedstuffs like soybean cake, meat and bone meal (banned from year 2000), fodder urea, fish products, etc, and N derived from the atmosphere. The latter includes estimated values for net N deposition and biological N fixation via legumes and free-living micro-organisms. N outputs include N in: (i) animal products, embracing eggs, milk, meat, live animals or livestock received by offal destruction plants, and (ii) plant products in the form of cereals for food products, straw for energy purposes etc, seeds for manufacturing and sowing, beets for sugar production, potatoes, and other fruits and vegetable products.
N surplus can be used as a proxy for N losses from farming, assuming no change in the soil N pool, and covers a number of N loss components (see equation (1)). In general, the largest N loss component is the leaching of nitrates (Dalgaard et al 2011a). N leaching is of special importance in relation to ground and surface water pollution. Other N loss components are gaseous N (ammonia, di-nitrogen, nitrous oxides etc) and particulate N (mainly organic matter). Some of the surpluses may temporarily accumulate in farm product stocks, as biomass or in soil organic matter, but over time and as the soil system approaches steady state, N surplus and N loss will converge, although this may take many decades or even centuries. It must be noted that in the present paper N surpluses and N efficiencies are calculated for the whole Danish agricultural system and cannot be directly compared with results calculated at other scales.
3. Results
3.1. Trends in nitrogen policies and management
The major N policy measures implemented in Denmark are presented in table 2. C&C regulation was implemented first, followed by a mix with MBRs including increased governmental expenditures along with the more IVA based measures.
Table 2. The major N policy measures, implemented over the past 30 years with the Danish action plans (AP) in 1985 (NPo), 1987 (AP-I), 1991 (AP for a more sustainable agriculture), 1998 (AP-II), 2001 (ammonia AP), 2004 (AP-III) and 2009 (Green Growth AP), classified into the table 1 policy typology. Localized measures represent the geographically targeted types of table 1, and brackets indicate that the measures fit only partly to the typology class. Until more recently, nearly all regulations focused on the N input side, but from 2004 and onwards output-based regulation also appears.
| Year | N measures imposed: | C&C: command and control | MBR: market-based regulation and governmental expenditure | IVA: information and voluntary action |
|---|---|---|---|---|
| 1985 | Max. stock density. | X | — | — |
| Mandatory slurry tank floating barriers. | X | — | — | |
| No runoff from silage clamps and manure heaps. | X | — | — | |
| Min. slurry capacity and ban on winter spreading of slurry for spring crops (including subsidies to invest in slurry tanks etc). | X | (X) | — | |
| 1987 | Mandatory fertilizer and crop rotation plans. | X | — | — |
| Min. proportion of area with winter crops. | X | — | — | |
| Mandatory manure application within 12 h. | X | — | — | |
| 1991 | Statutory norms for manure N utilization. | X | — | — |
| Max N applied to crops equalling economic optimum. | X | (X) | — | |
| Subsidies to low-N grasslands in environmentally sensitive areas. | — | (X) (localized) | (X) | |
| 1998 | Max. N applied 10% below economic optimum. | X | (X) | — |
| 6% obligatory catch crops. | X | — | — | |
| Subsidies to more organic farming, wetlands, extensification and afforestation. | — | X (localized) | (X) | |
| 2001 | Promotion of low excretion livestock feeding. | — | — | X |
| 2004 | More catch crops. | X | — | — |
| Tightened ammonia restriction (e.g. broadcasting banned), and special restrictions near sensitive nature areas. | X (localized) (output-based) | — | X | |
| Subsidies to promote better manure handling and animal housing (BAT). | — | X | X | |
| 2009 | Buffer zones around streams, lakes and NH4 sensitive habitats. | localized (output-based) | — | — |
| Tax on mineral P in feed. | — | X | — | |
| Max. N applied ≈15% below economic optimum. | X | (X) | — | |
| Optimized feed practice promotion. | — | — | X |
From the beginning, all measures were implemented as 'general regulation', i.e., with equal norms and standards for all parts of the country. The first exception to this was in 1990 with the implementation of environmentally sensitive areas (ESAs) which was designated with the major aim to reduce N pollution (MAFF 2004), and with EU co-financed subsidies to reduce N-fertilization of grasslands (Buller et al 2000). Originally, regional authorities were responsible for the designation of these areas. In this way they were geographically targeted (but with the same fixed subsidy classes for the whole country, and with subvention opportunities for farmers living inside the designations), and for farmers it was voluntary whether they signed up to the scheme or not. Further geographical targeting was implemented in 1998 with the AP-II agri-environmental subsidy schemes for (voluntary) construction of wetlands and afforestation in designated areas. Another initiative in 1998 was the initiation of the detailed Danish groundwater mapping programme on approximately 40% of the land surface aiming at establishing site-specific groundwater protections zones based on assessments of the nitrate vulnerability of the aquifers (Thomsen et al 2004, Hansen and Thorling 2008).
Until the AP-III in 2004 all regulation was carried out on the input side. The first exception to this was the designation of buffer zones set around ammonia sensitive habitats, followed by special restrictions for emissions from new livestock buildings to designated nature areas. Even though the 1991 Nitrates Directive aimed to reduce the 'end of pipe' NO3− concentration in leached water to below 50 mg L−1, the regulation was implemented on the input side in the form of restrictions on the livestock density and manure applied to the fields (van Grinsven et al 2012). It was found that the direct N-effect of reduced livestock density was low, but it has helped to avoid very high livestock intensity resulting in national or regional nutrient surplus, as found in The Netherlands, Belgium (Flanders) and parts of France (Brittany). The key measures in Action Plan II were a higher required fertilizer equivalency of animal manure N, and reduced statutory fertilization N-norms (Jacobsen 2004).
In the future, and in particular with the further implementation of the EU WFD, this regime is expected to change dramatically, requiring both new types of regulation supported by considerable research and development to make the measures more geographically specific (The Commission on Nature and Agriculture 2013).
3.2. Trends in nitrogen surplus and efficiency
In this study, we analyse the overall N use efficiency of the entire agricultural sector per se, and have not intended to analyse NUE of agricultural subsystems, like crop or livestock production, separately. Overall agricultural N balances will be a key determinant for environmental impacts, and in that sense, temporal trends and dynamics in N surplus and NUE for the agricultural sector will be better linked to the environmental N indicators, like aquatic environment N levels, which we compare against in the paper. The drawback is, that the NUE becomes dependent on the specific Danish ratio of livestock to crop production, which makes it difficult to compare against other countries with a different ratio, but has the advantage that national registry data can be utilized to a much larger extent for the inventory.
When the development in total agricultural N inputs and N outputs in products is calculated (figure 2) it is clear that especially the input of N to the agricultural sector has been reduced since the implementation of the action plans (from 662 Gg N when it peaked in 1983 to 448 Gg N in 2012). Seen over the period from 1990 to 2010, the N input was reduced by 34%, mainly through reduction in the application of synthetic fertilizer N, while the N output in products was only reduced by 15% in the same period and, consequently, the total N surplus was reduced by 45%, from 437 Gg to 241 Gg.
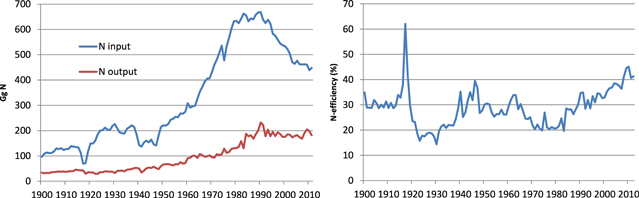
Figure 2. (a) Total sum of N inputs to and sum of N output in products from Danish agriculture, and (b) overall nitrogen use efficiency (N-efficiency) for Danish agriculture over the period 1900–2012. For definitions, see equations (1) and (2).
Download figure:
Standard image High-resolution imageThis means that over the past 25 years the average N surplus has been reduced from approximately 170 kg N ha−1 yr−1 to below 100 kg N ha−1 yr−1 for agricultural, while the overall NUE for the agricultural sector has increased from around 20–30% to 43% (figure 2). However, it is worth noting that this increase in NUE appeared after a period where the NUE was reduced from 30% in 1950 to below 20% in 1983—its lowest ever level. However, it is fair to say that the present NUE of more than 40% is high, considering the high level of animal production in Danish agriculture (Denmark is one of the world's largest exporters of animal products, and the export of animal products grew by 39% from 33 kg N ha−1 in 1990 to 46 kg N ha−1 agricultural land in 2010). It is true that during the two world wars the NUE was even higher (peaking at around 60% during WW1 from 1914 to 1918, and 40% during WW2 from 1939 to 1945), but this represents an unsustainable situation caused by a severe shortage of fertilizer inputs (represented by the drop in N-inputs on figure 2, left), and a similar drop in the production of plant products (Dalgaard and Kyllingsbæk 2003).
N input to crop production in the form of imported fertilizers and atmospheric N from biological N-fixation and deposition has been reduced from the mid 1980s (figure 3), with an important turning point when the import of synthetic fertilizers peaked in 1983 with 143 kg N ha−1 and a total N input from fertilizers and the atmosphere of 162 kg N ha−1 agricultural land. However, the total N input from fertilizers and atmosphere did not peak until 1989 with 169 kg N ha−1 (142 kg N ha−1 from fertilizers and 27 kg N ha−1 from atmospheric fixation and deposition), but was reduced by 50% over the period 1990–2010. Over the same period the import of feed was sustained (equal figures of 71 kg N ha−1 in both 1990 and 2010), whereas the N output in the form of plant products was halved from 48 kg N ha−1 to 24 kg N ha−1, and the animal production as mentioned above increased by 39%. It must be noted that there are a large annual variation, especially in the plant production figures, but overall it must be assumed that the decreased output of grain cereals and other plant products was primarily caused by an increased use of domestically harvested plant products for livestock feed, so that these do not appear as product outputs in the inventory. Simultaneously, a smaller decrease in domestically harvested N was observed by Blicher-Mathiesen et al (2013), from 128 kg N ha−1 harvested in 1990 to 107 kg N ha−1 harvested in 2010, among other things because of a changed cropping pattern, crop use and the overall reduced N-fertilization level.
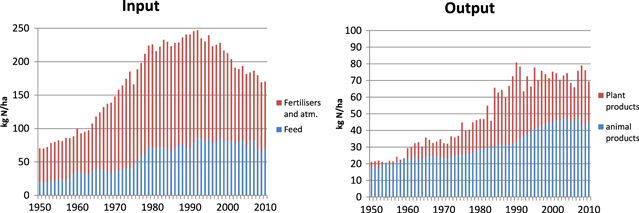
Figure 3. Developments in the form of net N inputs to and net product N outputs from Danish Agriculture, average per hectare agricultural land. Inputs include livestock feed (i.e. imported concentrates), plant fertilizers (imported since no Danish fertilizer production) and atmospheric N inputs (deposited + biologically fixed), and N outputs include animal products (i.e. milk, egg, meat) and cash crop products (sold from the agricultural sector, so not including fodder products utilized for livestock feed).
Download figure:
Standard image High-resolution image3.3. Nitrate leaching and emissions to the aquatic environment
The dominant source of TN loadings to coastal waters in Denmark is agriculture, which based on calculations for the period 2007–11 contributed 70% of the TN loadings, followed by background losses (21%), and emissions from point sources (9%) (Nielsen et al 2011, Windolf et al 2011).
The water runoff from Denmark to coastal waters showed large inter-annual variations during the period 1990–2012, with the driest year being 1996 and the wettest 1994 (figure 4, top). A similar pattern can be seen for the TN loadings to Danish coastal waters showing the lowest and highest values in the same two years (figure 4, bottom). The TN loading from all sources to coastal waters has decreased from an average of ca. 100 Gg N in the period 1990–94 to ca. 59 Gg N in 2012 (figure 4, centre). The export coefficient of TN from the entire Danish terrestrial area thus decreased from 23.3 kg N ha−1 to 13.7 kg N ha−1 during these two periods (41%). The point source contribution to TN loadings in Denmark has decreased significantly due to improved treatment of especially urban wastewater during the period 1990–2012 (figure 4, mid). The emission from all point sources amounted to an average of 19.6 Gg N during the period 1990–4 and had in 2012 been reduced to 5.7 Gg N, corresponding to a reduction of 71% (Wiberg-Larsen et al 2013). The flow weighted concentration of TN shows a decline from an average of 7.1 mg N L−1 in 1990–4 to 3.9 mg N L−1 in 2012 (46%). Most of the reduction in TN loadings to coastal waters shown in figure 4 is derived from a reduction of TN emissions from diffuse sources, mainly agricultural sources.

Figure 4. Annual total volume of runoff (top), annual total N loading (centre), and annual flow-weighted total N concentration in Danish surface water outflow to the sea (bottom). (Based on Wiberg-Larsen et al 2013).
Download figure:
Standard image High-resolution image3.4. Atmospheric ammonia volatilisation and deposition
Deposition of atmospheric N to Danish terrestrial areas varies significantly between different parts of the country (figure 5) but also very locally due to differences in local agricultural production and the type and roughness of the surface.

Figure 5. The deposition of atmospheric ammonia (left) and total atmospheric nitrogen (right) computed for 2012 in kg N ha−1 yr−1. The displayed data represent the average deposition for the grid cells. Deposition rates vary for different surface types and in the displayed data this is handled by weighting depositions according to the fraction covered by each surface type. Grid cells are 6 km × 6 km, except for the outer part of the domain where the resolution is 17 × 17 km. (Based on results from JH Christensen, Aarhus University, and Ellermann et al 2013).
Download figure:
Standard image High-resolution imageFor 2012, the atmospheric deposition of ammonia was found to vary from 0.5 to 15 kg N ha−1 yr−1 (figure 5, left), and total N deposition from 8 to 23 kg N ha−1 yr−1 (figure 5, right). Total atmospheric N deposition to Danish terrestrial areas has been calculated at 60 Gg for 2012 (Ellermann et al 2013). This gives an average annual deposition of 14 kg N ha−1 yr−1, which is an N input above the critical loads for many of the sensitive ecosystems in Denmark (Hertel et al 2013). The deposition varies over the country due to a general South–North gradient in concentration contributions from long-range transport from source areas in Central Europe, but also due to local differences in ammonia emissions over Denmark and to differences in precipitation. The largest depositions are thus found in Southwestern Denmark where the livestock production is high and so is precipitation. Uncertainties on the model calculations are estimated to be up to ±40% for the averages in the grid cells. This uncertainty has been derived from comparisons with measurements from the routine monitoring stations in Denmark. Generally an integrated monitoring approach is applied where models and measurements are used in combination (Hertel et al 2006).
In comparison, the total annual atmospheric N deposition to Danish marine waters has been calculated at 81 Gg N, which gives an average deposition of 7.7 kg N ha−1 yr−1 in 2012 (the area of Danish marine waters measures 105 000 km2) (Ellermann et al 2013).
Both measurements and model calculations show a decrease in deposition to Danish land surfaces of about 25% over the time period from 1989 to 2009 (figure 6, top), and a decrease of about 20% in depositions to water surfaces (figure 6, bottom), with an apparent continuous downward trend in the measured depositions over the whole period 1989–2012. The displayed series of DEHM modelled depositions are on a 17 × 17 km resolution (Christensen 1997, Frohn et al 2001), and are about 20% overestimated for the land surfaces and about 10% overestimated for the water surfaces. Nevertheless, the modelled depositions reproduce well the development over the years. This indicates that the emission inventories reflect the actual development and that the model responds correctly to the development. Better agreement has been found when DAMOS has been applied and the OML-DEP model has calculated depositions in a 400 × 400 m resolution (Sommer et al 2009, Geels et al 2012, Hertel et al 2012), but such simulations cannot be made for the entire 20 yr, national time series.
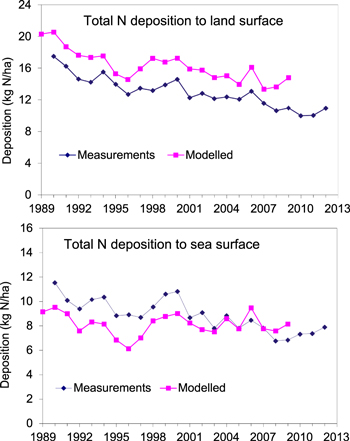
Figure 6. Development in measured and modelled atmospheric N depositions to land surfaces (top) and water surfaces (bottom) during the time period 1989–2012 (modelled only shown up to 2009). 'Measured' deposition is constructed from measured wet deposition (bulk samplers) and dry deposition velocities applied to measured ambient air concentrations of gaseous and particulate nitrogen compounds. Part of this data has previously been depicted in Ellermann et al (2010).
Download figure:
Standard image High-resolution imageIn total, about 97% of the present Danish NH3 emissions originate directly from agriculture and only 3% from non-agricultural sources (with 80 of the 97% from manure management, 9% from other soil based activities, and 8% from other agricultural activities). In contrast, the Danish emissions of NOx primarily originates from other industries, and only indirectly from agriculture (with about 47% from the transport sector, 21% from energy industries, 19% from non-industrial combustion and the remaining 13% from manufacturing industries, construction and other types of activities. The agricultural N policies shown in table 2 have primarily affected the ammonia-based emissions (and depositions), and thus only a minor part of the total depositions in figure 5. However, in the livestock-intensive country of Denmark these lower emissions from agriculture have contributed significantly to reducing total N depositions; and for local depositions to sensitive nature areas the effects of agricultural N mitigation measures have been particular decisive.
The ammonia emission from agriculture has been reduced from 97 Gg NH3 in 1990 to around 66 Gg in NH3 (more than 30%), when looking at the total NH3 emission as included in the NEC directive reporting (Nielsen et al 2013b). This reduction has been possible both as a side effect of the measures to reduce N-losses to the aquatic environment and because of a trend to implement new technologies. The technology change has been widespread and this has also meant that the cost of increasing utillization and lower NH3 emission has been relative low as the technologies were easy available (Jacobsen 2012c).
3.5. N in groundwater
Nitrate has been found in the oxic part of the groundwater throughout Denmark, with large geographical variations, and a tendency for higher concentrations on the sandy soils in Western Denmark, and in areas with a high livestock density (figure 7, right, Hansen et al 2012). Data from the Groundwater Monitoring Programme (191748-9326–2009) show that the nitrate concentration of 25 mg L−1 is exceeded at approximately 79% of the oxic monitoring points, and the groundwater and drinking water standard of 50 mg L−1 is exceeded in approximately 48%. Since the 1980s the overall national upward trend of the nitrate concentrations in oxic groundwater has been reversed. In addition there is a tendency for the frequency of very high nitrate concentrations in oxic groundwater to decline. Locally, nitrate trend analyses in monitoring wells have shown a complex pattern with both upward and downward nitrate trends depending on the age of the groundwater and local agro-hydro-geochemical conditions (figure 7, left; Hansen et al 2012). Therefore site-specific groundwater mapping and protection plans are being carried out in order to further protect drinking water resources from nitrate pollution.
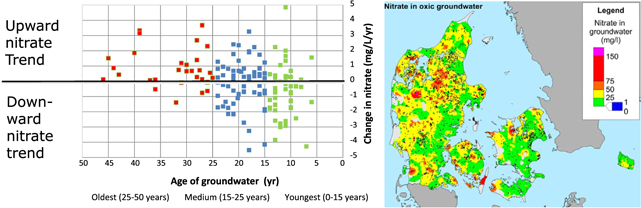
Figure 7. Left: three age groups of upward and downward nitrate trends in oxic groundwater at 152 CFC-dated groundwater measuring points. Right: interpolated map of the nitrate concentration in the Danish oxidized groundwater based on 3757 analyses performed from 1967−2010. Average values from each measuring point are used in the interpolation (based on results from Hansen et al 2012).
Download figure:
Standard image High-resolution image3.6. Nitrous oxide emissions
According to the national inventory of greenhouse gas emissions, N2O emissions were reduced from 17.1 Gg N in 1990 to 11.2 Gg N in 2011. About half of the estimated emissions originate from soil following application of fertilizers and manure, whereas the other emissions come from manure storages and indirect emissions from volatilized ammonia and leaching of nitrates. The reduction in fertilizer use and in losses of N therefore contributed to the reduction in estimated N2O emissions. It should be noted that the emission factors applied generally is slightly higher than found in experimental studies in Denmark (Chirinda et al 2010, Rees et al 2013).
3.7. Changes in soil carbon
The average soil organic carbon stock in 0–100 cm of Danish agricultural mineral soils was 137 Mg C ha−1, which assuming a C : N ratio of 10 corresponds to 13.7 Mg N ha−1 (Taghizadeh-Toosi et al 2014). The changes in soil organic matter over the period from 1986 to 2009 varied between soil types, most likely linked to different land use and management. Loamy soils dominated by cereal crops lost soil organic matter from the entire soil profile to 100 cm depth corresponding to annual N loss of 124 kg N ha−1, whereas sandy soils gained N at an average rate of 51 kg N ha−1. As an average of all agricultural mineral soils, there was a small and non-significant annual reduction of 20 kg N ha−1.
4. Discussion and conclusions
4.1. The development in N-measures and their effect
Some of the most effective Danish policy measures for N mitigation have focused on a better utilization of N in manures and lower fertilization N-norms (Grant and Waagepetersen 2003, Børgesen et al 2009, 2013). This has been driven by the implementation in Denmark of statutory norms for the minimum utilization of N in organic fertilizers (figure 8), combined with strict maximum limits for how much N (plant-available N in organic as well as mineral fertilizers) can be applied. This means that farmers must keep an account of their N-application based on a state-defined norm system, document their use of manure and mineral fertilizers in mandatory fertilizer and crop rotation plans, and adhere to prescribed minimum substitution rates of mineral fertilizers with manure (Petersen and Sørensen 2008, MAFF 2013).

Figure 8. Development of statutory norms for the minimum fertilizer substitution rate for total-N in manure compared with N in synthetic mineral N fertilizers (mainly ammonium-nitrate) in Denmark (Petersen and Sørensen 2008).
Download figure:
Standard image High-resolution image
A central question is; why the C&C related measures were implemented first—before the combination of more MBR and IVA types of measures, and why they were so effective? Especially for the manure related measures, a central answer to this seems to be that it was simply economically worthwhile for the farmers to comply with the new restrictions, as the new technology was not too costly (Jacobsen 2004). Already in the late 1970s the benefits of better manure utilization was documented (Højmark and Fogh 1977, Skriver 1978). Therefore the farmers' associations from the very start supported the development, test and implementation of new low-emission technologies for manure management for application of via the extension services (Skriver 1989). It can thus be argued that the C&C measures in the first action plans were effectively combined with farmers' voluntary actions. However, according to table 2 these IVAs were not directly a part of the official measures implemented, but may partly explain the reversing trend of N surplus and nitrate in oxic groundwater before the first action plan was implemented in 1985 (Hansen et al 2011). Such IVA schemes should therefore arguably be more widely supported (Petersen et al 2014). However, simultaneously it should be mentioned that around 1985–90 the inter-farm variation in manure N use efficiencies was very large (Grant et al 1995), and that the C&C measures had a significant effect, especially for farms with a low NUE and only little response to voluntary action. Moreover, in Danish agriculture the tax system and subsidies to restore housing and manure systems are important for the investments in new and more environmental friendly production systems (DLR 1990). This has provided strong incentives for farmers to increase the fertilizer value of manures, and development and implementation has continuously driven forward with the gradually increasing regulatory pressure (table 2).
From 1991 and onwards, an N quota system was implemented consisting of statutory norms for the N fertilization of defined combinations of crops, soil types, climate zones etc, and these norms were not to be exceeded for the farm as a whole. This quota was initially calculated to tally with the economically optimum N fertilization rate based on data from a large number of annual N fertilizer response experiments (Mikkelsen et al 2010). However, from 1998, the N quota was as part of a political agreement in parliament reduced below the economic optimum (initially 10% below the optimum, currently around 15% below the optimum crop N fertilization level in terms of production economy). This sub-optimal N application regime has meant that farmers have been very focused on utilizing their available N quota on the crops which gives the highest economic return. The sub-optimal N-quota means that higher utilization of N in e.g. manure has a value which is higher than the price of mineral N. This encourages the use of technologies that lead to a higher utilization than the minimum requirements (figure 8) e.g. through lower ammonia emissions. In this way, the regulations have affected both the production value and the market for manure and for land to receive the manure. The Danish legislation has prevented very high concentrations of livestock by coupling livestock production with requirements for agricultural land. In consequence, the N quota system has not lead to much 'on paper only' re-distribution of manure, in contrast to what has been a problem with for instance the corresponding Dutch regulations. The Netherlands have therefore found it necessary to monitor each truck load of manure with GPS and to install official weighing stations, which is fairly costly (Van der Straeten et al 2011), and also in other countries as for instance Italy, France and Scotland (Dalgaard et al 2012) high livestock concentration have led to considerable hot spots for N-losses.
In summary, the N-measures have from the mid 1980s until today (2012) helped reduce the N surplus by around 40% if measured per ha, or by more than 50% if measured by kg N (because the agricultural area declined during the period). Over the same period, N-leaching from the root zone has also been approximately halved (Grant and Waagepetersen 2003, Dalgaard et al 2005, Børgesen et al 2009, 2013). Although the N surplus was reduced by more than 50% from 1990 to 2011, the total N loadings to the aquatic environment and the N-deposition from ammonia were reduced by less (roughly 42% and 25%, respectively). This shows the need to understand the relationships between the different N pools and flows, including the denitrification of N, and the buffers of N in biotic N pools (soils and biomass) as well as the retention in ground- and surface water aquifers before it enters the aquatic environment and the atmosphere. Modelling such effects is outside the scope of the present paper but is an integral part of the further work in the DNMARK (2014) research alliance, where time-series for all relevant N flows and stocks will be calculated for the period 1990–2010 (Hutchings et al 2014), and scenarios for selected N mitigations options will be modelled and demonstrated (Dalgaard et al 2014).
4.2. Socio-economy and public health
According to Jacobsen (2009, 2012a, 2012b) total annual costs of the major Danish N action plans to date are roughly €600 million. About €340 million of these annual costs relate to the agricultural measures from AP-I onwards (table 3). The rest primarily covers costs related to industry and sewage treatment plants outside agriculture.
Table 3. Estimated costs of agricultural measures in the different N action plans (APs) and the first version of the River Basin Management Plans (RBMP) of the EU Water Framework Directive to reduce N losses from agriculture (Jacobsen et al 2004, Jacobsen 2009, 2012a, 2012 b). The administrative costs are not included.
| Ex-ante costs (mill. € yr−1) | Ex-post costs (mill. € yr−1) | |
|---|---|---|
| AP-I for the aquatic environment (1987) | 84 | Not calculated |
| AP for a more sustainable agriculture (1991) | 134 | Not calculated |
| AP-II (1998–2003) | 92 | 70 |
| AP-III (2004–2015) | 22 | 21 |
| Green Growth AP and RBMP 1.0 (2011) | 41 | 48a |
| Total | 340 | NA |
aOf the €48 million total costs the agricultural sector pays €18 million and the public sector including EU €30 million annually. The plan has been altered in 2014 and so a re-estimation of the costs has not been carried out yet. The costs for the agricultural sector of RBMP 1.0 are likely to be lower as some measures are dropped (e.g. targeted catch crops).
In general, measures were chosen partly on their N mitigation cost-effectiveness, partly on other benefits which politicians wanted to promote. A significant reason for the success of the Danish policies is that, when designing the policies, efforts have been taken to reduce the costs to farmers. In summary, the most cost-effective measures in AP-II have been the requirements for catch crops (obligatory % of cropped area to be undersown by grass or other species, to reduce N-leaching after main crop) and constructed wetlands, increased utilization-efficiency for N in animal manures, and improved feeding practices (lowering excretion of N in manure). The least cost effective measures have been land set-aside and increased area under grass, as well as the requirement for reduced animal density (Jacobsen 2009). Other benefits besides N mitigation (such as biodiversity and climate protection) are not included in the calculation, and this is the main reason why area-related measures generally have the lowest cost efficiency.
In recent assessments of the costs and benefits of N regulation in agriculture, Andersen et al (2013) found that large economic benefits are related to drinking water health impacts, rather than to improvements in surface water quality as such. Nitrate in drinking water has been suspected of negatively affecting human health, for example by causing cancer (Schullehner and Hansen 2014) although no clear evidence has as yet been found (Jensen 1982, De Roos et al 2003, Ward et al 2005). An assessment of social costs of the health effect (in this case colon cancer) due to nitrate in drinking water in 11 EU member states, estimated that Denmark had the largest percentage of the population (16.2%) exposed to elevated nitrate concentrations (>25 mg L−1) (van Grinsven et al 2010). The social costs associated with the loss of healthy life years were at 6.6 euro per capita—more than twice the average of the 11 EU member states assessed. However, a new assessment by Schullehner and Hansen (2014) reveals that only approximately 5.1% of the Danish population was exposed to nitrate concentrations >25 mg L−1 in 2012, and further investigations on the actual health effects are needed.
As expected, the N measures related to agriculture have, over time, become gradually more expensive per kg reduced N loss. The current costs are around €3–4 per kg N lost to the environment, and the lower crop yields caused by N fertilization below the economic optimum has over time led to higher costs than estimated in 2004. New solutions to meet the requirements in the EU Habitats Directive, the Marine Strategy Framework Directive and the WFD are therefore called for. The vision for future regulation is to be able to implement measures where the N mitigation benefit is the highest, and allow for increased production elsewhere, i.e. on arable land with higher N retention capacity. The Danish N-policies have so far been national and input based. However, the WFD requires local and output-based approaches with management at the river basin scale, analyses of cost-effectiveness, and measures targeted where the effect is the highest, calling for a new regulation regime. However, more targeted regulation requires more detailed data, there will be more uncertainty in the effects estimated, and some measures might be placed in the wrong place. Therefore, knowledge about the uncertainty related to the estimates is important (Refsgaard et al 2014), and the choice of modelling and monitoring framework will be critical for the identification of sensitive (high risk of N loss) and robust (high capacity for N retention) areas in regard to nitrate vulnerability of surface waters. Regardless of whether empirical or mechanistic models are applied for estimating the effect of specific measures, combination with output monitoring (e.g. drainage water monitoring of N concentrations) are likely to produce the most reliable guidance Furthermore, experiences on how to better integrate the different types of regulation in table 2, with a more localized and output based approach, will also be important.
Over the coming years (2014–7) pilot studies of the implementation of new, local RBMPs will be carried out in selected pilot areas in connection to the DNMARK (2014) research alliance. It is expected that these studies can help drive N-regulation towards more output based and localized regulation, facilitate better N-management, and overall improve the cost-effectiveness and mitigation effect. Over the past 30 yrs the table 2 mix of policy measures has helped to increase the overall NUE from 20–30% to around 40–45%. According to Dalgaard et al (2011b), it should be possible to continue this development in the coming decades, but this will require a continuous implementation of new technologies and management practices. The pilot areas can be used to demonstrate this and facilitate the locally-adapted actions needed for farmers to comply with policy requirements without incurring excessive costs. In this way we hope to develop a greener economy and develop solution scenarios for the further sustainable management of N.
4.3. Overall conclusion
Losses of N from Danish agriculture have been reduced significantly over the last three decades through regulation that obliges all farmers to consider manure and fertilizer as a valuable resource. However, further reductions are required, especially to comply with the EU WFD. Applications of N to crops are now well below the economic optimum and a further general reduction of N supply to crops would be very expensive. A change of paradigm is therefore planned, with severe restrictions placed on applications to land vulnerable to nitrate leaching to the aquatic environment and a potential easing of restrictions in other areas. The lesson for other countries is that general regulation can be usefully applied to control widespread excessive applications of N but that once this has been achieved, and if further reductions are necessary, a switch to more spatially targeted measures is required.
Acknowledgements
This work was supported by the www.dnmark.org Strategic Research Alliance (DNMARK: Danish Nitrogen Mitigation Assessment: Research and Know‐how for a sustainable, low‐Nitrogen food production (2013–2017) funded by The Danish Council for Strategic Research (Ref. 12‐132421)/Innovationsfonden and the Aarhus University Research Foundation, and the Platform for Research in Biobased Production (BIOBASE) funded by the Danish Centre for Food and Agriculture.