
Abstract
The diversity of ecosystems across boreal landscapes, successional changes after disturbance and complicated permafrost histories, present enormous challenges for assessing how vegetation, water and soil carbon may respond to climate change in boreal regions. To address this complexity, we used a chronosequence approach to assess changes in vegetation composition, water storage and soil organic carbon (SOC) stocks along successional gradients within four landscapes: (1) rocky uplands on ice-poor hillside colluvium, (2) silty uplands on extremely ice-rich loess, (3) gravelly–sandy lowlands on ice-poor eolian sand and (4) peaty–silty lowlands on thick ice-rich peat deposits over reworked lowland loess. In rocky uplands, after fire permafrost thawed rapidly due to low ice contents, soils became well drained and SOC stocks decreased slightly. In silty uplands, after fire permafrost persisted, soils remained saturated and SOC decreased slightly. In gravelly–sandy lowlands where permafrost persisted in drier forest soils, loss of deeper permafrost around lakes has allowed recent widespread drainage of lakes that has exposed limnic material with high SOC to aerobic decomposition. In peaty–silty lowlands, 2–4 m of thaw settlement led to fragmented drainage patterns in isolated thermokarst bogs and flooding of soils, and surface soils accumulated new bog peat. We were not able to detect SOC changes in deeper soils, however, due to high variability. Complicated soil stratigraphy revealed that permafrost has repeatedly aggraded and degraded in all landscapes during the Holocene, although in silty uplands only the upper permafrost was affected. Overall, permafrost thaw has led to the reorganization of vegetation, water storage and flow paths, and patterns of SOC accumulation. However, changes have occurred over different timescales among landscapes: over decades in rocky uplands and gravelly–sandy lowlands in response to fire and lake drainage, over decades to centuries in peaty–silty lowlands with a legacy of complicated Holocene changes, and over centuries in silty uplands where ice-rich soil and ecological recovery protect permafrost.
Export citation and abstract BibTeX RIS

Content from this work may be used under the terms of the Creative Commons Attribution 3.0 licence. Any further distribution of this work must maintain attribution to the author(s) and the title of the work, journal citation and DOI.
1. Introduction
Permafrost degradation alters ecosystem structure and function through changes in microtopography associated with differential thaw settlement (Osterkamp et al 2009), surface and subsurface hydrology (Walvoord et al 2012, Quinton et al 2009, Yoshikawa and Hinzman 2003), lake levels and drainage (Jones et al 2011, Jepsen et al 2013), biogeochemical processing and export of carbon and nutrients (Striegl et al 2005, Walvoord and Striegl 2007), and vegetation (Racine et al 1998, Jorgenson et al 2001). Permafrost degradation is of global concern because even small losses of the estimated 1400–1850 Pg of soil organic carbon (SOC) in high-latitude soils could affect trace gas concentrations of the atmosphere (Schuur et al 2008, McGuire et al 2009, Tarnocai et al 2009, Grosse et al 2011). A substantial portion of SOC is in the upper permafrost and could become susceptible to decomposition after thaw (Harden et al 2012b). The rate that permafrost thaws and the surface subsides, however, is affected by the high variability in ground ice in soils (Kreig and Reger 1982, Jorgenson et al 2008, Kanevskiy et al 2013), which in turn is the product of the history of permafrost aggradation and degradation over periods of decades to hundreds of thousands of years (Shur 1988, Froese et al 2008). Thus, we would expect that vegetation, water and SOC responses could be highly variable among the diverse ecological and permafrost conditions across boreal landscapes.
The diversity of boreal ecosystems, and their vegetation composition, is due to large gradients in climate, topography, surficial materials, hydrologic regimes, soil properties, permafrost, disturbance and time (Van Cleve et al 1983, Viereck 1992). These co-varying biophysical characteristics have been classified into 40–70 ecosystem types across boreal Alaska, and have been aggregated into broader soil landscapes that have characteristic successional trends after disturbance (Jorgenson et al 1999, 2009). Both fire and permafrost are dominant agents in affecting successional processes (Chapin et al 2006). This diversity presents an enormous challenge to assessing regional trends in ecological changes after permafrost degradation.
Ground ice content in permafrost ranges widely, from negligible in weathered bedrock and eolian sand to occupying 80–90% of the top 30 m of permafrost in extremely ice-rich loess deposited during the Pleistocene (Kreig and Reger 1982, Kanevskiy et al 2011, 2013). Differential thawing of permafrost can lead to a large diversity of thermokarst terrain depending on surficial materials, ground ice morphology and volume (Jorgenson and Osterkamp 2005). Changing topography, hydrology and nutrient availability lead to positive feedbacks on soil temperature and permafrost stability related to albedo effects from water impoundment, or negative feedbacks from vegetation succession and organic matter accumulation that promote surface stabilization and permafrost recovery (Jorgenson et al 2006, 2010). The magnitude of the feedback on soil temperatures can be twice as large as air temperatures and as a result, most of the permafrost in boreal Alaska is considered ecosystem-driven permafrost (Shur and Jorgenson 2007). In boreal Alaska and Yukon, some permafrost has persisted through many interglacial periods over hundreds of thousands of years (Froese et al 2008).
Surface topography, water storage, and hydrologic flow paths are immediately altered by permafrost thaw. Thawing of permafrost in upland watersheds, even if ice contents are low, can lead to shifting surface water flow to deeper groundwater flow paths and result in changes in seasonal discharge patterns (Walvoord and Striegl 2007, Lyon and Destouni 2010, Koch et al 2013a) and biogeochemical processing and export of dissolved organic carbon (Striegl et al 2005, O'Donnell et al 2012a, Koch et al 2013b). In lowland regions, changes in permafrost can lead to changes in lake extent from lateral or subsurface drainage (Jones et al 2011, Yoshikawa and Hinzman 2003, Jepsen et al 2013). On slopes and lowlands, differential permafrost thaw can lead to fragmentation of integrated networks into fill and spill flow paths, caused by impoundment of water in thermokarst pits and bogs (Quinton et al 2009, Woo 2012).
Carbon accumulation and distribution in permafrost-affected soils depend on complicated interactions of climate, geomorphology, vegetation composition, microbial activity, and temperature and moisture as affected by permafrost (Robinson and Moore 1999, Turetsky et al 2007, Schuur et al 2008, Wickland et al 2010, Johnson et al 2011, Harden et al 2012b, Quillet et al 2013). Short-term flux studies have shown substantial fluctuations in annual carbon budgets in tundra and forest ecosystems and the high spatial and temporal variability in ground-based carbon budgets has led to substantial uncertainty as to whether these ecosystems are acting as long-term sources or sinks to the atmosphere (McGuire et al 2009). Fire contributes to this uncertainty by burning portions of the surface organic layers, depending on fire severity, and accelerating permafrost thaw (Harden et al 2006, 2012b, Hinzman et al 2003, O'Donnell et al 2009, 2011a).
To evaluate how the variations among vegetation, hydrology, soils, and permafrost affect changes in SOC, we: (1) classified and aggregated the ecological characteristics of diverse successional stages along chronosequences of boreal ecosystem development after disturbance from fire and permafrost thaw into broad soil landscapes; (2) compared permafrost characteristics across landscapes; (3) assessed changes in water storage and used the results to develop conceptual models of hydrologic reorganization caused by thawing; and (4) compared SOC stocks among successional stages and across landscapes. This field study was part of a broader effort to assess effects of permafrost degradation on landscape evolution (Shur et al 2012), land cover changes (Lu and Zhuang 2011), soil carbon dynamics (O'Donnell et al 2011b, 2011a, 2012c, Harden et al 2012a, 2012b), laboratory incubations and trace gas fluxes (Wickland et al 2010, Johnston et al 2012), water and aqueous carbon fluxes and permafrost hydrology (Koch et al 2013a, 2013b), and thermal and trace gas modeling (Jiang et al 2012, Tang and Zhuang 2011, Lu and Zhuang 2012).
2. Methods
The study was designed to assess changes in vegetation, hydrology, and soil after permafrost degradation across a range of soil landscapes and successional stages that dominate the boreal forest ecosystems in central Alaska. We stratified the landscapes into four soil landscapes that differentiated physiography and soil textures using the hierarchical ecological land classification approach of Jorgenson et al (1999, 2009). Soil landscapes from this hierarchical system were assigned to surficial geology classes mapped by Karlstrom (1964). We established study areas in each one of these landscapes in remote areas across the Interior (figures 1 and 2). Within each study area, we established a chronosequence of successional stages that varied with time since disturbance. We tried to establish at least three replicate plots (5 m radius) in each of the 3–6 successional stages at each study area, with each plot (site) located in a separate disturbance patch, but number of replicates varied depending on availability of successional stages (see supplemental materials table S1 available at stacks.iop.org/ERL/8/035017/mmedia). In upland areas, we used maps of historic fire perimeters to identify stands that varied with time since burn and thaw, and plots were widely distributed along the road system and not grouped along surveyed transects. For the Hess Creek (N65.79, W149.49) and Taylor Highway (N63.46, W142.49) upland study areas, chronosequences included a young (0–10 years, after 2003, 2004 fires), intermediate (10–40 years, after 1990, 1993 and 1986 fires), old (40–100 years, 1964 fire) and mature forests with permafrost as reference (burns > 100 years ago), while at Nome Creek (N65.35 W146.92) there were only young burns and old forests. In lowland areas, plots were established along surveyed transects so that ground- and water-surface elevations could be measured to assess effects of thermokarst. In gravelly–sandy lowlands at Twelve-Mile Lake (N66.45 W145.56), we had the unusual situation of recently drained lakes after permafrost thaw, so we grouped late-successional mixed and needleleaf forests into old forests, and grouped recently exposed lake sediments into recently drained margins (10–40 year old shrub communities), and herbaceous vegetation and barren areas in the lower centers (<10 years old) into recently drained centers. In peaty–silty lowlands, we used satellite imagery to identify regions of extensive thermokarst bog and fen development. For the Koyukuk (N65.19 W156.64) and Innoko Flats (N63.57 W157.73), we classified landforms and vegetation stages as young bogs (10–40 years), intermediate bogs (30–100 years), old bogs (300–1700 years), and old forest with permafrost (>100 years) as a reference. We also sampled dry margins on the permafrost plateaus to assess the effects of drying via lateral drainage of suprapermafrost groundwater.

Figure 1. Study sites in relation to surficial geology and major soil landscapes. Surficial materials are grouped into rock uplands (browns), silty uplands (yellow), gravelly–sandy lowlands (orange), and peaty–silty lowlands (greens). Other landscapes, such as riverine (red) and glaciated (blue), were not included in this study. Boundaries of permafrost zones (gray) are based on Jorgenson et al (2008). Study areas include Innoko (I), Koyukuk (K), Hess Creek (H), Nome Creek (N), Twelve-mile Lake (M), and Taylor Highway (T).
Download figure:
Standard image High-resolution image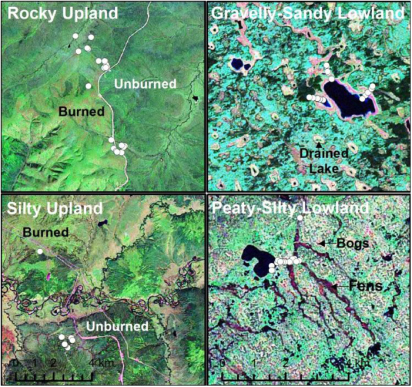
Figure 2. Landsat satellite images of the four soil landscapes showing: rocky uplands along Taylor Highway with stable surfaces subject to frequent fires; silty uplands near Hess Creek with mostly stable surfaces with occasional deep thermokarst lakes; gravelly–sandy lowlands on the Yukon Flats with widespread lake drainage associated with thawing permafrost; and peaty–silty lowlands on the Innoko Flats with widespread thermokarst. Sampling locations shown as white dots.
Download figure:
Standard image High-resolution imageField sampling at the six study areas was conducted during late summer over a five-year period. At each area, we sampled topography, hydrology, soil stratigraphy, and vegetation. For topography in lowland areas, we measured ground-surface elevations every 1–2 m along 300–500 m transects using an autolevel. Water-surface elevations and water-table depth (above/below ground surface) were measured where water was present, and thaw depths were measured with a metal probe at 1–2 m intervals on permafrost plateaus and at 5 m intervals in thermokarst bogs. In upland areas, where plots were widely scattered in differing fire patches, elevations were measured with a recreational grade GPS by averaging WAAS-differentially-corrected positions (∼2–5 m accuracy). For vegetation cover, we visually estimated the per cent cover of each vascular species and dominant nonvascular species within the 5 m (2 m for small pits) radius plots. Soil stratigraphy descriptions and soil sampling was done at one location at the center of the plot, using a variety of methods depending on soil conditions. For rocky soils, we used a shovel to excavate a 0.5–1 m deep pit in unfrozen soils and used a jack hammer to excavate to ∼1 m depth in frozen soils. In unfrozen loamy and peaty soils, we extracted 30 cm diameter soil plugs of surface soils with a shovel for subsampling with knives or small corers, and used coring tubes for deeper soils down to 2–3 m. For frozen fine-grained soils, we used a SIPRE (Snow, Ice, and Permafrost Research Establishment) corer (7.5 cm diam.) and cored to 3–5 m depths. Soil stratigraphy was described according to USDA field methods. Cryostructures were described according to French and Shur (2010). Peat types were differentiated by dominant plant macrofossils identifiable in the field with a hand lens. Volumetric soil samples were obtained at ∼20-cm-depth increments in the center of the profile, with additional targeted samples taken from thin, distinctive horizons. For age determinations, organic-rich soil samples were taken from most soil profiles at distinctive breaks in peat stratigraphy. In the field, determinations were made for wet weights, and soil pH and electrical conductivity (EC) were measured in thawed liquids or a saturated paste with a portable meter.
Soils were analyzed for a variety of physical, biological, and chemical properties. For soil moisture and bulk density, soils were oven dried at 60 ° C (organic) or 105 ° C (mineral). Total carbon and nitrogen contents were measured with a LECO CN analyzer. For acidic (pH < 6.8) soils, which were obtained from most sites, organic carbon was assumed to be equal to the total carbon values because of the lack of carbonates. For alkaline soils with carbonates, soils were acid fumigated before analysis for total carbon. Radiocarbon dating was done by accelerator mass spectrometry at UC Irvine or Lawrence Livermore National Laboratory and resulting 14C data are described in O'Donnell et al (2011a, 2012a, 2012b, 2012c) and Johnston et al (2012).
Data analysis involved: creating a relational database to link site, stratigraphy, physical, and chemical data; gap filling procedures to estimate properties for missing values; calculation of carbon densities for 1459 soil layers, and carbon and water stocks for 95 profiles (82 profiles >1 m, 64 >2 m); and data summaries by successional stage and soil landscape. We assigned soil properties to layers with missing data from: (1) layers above or below the layer if horizon designation and soil texture were the same (affecting 190 layers); or (2) mean characteristics calculated for 45 combinations of genetic horizons, simplified textures and peat types (affecting 339 layers). We also split and duplicated layers that crossed 1 m increments so data could be summarized by depth increments across all sites. To allow comparison of SOC across all sites, we extended deep layers (29 short for <0.5 m, 24 long for 1 m) in rocky soils assuming that similar properties for gravelly or channery materials continued at depth. SOC density for each layer and SOC stocks for each profile were calculated following methods by O'Donnell et al (2011a, 2012a, 2012b, 2012c). After summarizing soil and environmental characteristics by plot and using the plot as the sample unit, we tested for effects of successional stage on water storage and SOC stocks within soil landscapes using one-way analysis of variance (ANOVA) and considered overall effects significant if p < 0.05. Post hoc tests for comparing differences among means were done with the Tukey HSD test. Because of low sample sizes and concern for normality, medians also were tested with the nonparametric Kruskal–Wallis ANOVA to confirm results. Data are reported in O'Donnell et al (2012c, 2013).
3. Results and discussion
3.1. Landscape heterogeneity and vegetation
Field sampling encompassed a large diversity of boreal ecosystems due to differences in topography, surficial geology, hydrology, soils, permafrost, vegetation, and disturbance. The ecological classification of landscape components from 82 sites across six study areas (figure 1) resulted in 16 ecosystem types grouped within four soil landscapes: rocky uplands, silty uplands, gravelly–sandy lowlands and peaty–silty lowlands (figure 2; see also supplemental tables S1 and S2 available at stacks.iop.org/ERL/8/035017/mmedia). These ecotypes represent assemblages of co-varying vegetation–soil–permafrost conditions that are linked through disturbance regimes. Our six upland and ten lowland–lacustrine ecotypes were similar to those previously described for interior Alaska (Jorgenson et al 1999). The dominant ecological characteristics of each soil landscape are described below (for more detail see supplemental figure S1 and tables S3–S5 available at stacks.iop.org/ERL/8/035017/mmedia).
Rocky uplands were associated with residual soil and hillside colluvium, which cover 32% of the area in the boreal portion of the discontinuous permafrost zone (figure 1), although permafrost-affected terrain is probably about half to two-thirds of that area. Old forests had soils with thick (25–43 cm) organic horizons underlain by cryoturbated organic-mineral mixtures and permanently frozen rocky soils, and were somewhat poorly drained, saturated at depth, and extremely acidic (pH 3.3–4.6 at 10 cm). Vegetation was dominated by an open canopy of black spruce (Picea mariana), low willow (Salix planifolia), ericaceous shrubs (Ledum groenlandicum, Vaccinium uliginosum, V. vitis-idaea) and mosses (Hylocomium splendens, Pleurozium schreberi, Sphagnum fuscum). After fire, young burns were dominated by tall and low shrubs (S. glauca, Betula nana, Vaccinium uliginosum), forbs (Epilobium angustifolium), grasses (Calamagrostis spp.) and colonizing mosses (Ceratodon purpureus, Polytrichum juniperinum). Intermediate burns were similar to young burns, but with higher shrub and grass cover and minor cover of paper birch (Betula papyrifera). Old burns were similar to old forest, except they maintained higher shrub cover and lacked sphagnum.
Silty uplands were associated with eolian loess deposits, which cover ∼5% of the region, but are inadequately mapped. Old forests had soils with thick (25–33 cm) organic horizons underlain by cryoturbated organic-mineral mixtures and permanently frozen silty soils, and were somewhat poorly drained, saturated at depth, and circumneutral (pH 5.7–6.7). Vegetation was similar to that of rocky uplands, except tall alder (Alnus crispa), willows (S. bebbiana, S. arbusculoides) and feathermosses were more abundant and sphagnum was rare.
Gravelly-sandy lowlands were associated with eolian sands, which typically had a thin loess cap (10–150 cm) and were underlain by fluvial gravel at depths of 4–5 m; this landscape covers ∼4% of region. Old forests had soils with thin (7–16 cm) organic horizons underlain by permanently frozen sandy soils, and were well drained, lacked water in the active layer and alkaline (pH 8–8.6) at depth. Vegetation was dominated by white spruce (Picea glauca) and aspen (Populus tremuloides), tall willows (S. bebbiana, S. glauca S. scouleriana), low shrubs (Shepherdia canadensis), herbs (Geocaulon lividum, Festuca altaica) and mosses (H. splendens). Margins of the recently drained-lake basins were dominated by tall willows (S. bebbiana, S. alaxensis, S. hastata) and herbs (E. arvense, Solidago multiradiata, Aster spp.). Centers of the drained basins were partially vegetated with herbs (Chenopodium album, Erigeron acris), grasses (Beckmannia syzigachne, Agrostis scabra, Hordeum jubatum) and sedges (Carex saxatilis, Juncus spp.).
Peaty-silty lowlands in our study areas were associated with reworked lacustrine and eolian silt, although this landscape also includes retransported colluvium, fluvial abandoned/terrace, and glaciolacustrine deposits, which together cover ∼27% of the region. Old forests on permafrost plateaus had thick peat underlain by limnic sediments and cryoturbated organic-mineral mixtures and clean silt. Soils were somewhat poorly drained, saturated near the permafrost table, and extremely acidic (pH 2.8–4.1). Vegetation was dominated by an open canopy of black spruce (P. mariana), ericaceous shrubs, herbs (Rubus chamaemorus), sphagnum (S. fuscum), feathermosses and lichens (Cladina rangiferina, C. arbuscula). Willows and alder were notably absent. Young and intermediate bogs were dominated by sedges (Eriophorum russeolum) and sphagnum (S. riparium, S. jensnii, S. lindbergii, S. rubellum). Old bogs had dwarf ericaceous shrubs (Andromeda polifolia, Oxycoccus microcarpus), sedges (Carex rotundata, Eriophorum russeolum) and sphagnum (S. balticum, S. flexuosum, S. fuscum). Fens had forbs (Menyanthes trifoliata), sedges (E. russeolum, C. chordorrhiza, C. limosa, C. rotundata), sphagnum (S. fallax, S. papillosum) and brown mosses (Warnstorfia fluitans, Drepanocladus spp.).
Overall, there were large shifts in vegetation structure and composition after permafrost thaw and/or fire across all landscapes. In rocky and silty uplands, the shift was mainly in the structure and in the relative dominance of the species after fire, with most species being present at all successional stages and only a small number of species constrained to either young burns or old forests. In the gravelly-sand lowlands, the exposure of new sediments in drained-lake basins provided habitat for numerous early colonizing species not found in old forests. In peaty–silty lowlands, thermokarst bogs and fens provided new habitat for numerous species not found in old forests, although by the old bog stage nearly half its species also occurred in old forests. These changes in vegetation after disturbance are important to soil carbon dynamics because differences in species composition, plant growth rates, and tissue chemistry have the potential to affect aboveground biomass accumulation and soil decomposition rates (Turetsky 2004, Quillet et al 2013). Compositional shifts involving the peat mosses (Sphagnum) appear particularly important for facilitating permafrost formation in upland forests and altering decomposition dynamics of lowland vegetation.
3.2. Permafrost
In our study, all four landscapes had permafrost and unfrozen soils where permafrost had recently thawed, except silty uplands where all sites had retained permafrost even after fire. Permafrost characteristics ranged from ice-poor sands to ice-rich silts (figure 3). Moisture contents in permafrost varied two-fold among soil landscapes (figure 4(a)). Differences in ground ice volumes were associated with varying morphologies and permafrost histories described below.
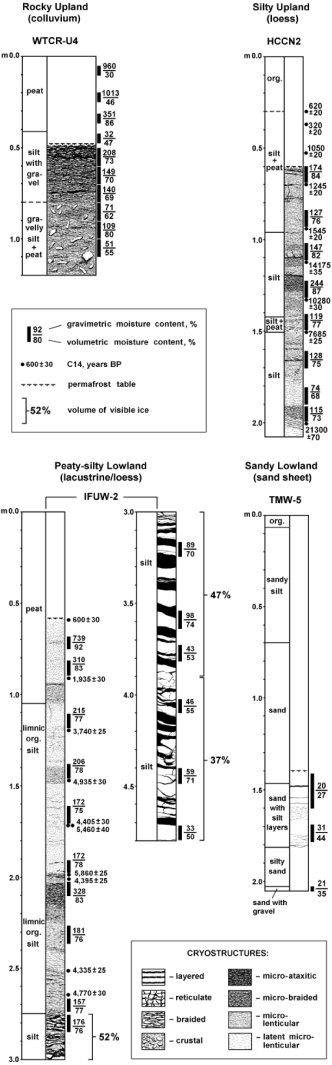
Figure 3. Representative profiles for permafrost-affected soils for four soil landscapes.
Download figure:
Standard image High-resolution image
Figure 4. Mean (±SD) soil moisture (a) for unfrozen and frozen soils (all successional stages combined) and water-table depths; (b) for undisturbed old forests and disturbed sites (post-fire) within rocky uplands (RU), silty uplands (SU), gravelly–sandy lowlands (GSL), and peaty–silty lowlands (PSL). Numbers represent sample size for individual samples for moisture and for sites for water table.
Download figure:
Standard image High-resolution imageIn rocky uplands, ground ice near the surface was characteristic of quasi-syngenetic permafrost (Shur 1988), which aggrades in response to thick moss accumulation and thinning of the active layer. Frozen soils were dominated by braided, lenticular and porphyritic cryostructures. Occurrence of buried charcoal fragments and subducted organic masses in turbated organic-mineral mixtures indicate that permafrost has undergone repeated episodes of degradation and aggradation, primarily associated with repeat fires during the late Holocene.
In silty uplands, permafrost ranged from ice-poor to extremely ice-rich and was dominated by pore ice, lenticular, micro-braided and micro-ataxitic cryostructures. The cryostructures indicated three types of permafrost, extremely ice-rich Pleistocene-age silt (yedoma) below 2–4 m, epigenetic ice-poor permafrost formed during downward freezing of previously thawed soil between 1.5 and 4 m, and quasi-syngenetic ice-rich permafrost formed during thinning of the active layer in response to ecological succession. Cryostructures and radiocarbon dating indicate the yedoma formed during the late Pleistocene and has undergone repeated deep (2–3 m) thawing episodes caused by fire, but the main body of yedoma has remained remarkably resilient. We interpret the yedoma in the Hess Creek region to be similar to the yedoma exposed at the Itkillik bluff in northern Alaska, which has large, deep syngenetic ice wedges that occupy 60–80% of the volume of the upper 30 m (Kanevskiy et al 2011). Loess deposits are widespread in Alaska (Muhs and Budahn 2006, Kanevskiy et al 2011), are not well mapped, and many areas have thin loess caps that are insufficient to map as loess but which still can affect soil processes.
The gravelly–sandy lowlands in the Yukon Flats were formed by alluvial gravel and sand covered by a wind-blown sand sheet near the end of the Pleistocene (Kennedy et al 2010). Due to the sandy material, the permafrost was ice-poor, dominated by pore ice and lenticular cryostructures with occasional thin lenses, and there was no topographic or stratigraphic evidence of thermokarst. The abundance of drained-lake basins formed in depressions in the undulating sand sheet, many of which now have recently exposed limnic sediments, makes this an unusual permafrost-affected landscape. Airborne electromagnetic resistivity in the region found permafrost surrounding the basins but absent under the lakes (Minsley et al 2012), and hydrologic analyses indicate permafrost degradation is likely contributing to the loss of water (Jepsen et al 2013).
In peaty–silty lowlands, permafrost was ice-rich and dominated by porphyritic cryostructure in organic soils, micro-braided or micro-lenticular cryostructures in intermediate horizons, and layered and reticulate cryostructures in the underlying silt. Cryostructures and radiocarbon dating indicate permafrost has had a complex history since the late Pleistocene that include initiation as extremely ice-rich syngenetic permafrost (yedoma), degradation in thaw lakes, reaggradation of permafrost after lake drainage, and renewed degradation during the last thousand years. A few profiles from permafrost plateaus had buried sedge–sphagnum bog peat, which indicates small thermokarst pits have formed and stabilized during the last few hundred years in isolated patches.
Permafrost occurrence and thaw depths after disturbance varied among soil landscapes. In rocky uplands, shallow (within 1 m) permafrost usually was present in old forests (7 of 7 sites frozen, plus 2 undetermined) and mostly absent in burned areas (2/12 frozen). In silty uplands, permafrost was always present before (4/4) and after fire (7/7), with mean thaw depths similar between old forests (55 ± 12.9 cm) and burned sites (61 ± 11.2 cm). In gravelly–sandy lowlands, permafrost was nearly always present in old forests (4/5) and nearly always absent in drained-lake basins (1/10). In peaty–silty lowlands, permafrost was always present (7/7) in old forests, while permafrost was infrequent (2/6) below shallow taliks (<3 m) in intermediate bogs, and always absent (6/6, observed depths 1.6–3.3 m) in old bogs. When comparing differences in mean thaw depths for old forests among landscapes, thaw depths were similar among rocky uplands (46 ± 10.4 cm), silty uplands (55 ± 12.9 cm) and peaty–silty lowlands (56 ± 8.3 cm), but much deeper in gravelly–sandy lowlands (138 ± 14.1 cm). Thus, all landscapes partly or completely lost permafrost after fire or lateral expansion of pond thaw bulbs, except silty uplands. We attribute the persistence of permafrost after fire in silty uplands to high moisture contents that affect thermal properties, slow thawing of ice-rich soil with high latent heat contents, and vegetation recovery at the surface.
Overall, permafrost history, as it affects ground ice characteristics, was a fundamental driver of ecological changes across all landscapes. In rocky uplands, permafrost thaws rapidly after fire due to low ice contents and highly permeable material, allowing vertical subsurface drainage, but the minor thaw settlement has little effect on surface topography. Cryoturbated soils with deeply subducted organic masses indicate that soils have undergone repeated episodes of thaw during the Holocene. In contrast, silty uplands with their extremely ice-rich permafrost formed during the late Pleistocene (Kanevskiy et al 2011), were resilient to fire, albeit with a deepening active layer and thawed zone, and soils stay saturated at depth. These landscapes have been found to be highly resilient even over large climatic fluctuations (Froese et al 2008), although increased fire severity or frequency may increase vulnerability of ice-rich silt to thaw (O'Donnell et al 2011b). While permafrost was persistent at our sampling sites, we did observe some surface polygonization, thermokarst mounds, and surface water channelization that provide evidence for larger erosional changes that can occur as this landscape evolves over the longer term. Gravelly-sandy lowlands have ice-poor soils that behave similar to rocky uplands, except the loss of permafrost around lakes allows subsurface drainage, which creates 'thaw sinks', a unique type of landscape change related to permafrost degradation (Jorgenson and Osterkamp 2005). In peaty–silty lowlands, the peatlands have complicated permafrost histories associated with yedoma degradation, and subsequent repeated episodes of epigenetic formation of ice-rich permafrost and degradation that creates highly patchy landscapes with permafrost plateaus and thermokarst bogs in differing stages of development. Thus, permafrost degradation happens at different rates: over decades in rocky uplands and gravelly–sandy lowlands in response to fire and water impoundments; over decades to centuries in peaty–silty lowlands where thaw is dominated by lateral heat fluxes at the margins of permafrost plateaus; and over centuries to millennia for extremely ice-rich silty uplands where high ice contents, soil thermal properties, and ecological recovery delays thawing. Over centuries of climate warming, however, silty uplands have the potential to undergo 20–30 m of collapse after thawing, which could result in flat, wet basins that provide good conditions for peat accumulation (Jones et al 2012). A critical component of this transformation will be the redistribution of silt from upland to lowland environments through both thaw slumping and fluvial transport of sediment.
3.3. Water
The hydrologic responses to thawing were very different among landscapes. Immediately upon thawing of the upper permafrost, surface hydrology is altered by changes in subsurface permeability and microtopography associated with thaw settlement. Mean moisture contents in permafrost soils were two- to four-fold higher than in unfrozen soils situated in the active layer or in soils where permafrost had thawed, due to accumulation of segregated ice (figure 4(a)). This frozen zone with high ice contents provides an impermeable barrier to subsurface drainage.
Water-table depths varied widely among upland and lowland landscapes after disturbance from fire, permafrost thaw, and drainage (figure 4(b)). In rocky uplands, mean water-table depths were near the bottom of the active layer (−40 cm) in old forests and increased to below the depths of our observations (∼1 m) at most sites following fire and permafrost thaw. Mean water storage (water-depth equivalent) for 0–2 m depths in old forests (0.7 m) were two-fold higher than in young to old burns (0.3–0.4 m) (figure 5). In silty uplands, mean water depths (−45.3 to −47.2 cm) and storage (1.2–1.3 m) were virtually the same before and after fire because soils remained near saturation due to underlying frozen silt. Gravelly-sandy lowlands had intermediate water depths (−60.8 cm) and low storage (0.5 m) in old forests with permafrost, compared to deeper water depths (−138.3 cm) and intermediate storage (0.7–1.1 m) in the unfrozen drained basins. At Twelve-Mile Lake, our time-series analysis of historical airphotos found that water levels had dropped ∼3 m from 1978 to 2007 and were ∼4 m below the former lake margin, a large unidirectional drop indicative of subsurface drainage. In peaty–silty lowlands, mean water depths were near the bottom of the active layer in old forests (−52.9 cm), but near the surface in young to old thermokarst bogs (−1.0 cm). In contrast, mean water storage was slightly higher in the old forests (1.3 m) compared to the young to old bogs (1.0–1.1 m) due to the high ice content in the permafrost. At Innoko and Koyukuk Flats, collapse of the thawed surface led to differences in water-table elevations in the plateaus and bogs that varied by 1.6 and 4.0 m, for the respective study areas. Soil moisture profiles from volumetric core samples reveal trends of increasing soil moisture with depth in the active layer and highly variable moisture at depth in frozen soils associated with varying cryostructure (for more detail see supplemental figure S2 available at stacks.iop.org/ERL/8/035017/mmedia). Overall, water depths, water storage and moisture profiles indicate loss of moisture to subsurface drainage after fire in rocky uplands and in gravelly–sandy lowlands after lake drainage, little moisture change after fire in silty uplands where permafrost is preserved, and increased moisture at the surface due to surface collapse and impoundment in peaty–silty lowlands.

Figure 5. Mean water storage by 0–1 and 0–2 m depths intervals for various successional stages (Yng= young, Int= intermediate, DL= drained lake) within four soil landscapes. SD bars are for combined 0–2 intervals and numbers are for sample sizes. Means with the same letter are not significantly different (p > 0.05), no contrast when overall ANOVA results not significant.
Download figure:
Standard image High-resolution imageBased on changes in topography, surface water and groundwater depths, and soil moisture contents, we developed conceptual models of how water storage and hydrologic flow paths are reorganized upon permafrost thaw for each landscape (figure 6). In rocky uplands, permafrost thaw results in loss of the permafrost aquitard and allows water to infiltrate rocky soils and drain to the groundwater system. Redirection of water into the groundwater system alters stream hydrology by lowering summer discharge during storm events and increasing winter discharge (Walvoord and Striegl 2007). In silty uplands, persistence of permafrost maintains saturated soils and flow paths dominated by surface and suprapermafrost flow. Observations of occasional sink holes on the upper slopes and seeps at the toe slopes indicates some water can drain off the surface through pipes formed in the active layer or thawed through the ice-wedge network (Koch et al 2013a, Carey and Woo 2002). The lack of water impoundment on the sloping surface reduces the positive feedback of warming associated with the heat gain in shallow water bodies (Jorgenson et al 2010) and facilitates permafrost resilience. Gravelly-sandy lowlands have a dramatically different response, in that permafrost loss has allowed widespread, recent drainage of lakes on the sand sheet on the Yukon Flats (Jepsen et al 2013), as well as near the Kobuk sand dunes. Initially, surface water is impounded on the undulating sand sheet by permafrost that aggraded before the ponds formed or by permafrost that formed an impermeable curtain around the lakes. With climate warming or large fires, the permafrost table lowers, or pipes develop through the permafrost, allowing the lakes to drain slowly. This exposes organic-rich limnic sediments to aerobic decomposition, depending on lake-level lowering in relation to the elevation of the regional water table. Our observations of dead standing trees and buried terrestrial sedge peat suggest that previous episodes of impoundment and drainage have occurred in relation to permafrost dynamics. Finally, in peaty–silty lowlands, minor perturbations of the active layer from fire or climate warming lead to differential thaw settlement, fragmented drainage patterns, impoundment of water in isolated pits and bogs, and change in soil conditions from somewhat well-drained peat with a thick aerobic layer at the surface to permanently saturated soils near the surface. Over centuries, these depressions evolve from isolated depressions to bogs and lakes, and ultimately to connected fen systems, where the water level is controlled by the elevations of the outlet gaps. Subsurface drainage through the underlying compacted silt is negligible. Further expansion of bogs leads to integrated surface and subsurface connections and development of linear fen systems with surface water movement (Jorgenson et al 2001, Quinton et al 2009). While hydrologic reorganization can be dramatic at local and landscape scales, they have only a small effect on regional stream hydrology that involves a shift towards increasing base flow discharge during winter (Walvoord and Striegl 2007).

Figure 6. Topographic profiles illustrating relationships among topography, hydrology, soils, permafrost and vegetation within four boreal landscapes.
Download figure:
Standard image High-resolution image3.4. Soil carbon
SOC stocks for the top 2 m varied ten-fold across all sites, from a young burn in rocky uplands (9.7 kg m−2) to an old forest in a peaty–silty lowlands (108.8 kg m−2). When comparing differences among landscapes for only undisturbed old forests, mean SOC in rocky uplands, silty uplands, and gravelly–sandy lowlands were remarkably similar (28.9–30.5 m kg m−2), in contrast to much higher and variable stocks in peaty–silty lowlands (91.4 kg m−2) (figure 7). Below we compare SOC in the top 2 m, which allows comparisons within a consistent depth, and then for various soil materials (texture and/or peat types) among successional stages within each landscape to evaluate changes in surface and deep soil materials over time.
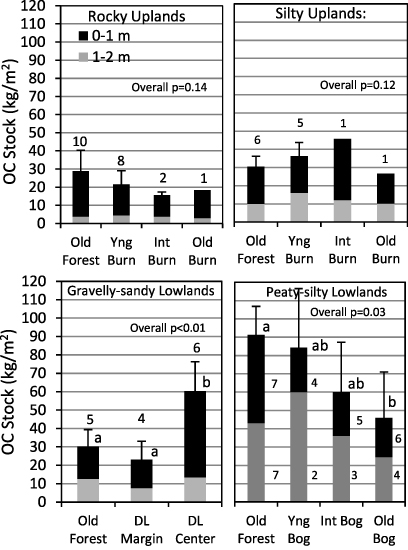
Figure 7. Mean soil organic carbon stocks by 0–1 and 0–2 m depths intervals for various successional stages (Yng= young, Int= intermediate, DL= drained lake) within four soil landscapes. SD bars are for combined 0–2 intervals and numbers are for sample sizes. Means with the same letter are not significantly different (p > 0.05), no contrast when overall ANOVA results not significant.
Download figure:
Standard image High-resolution imageWhen comparing mean SOC in the top 2 m among successional stages within soil landscapes, the landscapes had very different patterns in relation to disturbance associated with permafrost thaw and/or fire (figure 7). For rocky uplands, SOC in old forests with permafrost (28.9 kg m−2) was nearly 50% higher than in young to old burns without permafrost (15.6–21.8 kg m−2), and when all burn stages were combined (20.3 kg m−2) the difference with old forests was significant (p = 0.05). For silty uplands, SOC in old forests with permafrost (30.5 kg m−2) was similar to that of young to old burns (26.6–45.8 kg m−2) where permafrost was still present at depth, and when burn stages were combined (36.2 kg m−2) the difference with old forests was not significant (p = 0.99). For sandy lowlands, where permafrost thaw has caused widespread draining of lakes, SOC of sandy soils in old forests (30.2 kg m−2) was similar to upland soils, but there was large SOC in the recently exposed limnic sediments in the center of the drained lakes (62.6. kg m−2) and smaller SOC along the sandy margins (21.1 kg m−2). For peaty–silty lowlands (Innoko and Koyukuk combined), SOC in old forests (91.4 kg m−2) was two-fold higher than in young to old thermokarst bogs (44.6–57.1 kg m−2) and the differences in SOC were significant (p = 0.03), primarily due to the accumulation of lower density sphagnum peat at the surface in the bogs.
When comparing differences in mean SOC stocks for various soil materials among successional stages within landscapes, again there were large differences in patterns among landscapes (figure 8). In rocky uplands before disturbance, 32% of mean SOC in the top 2 m was in surface organics (9.5 kg m−2), 50% in turbated organic-mineral horizons (14.4 kg m−2) indicative of a history of repeated permafrost thaw, and 17% in underlying rocky colluvium (7.6 kg m−2) (figure 8). The active layer had 51% of the mean SOC. For surface organic horizons (moss, Oi, Oe, Oa), mean SOC was significantly two-fold higher in old forests (9.5 ± 5.5 kg m−2) compared to burns combined (4.0 ± 0.9 kg m−2). For organic-mineral horizons, mean SOC was significantly three-fold higher in old forests (14.4 ± 9.8 kg m−2) compared to burns combined (5.2 ± 8.1 kg m−2). We attribute the change of SOC in the surface organics to fire combustion, but the differences in SOC in organic-mineral horizons were more likely due to sampling variability rather than decomposition, because 8 of the 11 burned sites were too young to have much deep decomposition.
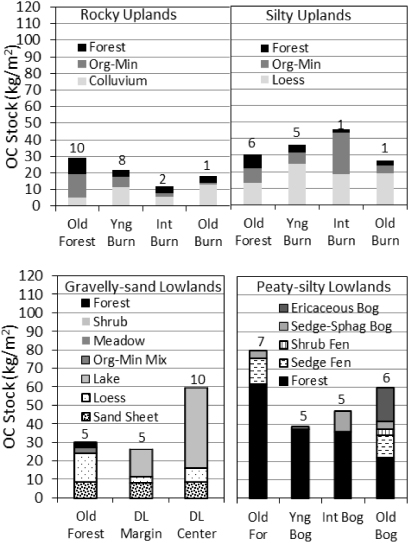
Figure 8. Mean soil organic carbon stocks by soil material for various successional stages (Yng =young, Int =intermediate, DL =drained lake) within four soil landscapes. Totals are for 0–2 m interval, except peaty–silty lowlands, which are for soils of variable depth above a common limnic horizon created after thaw-lake drainage. Patterns represent soil materials of differing origin. Organic materials were differentiated as woody forest or shrub peat, graminoid peat from meadows, fen and bog peat dominated by various lifeforms, and limnic material formed in lakes. Mineral soils were differentiated by geomorphic deposit. Org-Min layers represent turbated mixtures caused by thermokarst. Numbers represent sample sizes.
Download figure:
Standard image High-resolution imageWithin silty uplands, 28% of mean SOC in the top 2 m was in surface organics (8.6 kg m−2), 29% in turbated organic-mineral horizons (8.7 kg m−2), and 43% in underlying silty loess (13.2 kg m−2) in old forests. The active layer had 56% of the mean SOC. When comparing surface organics among successional stages, mean SOC was significantly two-fold higher in old forests (8.6 ± 2.8 kg m−2) compared to burns combined (4.0 ± 1.8 kg m−2), where 5 of 7 sites were young burns. We attribute the change in surface organics to fire combustion. For turbated organic-mineral horizons, mean SOC was similar in old forests (8.7.4 ± 6.7 kg m−2) compared to burns (9.2 ± 8.9 kg m−2).
Within sandy lowlands, the old forests had distinctly different soil materials from the recently drained basins. In old forests, 10% of mean SOC in the top 2 m was in surface organics (2.9 kg m−2), 10% in organic-mineral soils (2.9 kg m−2), 51% in silty loess (15.6 kg m−2) and 29% the underlying sands (8.8 kg m−2). In contrast, most of the SOC in the drained basins was in limnic sediments, with the centers (43.3 kg m−2) having much higher SOC than the margins (14.7 kg m−2). We did not sample recent burns in this landscape.
Within peaty–silty lowlands, the peat had complicated stratigraphy, indicating a rich history of repeated episodes of permafrost thaw, bog succession and permafrost recovery associated with evolution of thaw-lake plains in the Koyukuk and Innoko Flats. The soils reflected a general successional trend that included: reworked silt and mixed organic-mineral sediments from the initial collapse of yedoma; limnic sediments deposited in the deep water of thaw lakes; followed by herb marsh, sedge fen, shrub and forest peat formed during paludification and permafrost aggradation; and finally to sedge–sphagnum bog and ericaceous bog peat associated with recent thermokarst. In this landscape, where our coring obtained a maximum depth of 5.2 m, we were most interested in organics that have accumulated since drainage of the thaw lakes, as marked by a limnic horizon that served as a subsurface datum for assessing the effects of recent thermokarst on SOC. In old forests with permafrost, 71% of mean SOC was in sphagnum and woody peat (61.5 kg m−2) associated with forests, 16% in sedge fen peat (14.0 kg m−2) mostly formed below the forest peat, and 5% in sedge–sphagnum peat (4.4 kg m−2) indicative of previous episodes of thermokarst in some profiles. When comparing successional stages, mean SOC (all peat types combined) was highest in the old forest on the permafrost plateaus (86.9 kg m−2), lowest in young (38.7 kg m−2) bogs, intermediate in intermediate bogs (47.3 kg m−2) soon after collapse, followed by increasing SOC in old bogs (59.6 kg m−2). Differences in SOC, however, were not significant (p = 0.17) due to high variability. When examining the accumulation of new bog peat formed after collapse, SOC was low in young (1.5 kg m−2) and intermediate bogs (2.7 kg m−2), followed by a significant (p < 0.01) increase in old bogs (38.1 kg m−2). SOC in our deepest (4.0–5.2 m) cores in old forests, including underlying limnic and rework loess soil, ranged from 152 to 228 kg m−2.
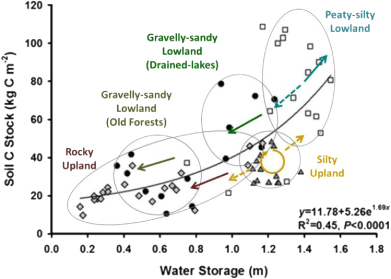
SOC for the top 2 m was strongly (p < 0.0001) related to total water storage across all sites (figure 9). There was strong clustering by landscape, with rocky uplands having lower water storage and SOC, silty uplands with intermediate values, and peaty–silty lowlands with high water storage and SOC. In gravelly–sandy lowlands, values clustered in two groups associated with old forests and drained-lake basins. SOC variability increased with increasing water storage, particularly for peaty–silty lowlands, where we attribute the large range in SOC to the low bulk density of peat in thermokarst bogs compared to the more compact peat in the old forests.
Figure 9. Exponential relationship between soil organic stock and water storage for the top 0–2 m for all soil profiles (n = 64) across four soil landscapes. Arrows represent likely directions in carbon stocks as water regimes change after permafrost thaw; dashed lines indicate greater long-term uncertainty.
Download figure:
Standard image High-resolution image
Overall, large changes in vegetation and water after permafrost degradation and/or fire were affected by very different processes among the soil landscapes, and that SOC also responds in divergent patterns (figure 9). In rocky and silty uplands, there were significant small decreases (4.6–5.5 kg m−2) in SOC in the surface organics after fire, but we were not able to detect changes during later successional stages due inability to access old burns to sample. In both uplands, the turbated organic-mineral layers at depth indicated that substantial carbon has persisted through previous thaw cycles. The quasi-syngenetic aggradation of permafrost associated with ecosystem-driven permafrost (Shur and Jorgenson 2007), allows SOC accumulated in the active layer to slowly become incorporated into frozen mineral–soil horizons, which reduces losses via decomposition (O'Donnell et al 2011a). In both uplands, fires will likely remain a dominant control in plant succession, primary productivity, and soil carbon dynamics (Chapin et al 2006). In rocky uplands, however, loss of permafrost after fire leads to drier aerobic soils that are conducive to long-term SOC loss, and permafrost may not be able to reestablish with a warming climate. In contrast, resilience of permafrost and maintenance of saturated soils in the silty uplands in the near term should lead to cyclical changes in SOC after fire. Over a longer term, permafrost degradation of ice-rich silty uplands should lead to SOC responses that are more divergent between wetting thermokarst depressions and drying remnant mounds and hills.
Lowlands had very different patterns. Gravelly-sandy landscapes had the unusual process of lake drainage that exposed large SOC stocks to aerobic conditions, although the areal extent of this terrain is small. In the surrounding old forests, SOC will likely respond similarly to rocky uplands after permafrost loss under a warming climate. In peaty–silty lowlands, permafrost collapse and colonization by early successional hydrophilic sphagnum species under extremely acidic conditions creates conditions for significant new accumulation of bog peat and increased methane emissions (Johnston et al 2012). Peaty-silty lowlands in our region, as well as in Canada (Robinson and Moore 1999, Turetsky 2004), have accumulated large SOC stocks through repeated thawing episodes over the Holocene. While we found a significant increase in new bog peat, the magnitude of decomposition of old peat after thaw remains uncertain. In our study areas on the Koyukuk and Innoko Flats, as well as the Tanana Flats (Jorgenson et al 2001), nearly half or more of the permafrost has already degraded during the last 1000 years. Thus, much of the change has already occurred, diminishing the implications of future permafrost thaw on decomposition of old carbon once frozen in permafrost in boreal regions. Assessment of the overall fate of SOC associated with permafrost dynamics in boreal regions given these divergent patterns will continue to be a challenge with additional changes associated with potential increased fire severity and long-term landscape evolution through physical erosion in uplands and expanding flow networks in lowlands.
4. Conclusion
Using a chronosequence approach to assessing changes over time, we found the response of vegetation, water and soil organic carbon to permafrost degradation and/or fire differed across successional stages within rocky uplands, silty uplands, gravelly–sandy lowlands, and peaty–silty landscapes that comprise much of boreal Alaska. We found large changes in vegetation composition and hydrologic patterns, and small significant changes in carbon in surface organic soils after disturbance, but we were unable to detect changes in deeper carbon due to high variability. Permafrost degradation occurred at different rates: over decades in rocky uplands and gravelly–sandy lowlands in response to fire and water impoundments correspondingly, over decades to centuries in peaty–silty lowlands with a legacy of complicated Holocene changes, and over centuries to millennia for extremely ice-rich silty uplands where soil properties and ecological recovery delays thawing. Our soils evidence indicates permafrost has been degrading and reforming throughout the Holocene in all landscapes, but in silty uplands degradation has been limited to the upper permafrost, although the extremely high ice content makes this landscape vulnerable to large-scale transformations. The highly patchy disturbance dynamics, divergent ecological recovery patterns over differing timescales, and substantial permafrost loss that has already occurred during the last millennium, may combine to moderate overall changes in soil carbon stocks and trace gas emissions over broader boreal regions.
Acknowledgments
Funding was provided by NSF (EAR 0630319) and USGS with logistical support by FWS. We thank Trish Miller, Kate Beatty and Mark Winterstein of ABR, and Pedro Rodriguez for help with field sampling. Olga Afonina and Mikhail Zhurbenko identified moss and lichen voucher specimens. Additional thanks to Karin Bodony, FWS and Jim Webster, Webster Flying Service, for logistical support. Comments from two anonymous reviewers were very helpful.