

Abstract
Alaska has diverse boreal ecosystems across heterogeneous landscapes driven by a wide range of biological and geomorphic processes associated with disturbance and successional patterns under a changing climate. To assess historical patterns and rates of change, we quantified the areal extent of ecotypes and the biophysical factors driving change through photo-interpretation of 2200 points on a time-series (∼1949, ∼1978, ∼2007, ∼2017) of geo-rectified imagery for 22 grids across central Alaska. Overall, 68.6% of the area had changes in ecotypes over ∼68 years. Most of the change resulted from increases in upland and lowland forest types, with an accompanying decrease in upland and lowland scrub types, as post-fire succession led to mid- and late-successional stages. Of 17 drivers of landscape change, fire was by far the largest, affecting 46.5% of the region overall from 1949 to 2017. Fire was notably more extensive in the early 1900s. Thermokarst nearly doubled from 3.9% in 1949 to 6.3% in 2017. Riverine ecotypes covered 7.8% area and showed dynamic changes related to channel migration and succession. Using past rates of ecotype transitions, we developed four state-transition models to project future ecotype extent based on historical rates, increasing temperatures, and driver associations. Ecotype changes from 2017 to 2100, nearly tripled for the driver-adjusted RCP6.0 temperature model (30.6%) compared to the historical rate model (11.5%), and the RCP4.5 (12.4%) and RCP8.0 (14.7%) temperature models. The historical-rate model projected 38 ecotypes will gain area and 24 will lose area by 2100. Overall, disturbance and recovery associated with a wide range of drivers across the patchy mosaic of differing aged ecotypes led to a fairly stable overall composition of most ecotypes over long intervals, although fire caused large temporal fluctuations for many ecotypes. Thermokarst, however, is accelerating and projected to have increasingly transformative effects on future ecotype distributions.
Export citation and abstract BibTeX RIS
1. Introduction
Over large regions, ecosystems are highly diverse owing to environmental gradients and disturbance regimes and respond differently to climate warming. In the boreal biome a wide range of atmospheric, hydrologic, geomorphic, fire-related, biotic, and anthropogenic drivers can affect ecological patterns and processes that raise concern for ecosystem management, subsistence resources, and global change [1–4].
Factors affecting ecological responses to climate change in boreal ecosystems with discontinuous permafrost are being assessed on many fronts. Warming temperatures have led to changing water balance [5] and surface and subsurface hydrology [6]. Permafrost degradation has increased [7, 8], which radically reorganizes hydrologic flow paths, soil processes, and vegetation [9, 10]. Compositional shifts or biomass changes in vegetation are occurring through warming temperatures [11], nutrient cycling and competitive interactions among plant species [12], snow cover change [13], and herbivory [14]. Increasing fire frequency and severity associated with climate warming and human activity may lead to shifts in forest composition and distribution [15–18] and permafrost degradation [19–22]. Forest and shrub migration into new areas, altitudinal increases in treeline, and dominance shifts within plant communities have altered canopy dominance and understory composition [23–25]. Insect outbreaks, particularly the spruce bark beetle, have killed spruce trees in large areas in Alaska [26]. River erosion claims late-successional ecosystems, and deposition builds up riverbars for primary succession [27–29]. Lakes have increased through shore erosion and decreased from drainage associated with permafrost degradation [30, 31], and evaporative loss and paludification [32]. Glacier melting has exposed new barren alpine areas [33] and affected the hydrology of glacier-fed river systems [34, 35]. Increasing human populations and industrial activities also contribute to environmental changes [36, 37]. Collectively, these drivers contribute to a diverse mosaic of early to late-successional ecosystems where change can occur abruptly (pulse) through disturbance events or gradually (press) through successional processes or chronic stressors [1, 38].
In this study, we used photo-interpretation and systematic grid-point sampling of ecological change on high-resolution imagery as the best approach to extend the historical record to the earliest airphotos, identify meter-scale changes, characterize vegetation changes across successional stages, and differentiate thermokarst features and fire history using pattern and landscape context. Fire, thermokarst, and riverine dynamics have long been recognized as major drivers of boreal ecosystems [38], and automated remote sensing techniques have been developed to quantify temporal changes from fire [39, 40], permafrost and thermokarst extent [41, 42] and river floodplains [43]. Expert image interpretation for terrain analysis, however, remains the most reliable approach for multi-component assessment of landform-soil-vegetation-permafrost characteristics, especially civil engineering applications [44, 45].
We used state-transition modeling to project future changes because it can incorporate numerous drivers affecting a wide diversity of ecotypes [46]. In comparison, wildfire models are well developed to incorporate fire weather, fuel loads, ignition probabilities for short-term forecasting [47, 48], while long-term projections of fire effects rely on successional assumptions of varying quantitative rigor [49]. Thermal and statistical modeling of permafrost degradation are well developed [50, 51], but lack effects of groundwater and lateral thawing that drive most thermokarst in boreal regions [52]. Climate-envelope models have been used to project changes in both species [53] and biomes [54] in response to changing temperature and precipitation, but they lack disturbance regimes that drive most change in boreal ecosystems [1].
To assess historical patterns and rates of landscape change in central Alaska and project future changes to 2100, we used a time-series of historical airphotos and recent satellite images to quantify changes in local-scale ecosystems (ecotypes) through photo-interpretation of points distributed across central Alaska. We then used past ecotype transition rates in state-transition models to project future changes in response to climate change and geomorphic and ecological drivers of change. Specific objectives were to: (a) photo-interpret ecosystem type, permafrost status, and drivers of change using georectified imagery from ∼1949, ∼1978, ∼2007, to ∼2017; (b) quantify past rates of ecotype change and identify their ecological drivers; (c) analyze air temperature trends; and (d) develop four state-transitions models to project future changes from 2017 to 2100 based on fixed historical rates, increasing summer temperatures, and ecotype-driver associations.
2. Methods
The study was designed to quantify ecotype changes across central Alaska, focusing on three military training areas (6575 km2) in support of Department of Defense's concerns regarding impacts of climate change on natural resources and training activities (figure 1). The sampling used a photo-interpretated, grid-point sampling technique similar to previous studies [3, 55]. Twenty grids were randomly located, and two grids were added to target underrepresented riverine and alpine landscapes. For each grid (1.8 × 1.8 km), 100 points were established at 200 m spacing. High-resolution airphotos and satellite images were acquired and georectified for each grid for four time periods, 1949–1952 (median year 1949), 1978–1980 (1978), 2006–2011 (2007), and 2013–2020 (2017) to quantify change for three time-intervals 1949–1978 (29 years), 1978–2007 (29 years), and 2007–2017 (ten years). See Detailed Methods in supplemental information for more detail (available online at stacks.iop.org/ERL/17/045016/mmedia).

Figure 1. Sampling grids (yellow with grid ID) used for assessing landscape change within military lands (black boundaries) in boreal central Alaska. Fire scars on ca. 2000 Landsat mosaic appear red.
Download figure:
Standard image High-resolution imageChange detection at each point involved photo-interpreting multiple terrain characteristics mostly using established classifications (table SI1). We developed a new ecological land classification (table SI2) that better integrated the classifications for Fort Wainwright [56], Fort Greely [57], and northwest Alaska [58]. For assigning biophysical drivers to ecotype changes, we used a system for arctic and boreal Alaska [3]. To assign fire age, we used the fire history perimeters of the Alaska Interagency Coordination Center (AICC, http://afsmaps.blm.gov/imf/imf.jsp?site=firehistory). Within fire perimeters, we used photo-interpretation to determine burning at finer scales and repeat fires that occurred during different intervals were noted. For fires before 1949, we used vegetation successional status and changes in fire scars between image dates to roughly estimate fire years for late-successional mixed and needleleaf forest (∼1850), mid-successional broadleaf forest (∼1900), or early successional scrub (∼1930). Annotated images with effects of fire and thermokarst are provided in figures SI1 and SI2. To analyze change, we cross-tabulated ecotypes by time-interval, change driver, and landscape. We also aggregated the points by grid (sample unit) to assess spatial variability and test for significant differences (P < 0.05) among intervals using a repeated-measures analysis of variance (ANOVA). To assess accuracy of the photo-interpretation, we collected ground information for 128 sites at 10 grids in 2012 and produced a contingency table of 2012 ecotype field determinations versus 2017 photo-interpreted classes.
Transitions from one ecotype to another were developed for each ecotype, and we assigned a biophysical driver to each change type (table SI3). Transition probabilities for each possible state change over the three intervals were first calculated to estimate the fraction of each ecotype that transitioned from the original ecotype normalized to the interval years. For the no-change transition probability (NTProb, sampling without replacement), we used the formula:

where yrs is the length of the interval. For the partial transition probabilities (TProb), we used:
We averaged the transition probabilities across the intervals and adjusted the value for the no-transition probabilities so that all partial transition probabilities related to a given ecotype added to 1. For transitions with few data, we used rates from other similar transitions within our database or from other studies [3].
Climate trends were analyzed using air temperatures (thawing and freezing degree-days, base 0 °C, i.e. TDD and FDD respectively) for Fairbanks and Big Delta obtained from the Western Regional Climate Center (www.wrcc.dri.edu/summary/Climsmak.html). For future projections, we compiled data for decadal downscaled climate projections for 2010–2100 from the Scenario Network for Alaska Planning (https://uaf-snap.org/get-data/) based on the Representative Concentration Pathways 4.5 (low), 6.0 (middle), 8.5 (high) according to the IPCC AR5 Synthesis Report (2014). We used the projected decadal averages for each month to calculate seasonal TDD (monthly average × days in each month).
State-transition modeling of future changes for four intervals (2017–2040, 2040–2060, 2060–2080 and 2080–2100) were calculated for a historical-rate model, RCP 4.5 and RCP 8.5 increasing-temperature models, and a driver-adjusted RCP6.5 temperature model, which adjusted change rates based on perceived sensitivity of the drivers to climate warming. The historical-rate model assumes that future ecotype transitions occur at the same rate as during 1949–2017. The temperature models increased transition probabilities for each interval as a function temperature increases, assuming that warm-season temperature (TDD) is the primary driver of all transitions. We used transition-rate increases of 1.05, 1.09, 1.12, and 1.13× in TDD for the RCP4.5 temperature model, 1.04, 1.08, 1.15, and 1.17× for the RCP6.0 model, and 1.05, 1.15, 1.22, and 1.30× for the RCP8.0 model for the four respective time-intervals based on the SNAP projections, using 2010–2019 as the baseline for the fractional increases. In the driver-adjusted RCP6.0 model, transition probabilities were calculated the same as for the temperature model, with the addition of a rate-adjustment factor used to scale changes perceived to be affected by the various drivers (table SI4). For example, drivers will variously be unaffected by temperature (e.g. human disturbance), change in rough proportion to temperature increases (e.g. post-fire succession), or likely to accelerate change due to strong positive feedbacks (e.g. thermokarst). Changes in area for each ecotype and time-interval were calculated as absolute percent change (proportion of total study area) and relative percent change (proportion of initial ecotype area). Cumulative net change in area was calculated as the sum of all positive changes in area.
3. Results
3.1. Historical ecotype changes
Photointerpretation of ecotypes on high-resolution imagery at 2200 points across 22 grids from four periods (median years 1949, 1978, 2007, 2017) documented changes in 61 ecotypes responding to 17 drivers across the 6575 km2 study area. Photos of different landscape types with diverse ecotypes are provided in figure SI3 and an example of changes in a lowland grid is provided in figure 2. Overall, 68.6% of the region exhibited ecotype changes over the 68-year interval. When comparing the 1949–1978 (29 years), 1978–2007 (29 years), and 2007–2017 (ten years) intervals, ecotype changes occurred over 49.6%, 42.4%, and 24.8% of the area, respectively.
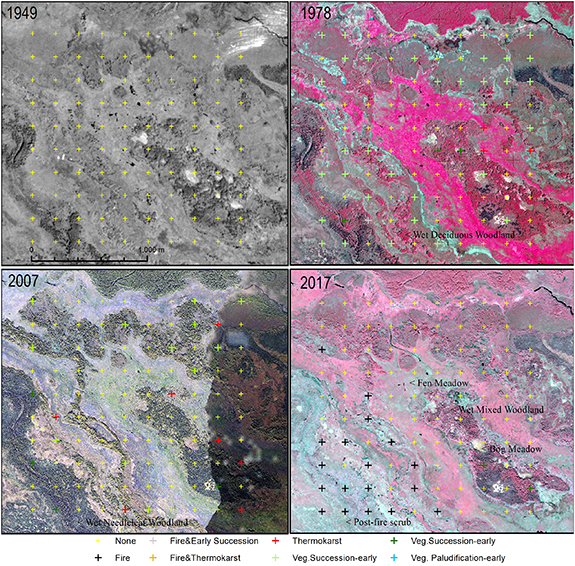
Figure 2. An example of a time-series of imagery for a lowland grid (#10, figure 1) on the Tanana Flats from 1949, 1978, 2007, to 2017 used for quantifying ecotype changes. Crosshairs are sampling points used for photo-interpretation and are color-coded to indicate change driver associated with changes. Dominant lowland ecotypes are highlighted on imagery.
Download figure:
Standard image High-resolution imageWhen comparing ecotype areas over the entire 1949–2017 interval, gains predominantly occurred in Lowland Wet Low Scrub (11.0% of total area) that had recovered after extensive fires before 1949, with lesser gains in Lowland Bog Tussock Scrub (1.4%), Lowland Wet Tall Scrub (1.4%), Lowland Wet Broadleaf Woodland (1.4%), Lowland Wet Mixed Woodland (1.3%), Upland Dry Mixed Woodland (1.3%), and Riverine Moist Needleleaf Forest (1%) (figures 3 and 4). Note the largest absolute changes typically are associated with ecotypes having largest areal extent. Areal decreases were dominated by Lowland Post-fire Scrub (−20.0%; only for initial transition after fire, otherwise it transitions to Lowland Wet Low Scrub next interval if still scrub), with smaller losses for Upland Post-fire Scrub (−3.1%), Upland Moist Broadleaf Forest (−1.7%), Alpine Post-fire Scrub (−1.4%), and Riverine Moist Mixed Forest (−0.7%). However, significant changes (P < 0.05, repeated measures ANOVA were found only for Lowland Fen Meadow (1.2%), Lowland Human-modified Scrub (0.2%), Lowland Wet Low Scrub, Lowland Post-fire Scrub, Lowland Wet Tall Scrub, and Lowland Wet Mixed Woodland, with marginally significant changes for Lowland Bog Meadow (1.2%, P = 0.06).
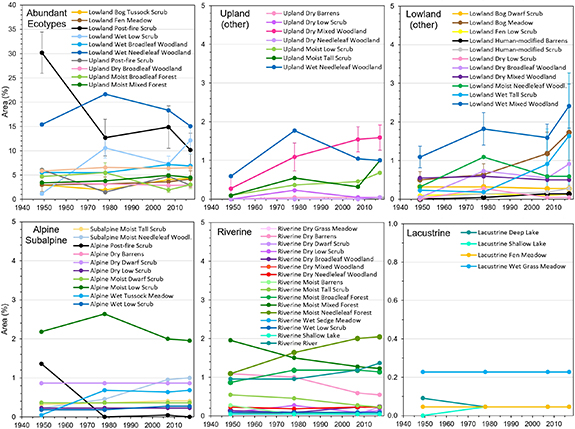
Figure 3. Mean changes (n = 22 grids) in area (%) of 61 ecotypes from 1949 to 2017 (median years for periods) grouped by landscape, except for abundant ecotypes that had higher areal coverage. Bars are 95% confidence intervals, shown only for seven ecotypes that showed significant trends (P < 0.05).
Download figure:
Standard image High-resolution image
Figure 4. Mean (n = 22 grids, ±95% CI) areal extent (left) and annual rates of change (right) affected by 17 drivers (plus 4 combinations) of ecotype changes for three time-intervals. Note difference in scales for fire-related drivers (upper) and other drivers (lower).
Download figure:
Standard image High-resolution imageWe identified 128 ecotype transitions (as well as 61 no-change possibilities) over the three time-intervals (figure SI4). Lowland and upland post-fire scrub ecotypes had by far the most transitions (9 and 15, respectively), while 10 ecotypes had 5–7 transitions, and 29 had 2–4 transitions. Eighteen ecotypes did not show evident change over 68 years. When comparing landscapes, lowland (74) ecotypes had the most transition types, riverine (47) and uplands (47) had intermediate numbers of transitions, while alpine (14), lacustrine (5), and subalpine (2) had few transitions. During model development, the number of ecotype transitions was increased to 269 to include other transitions not observed in our sampling, but were likely to occur or have been observed in other studies.
The overall photo-interpretation accuracy was 77% based on 127 ground-truth sites at 10 grids in 2012 for 17 ecotypes in comparison to photo-interpretations made using 2017 imagery (table SI5). Overall, the main problems were distinguishing canopy coverage among broadleaf, mixed, and needleleaf forests, and frequent scrub calls when tree cover was low.
3.2. Drivers of change
Ecotype changes were attributed to 17 drivers (plus 4 combinations when both happened within an interval) associated with ecological, geomorphic, and anthropogenic processes (figure 4, see figure SI5 for illustrative photographs). Total area affected by most drivers fluctuated substantially, due in part to varying interval lengths, but examination of annual rates (% of absolute area yr−1) better differentiates trends (figure 4). Fire-driven changes were slightly higher during the last interval (0.9% yr−1) compared with previous intervals (0.5%–0.7% yr−1), but not significantly. Annual rates of post-fire early succession (0.4%–1.6% yr−1) were highly variable among intervals depending on fire occurrence. Thermokarst accelerated significantly, increasing ten-fold from the early (0.01% yr−1) to last intervals (0.13% yr−1). River erosion (0.01%–0.05% yr−1) and deposition (0.005%–0.03% yr−1) showed five-fold increases during the last interval compared with earlier intervals, but both early (0.03%–0.04% yr−1) and late (0.02%–0.03% yr−1) riverine vegetation succession showed only minor variation among intervals. Human clearings had a two-fold increase during the final interval, trails remained steady, and fill (mostly roads) primarily developed during the middle interval.
Fire was by far the dominant driver of ecotype changes from the grid sampling, affecting 72.1% of the area since ∼1920, but it was highly variable over time and across the study area (figure 5, see figure SI5 for annotated images). During 1949–2019, fires occurred in 22 of the 70 years and affected 46.5% of the area, with 2001 having the largest extent (7.0%). When comparing the 1949–1978, 1979–2007, and 2007–2017 intervals, fire occurred in 5, 12, and 5 years within each interval and covered 17.4%, 21.5%, and 7.6% of the area, respectively. In the 1949 period, 49% of the landscape was in an early successional state after fire, which we interpreted as evidence that fire occurred on the grids during 1920–1948. When compared with the AICC fire-perimeter database (figure SI6), our sampling detected fires in 22 versus 50 years in the database, covering 47% versus 63% of the area (excluding reburns) in the database. Regression analysis found no significant trend in our grid data (P = 0.13), whereas the fire-perimeter trend was highly significant (P < 0.001). We attribute the differences to: (a) our 22 grids were an insufficient sample given the high variability of fire is space and time; (b) many early fires recorded on our grids were not in the database and fire-perimeter values before 1980 were always lower than ours; and (c) the fire-perimeter data overestimated the area burned because unburned patches usually existed within the fire perimeters.
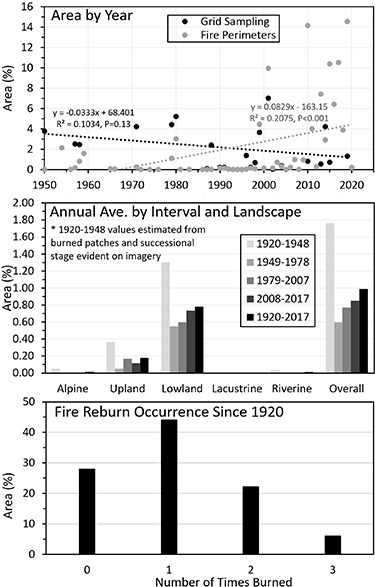
Figure 5. Areal extent of fires within the study area by year (top), the annual average by interval and landscape (middle), and the reburn occurrence of fires since ∼1920.
Download figure:
Standard image High-resolution imageFires burned an annual average of 0.99% yr−1 of the study area during 1920–2017 (figure 5). When comparing intervals, annual fire extent during 1920–1948 (1.76% yr−1) was two- to three-fold higher than the annual average extent of other intervals. When comparing landscapes for the entire 1920–2017 interval, overall annual average fire extent was four-fold higher in lowlands (0.78% yr−1) than in uplands (0.18% yr−1), with very low averages in riverine (0.01% yr−1), lacustrine (0.001% yr−1) and alpine (0.02% yr−1) landscapes. Since ∼1920, fires that burned an area only once affected 44.0% of the area, while areas that reburned two or three times covered 22.1% and 6.0% of the area, respectively. The mean fire cycle (MFC, average time required to burn an area equal to the entire study area) was 101 years for the entire 1920–2017 interval. When comparing shorter intervals, the MFC varied three-fold from 57 years during 1920–1948 to 167 years during 1949–1978. When comparing landscapes for the entire 1920–2017 interval, MFC was 78 years for lowland (61.3% of study area), 136 years for upland (24.5%), 259 years for lacustrine (0.4%), 400 years for alpine (6.2%), and 785 years for riverine (7.7%) landscapes. Our data were insufficient to calculate MFC by ecotype, given the high patchiness of fire.
Permafrost status and thermokarst type also were photo-interpreted during the grid sampling (see SI figure 7 for image patterns associated with thermokarst bogs and fens). Areas interpreted to have stable permafrost (indicated by stable land when nearby areas had evident thermokarst) decreased slightly in area from 67.6% in 1978 to 64.9% in 2017. Areas where permafrost had recently aggraded (from thermokarst fen to forest on permafrost plateaus) increased from 0.05% in 1978 to 0.4% in 2017. Thermokarst fens (meadow and scrub) increased from 3.1% to 4.3% and thermokarst bogs (meadow and scrub) increased from 0.8% to 2.0% during 1949–2017. Small incidences of thaw slumps (0.05%) and thermokarst water-tracks (0.1%) were evident in 2017, but not in 1949. When comparing landscapes in 2017, permafrost was interpreted to occupy 87% of lowland (peaty-silty, moderately ice rich), 20% of upland (extremely ice-rich silty yedoma and ice-poor rocky north-facing slopes), and 99% of alpine (ice-poor rocky) landscapes.
3.3. Climate trends and projections
Air temperature data from Fairbanks showed mean annual thawing degree-day (TDD, base °C) values of 1901, 1961, and 2034 for the 1949–1978, 1979–2007, and 2008–2017 intervals, respectively (figure SI7). Relative to the 1949–1978 baseline interval, TDD increased by 1.03× for the 1979–2007 interval and by 1.07× for the 2008–2017 interval. When considering individual years from 1949 to 2019, regression analysis found TDD increased by 1.11× (from 1838 to 2045) for the Fairbanks station and 1.06× (from 1839 to 1945) at the Big Delta station (figure SI8). Winter air temperatures for Fairbanks as summarized by FDD, however, warmed at substantially higher rates of 0.72× (from −2970 to −2162 FDD). The overall regression trend in mean annual air temperatures (MAAT) indicates that MAAT at Fairbanks increased by 1.8 °C from 1905 to 2020, for an average increase of 0.3 °C/20 years.
Projected TDD (summer) from 2010 to 2100 modeled by SNAP (Walsh et al 2018) increased relative to the 2010–2019 baseline period by 1.05, 1.09, 1.12, and 1.13× for the RCP4.5 temperature model, by 1.04, 1.08, 1.15, and 1.17× for the RCP6.0 model, and by 1.05, 1.15, 1.22, and 1.30× for the RCP8.0 model for the four respective time-intervals (figure SI6). These relative increases were used for temperature effects on transition rates in the state-transition modeling.
3.4. Projected ecotype changes
The area that changed ecotypes from 2017 to 2100 was three-fold higher for the driver-adjusted RCP6.0 temperature model (30.6%) compared with the historical-rate model (11.5%), and RCP4.5 (12.4%) and RCP8.0 (14.7%) temperature models. The historical-rate model, which assumes future transitions occur at the same rate as past transitions, projected 38 ecotypes will gain area and 24 will lose area by 2100 (figure 6). Note that during the 1949–2017 time-interval from which the transition rates were developed, TDD increased by 1.11× over 68 years. This model provides a baseline of the minimum ecotype changes projected to occur by 2100. The temperature and driver-adjusted temperature models show similar numbers of ecotypes gaining (37–39) and losing area (23–25). The much higher changes in the driver-adjusted RCP6.0 model were primarily due to rapidly accelerating thermokarst in lowland ecotypes.
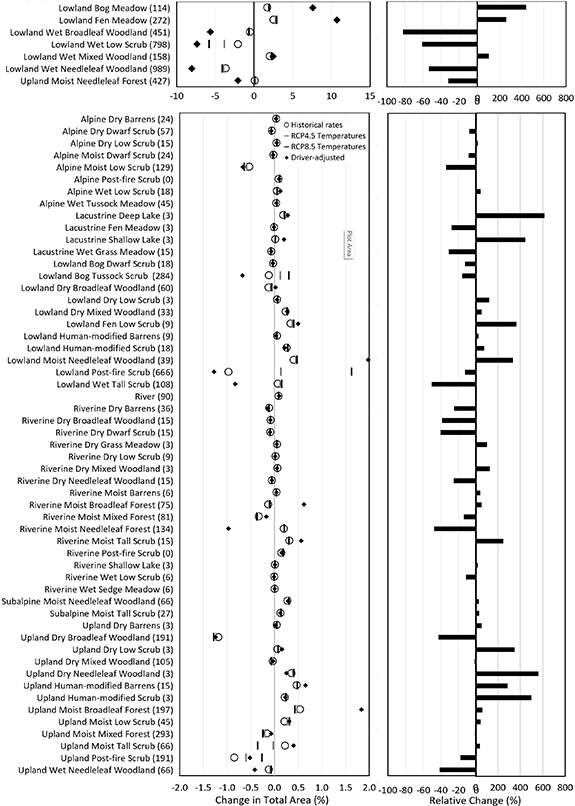
Figure 6. Projected changes in 62 ecotypes (left) as percent of total area from 2017 to 2100 based on state-transition probabilities for the historical-rate model (circle), RCP4.0 (gray bar) and RCP8.0 (black bar) temperature models, and the driver-adjusted RCP6.0 temperature (diamond) model. Relative change (percent of initial area) for the driver-adjusted model is at right. Note different scales for abundant ecotypes with large changes (upper left) and at right for decreases (−) and increases (+). Area (km2) in 2017 is included with ecotype name.
Download figure:
Standard image High-resolution image
When comparing landscapes, most of the projected changes during 2017–2100 in the driver-adjusted RCP6.0 model (most likely scenario) occurred in lowland (23.9% of total area changed), upland (3.9%) and riverine (1.6%) landscapes, while there was little change in alpine (0.3%) subalpine (0.4%) and lacustrine (0.3%) landscapes. When changes were calculated in proportion to the extent of each landscape, lacustrine (82.5%) and subalpine (73.3%) landscapes had the greatest change. Lowland (39.0%), riverine (20.7%), and upland (15.9%) landscapes had intermediate levels of change, while the alpine (5.4%) landscape had little projected change.
Focusing on the driver-adjusted RCP6.0 model, ecotypes projected to increase substantially during 2017–2100 included: (a) Lowland Bog Meadow (7.6% of total area) and Lowland Fen Meadow (10.7%) due to accelerating thermokarst; and (b) Lowland Wet Mixed Woodland (2.5%) due to increased soil drainage from thaw and deciduous tree expansion (table SI6). Ecotypes losing the most area included: (a) Lowland Wet Needleleaf Woodland (−8.0%), Lowland Wet Low Scrub (−7.4%), and Lowland Wet Broadleaf Woodland (−5.6%) due mostly to thermokarst; and (b) Upland Moist Needleleaf Forest (−2.1%) due to fire. Abundant ecotypes (>10 000 ha) projected to have small gains included only Upland Moist Broadleaf Forest (1.8%). Abundant ecotypes with projected small losses included: (a) Lowland Post-fire Scrub (−1.3%), Lowland Wet Tall Scrub (−0.8%), and Lowland Bog Tussock Scrub (−0.7%) from loss of fire-prone lowlands; (b) Riverine Moist Needleleaf Forest (−1.0%) from river erosion, (c) Upland Dry Broadleaf Woodland (−1.2%) from late succession and fire; and (d) Alpine Moist Dwarf Scrub (−0.7%) from tree and shrub expansion. When considering relative changes (% of initial area), ecotypes with large projected increases included: Lacustrine Deep Lake (616%), Lacustrine Shallow Lake (443%), and Lowland Bog Meadows (441%) from thermokarst, Upland Dry Needleleaf Woodland (561%) from late succession, and Upland Human-modified Scrub (498%) from early succession. Large relative losses were projected for Lowland Wet Broadleaf Woodland (−82%), Lowland Wet Low Scrub (−61%), Lowland Wet Needleleaf Woodland (−54%), and Lowland Wet Tall Scrub (−50%) due to thermokarst.
4. Discussion
Boreal ecosystems form a diverse and highly patchy mosaic in response to a wide variety of biophysical and anthropogenic drivers that have been interacting for millennia. While 69% of the area changed ecotypes over 68 years, shifting early and late succession across differing-aged disturbances yielded a remarkably stable overall composition of ecotypes over time, although there were large fluctuations for a few ecotypes among decadal time-intervals. By far, most change was associated with fire and post-fire succession, while thermokarst and riverine processes also affected substantial areas. Thermokarst dramatically increased over time in comparison with the highly variable effects of fluctuating fire and river dynamics. Thus, while fire is much more widespread, thermokarst is becoming more transformative, with almost no recovery toward initial ecotypes over the 68 years. Based on our projections, thermokarst will accelerate its transformation of boreal landscapes, especially in lowlands.
Fire was by far the largest driver of landscape change, affecting 72.1% of the area since ∼1920. The unusually large extent of fires in the early 1900s has been attributed to human activity during an era of extensive settlement, land clearing, and mining, as well as steamboat and train traffic [59]. Also, indigenous peoples used fires to manage habitats for subsistence wildlife species [60]. This early large fire extent led to a legacy of diminished fire activity mid-century as fire-susceptible ecotypes were reduced and aircraft-supported fire management became more intensive [59]. The slightly increasing trend during recent intervals (but still below long-term average) is likely due to more fire-prone mid- to late-successional forest ecotypes becoming more prevalent and an increasing human population. The large extent of early fires and indistinct recent trend within our limited area is at odds with recent analyses of fire history that indicates that fires over the broader boreal region have substantially increased since the 1980s [61]. Fire, however, is a natural process essential to maintaining the diversity and health of boreal ecosystems [1] and successional processes have led to the boreal vegetation being fairly stable over the last 5000 years [62].
Thermokarst is typically associated with ice-rich permafrost, especially in lowland environments with organic-rich soils [63]. In our study, thermokarst affected 6.3% of the area by 2017, up from 3.9% in 1949. Our estimate was similar to the 5% estimated for thermokarst extent across the broader zone of discontinuous permafrost in Alaska [63], but is much lower than the 47% estimated for a small rapidly degrading area on the Tanana Flats [9]. Thermokarst has occurred throughout the late Holocene with a wide range of thermokarst ages [64]. Thermokarst leads to radical shifts in ecological properties [65] and recovery of thermokarst associated ecotypes toward original conditions is extremely slow [66], unless aided by permafrost reestablishment [52]. In our study, we found 0.4% of area had been affected by new permafrost formation that facilitated a transition from lowland fens to forests.
The state-transition models project a doubling of thermokarst extent by 2100 for the historical-rate and temperature models, and a four-fold increase for the driver-adjusted RCP6.0 temperature model. Areas with stable permafrost, based on permafrost-ecotype associations, are projected to decrease from 58.5% in 2017 to 53.0% in the historical-rate model, 52.0% in the RCP8.0 model, and to 36.6% in the rate-adjusted RCP6.0 temperature model. Our projected loss in permafrost was similar to the 48% reduction (A1B scenario) in the Intermontane Boreal region in Alaska projected by Pastick et al [51]. Our projected permafrost loss in the rate-adjusted RCP6.0 temperature model, however, is much lower than results of permafrost thermal modeling by SNAP (http://data.snap.uaf.edu/data/IEM/Outputs/GIPL/Gen_1a/) that indicates nearly all permafrost will degrade in the area by 2100. Thermal modeling by Panda et al [67] for nearby Denali National Park also indicates almost a total loss of permafrost by 2100 based for the A1B emission scenario. Differences in permafrost loss among models reveal the large uncertainties in projecting permafrost responses to climate due to effects of strong ecological feedbacks on surface temperatures [68, 69], groundwater [6, 52, 70], extreme precipitation events [71], and ground ice [72].
Fluvial processes create highly dynamic environments associated with channel erosion and deposition, overbank flooding, and primary succession [27, 29]. In our study, riverine ecotypes covered 7.7% of the area in 1978, while changes from river erosion, deposition, and vegetation succession affected 2.2% of the area during 1978–2007 (29 years), indicating the floodplains were highly dynamic. Most change during 1949–2017 resulted in loss of early-successional ecotypes and gain of river water on highly dynamic braided gravelly floodplains near the mountains, particularly during 2007–2017. On meandering floodplains with silty overbank deposits, most change was for late-successional ecotypes due to erosion and succession. We attribute the unusually large gain in needleleaf forest to late succession after a large proportion of this ecotype was cut for fuel during the steamboat era. The loss of gravelly barrens and the increase in early successional vegetation is likely related to increased discharge of glacial rivers or recovery from past large floods [73, 74].
Lacustrine processes involving expansion or drainage of thermokarst lake typically are huge factors in development of water bodies and drained-lake basins in permafrost landscapes [31]. In our grid sampling, however, thermokarst-lake development was not observed because most thermokarst paludifies quickly into bogs and fens. We observed some lake drainage, but only in kettle basins in rocky moraines possibly due to permafrost loss in the surrounding terrain.
Reliability of our analysis of historical changes using remote sensing and future projections based on state-transition modeling were affected by numerous factors. Uncertainties in detecting historical change were affected by the: (a) high variability in ecotypes across grids; (b) highly patchy nature of fires over time and space; (c) modest sample size of 22 grids; (d) variable quality of the 1949 airphotos; and (e) the modest photo-interpretation accuracy of 77% for a large number of classes. Overall, we regard the image interpretation based on spectral characteristics, spatial patterns, and landscape context to be an effective approach to resolving fire history associated with multiple stand ages in close proximity, interpreting thermokarst expansion at the meter scale in features with complex vegetation patterns, and interpreting geomorphic processes (units) that are needed to differentiate physiographic landscapes. As for limitations of future projections, the temperature models used an overly simplified approach to increasing state-transition rates of ecosystems to climate warming, but they are presented in relation to the historical-rate model. Furthermore, the driver-adjusted RCP6.0 model relied on the expert judgement as to the relative sensitivity of the change drivers to temperatures, with human activities being insensitive to climate warming while thermokarst was highly sensitive. Although this modeling lacks a mechanistic approach for biogeochemical factors affecting ecosystem change, its strength lies in its foundation of observed historical transition rates, its recognition that diverse ecosystems respond very differently, and its incorporation of a wide range of disturbance and successional factors that drive change.
Knowledge of the patterns and rates of landscape change in the world's largest terrestrial biome is important for assessing global change, managing wildlife populations, and informing land management decisions. Terrestrial ecosystem models generally have very limited differentiation of boreal ecosystems [75, 76], while structure, function, and trace gas emissions are known to vary widely among ecotypes [77] and age [66]. Wildlife populations are strongly affected by habitat/ecotype availability and will be affected by ecotype changes in response to permafrost degradation, fire, and other disturbances that are detrimental to some species while beneficial to others [4, 78]. Fire is by far the most prevalent driver of change and is the subject of intensive fire-fighting and land-management decisions statewide. Current land management strategies are directed toward allowing man-made and natural fires to burn, unless they endanger human settlements and infrastructure. Although land management strategies can do little to affect ongoing thermokarst, activities that disturb ice-rich permafrost can be avoided or minimized during land use and infrastructure development.
5. Conclusion
Disturbance is fundamental to the diversity of boreal ecosystems and we found 69% of the area had changed over ~68 years. While most change was associated with fire, post-fire succession across the mosaic of stand ages tend to balance out net changes over time. In contrast, thermokarst accelerated in recent intervals, leading to a more directional transformation of lowland ecotypes with little likelihood of recovery to previous conditions. Change detection through photo-interpretation was effective at identifying changes associated with a wide range of drivers, including river erosion and deposition, lacustrine processes, landscapes, and human land use. Using past rates of ecotype transitions, we developed state-transition models to project future ecotype extent based on historical rates, increasing temperatures, and driver-adjusted transition probabilities. The driver-adjusted temperature model had the largest changes in ecotypes, showing the importance of incorporating disturbance processes in projections of land cover change.
Acknowledgments
Funding was provided by the U.S. Department of Defense, Strategic Environmental Research and Development Program (projects RC-2110, RC18-1170). In-kind support was provided by the Bonanza Creek LTER, supported by NSF (DEB-1636476), and the USDA Forest Service, Pacific Northwest Research Station (RJVA-PNW-01-JV-11261952-231). Brown was supported by a USGS Cooperative Agreement with UAF (1434-HQ-97-RU-01582 RWO 189). Katie Nicolato helped with fieldwork.
The authors have confirmed that any identifiable participants in this study have given their consent for publication.
Data availability statement
Metadata for ecotype changes are in table SI1 and grid-sampling data are in table SI2. Transition probabilities are in table SI3. Fire and climate data sources are in text.
All data that support the findings of this study are included within the article (and any supplementary files).