

Abstract
The summertime variability of the extratropical storm track over the Atlantic sector and its links to European climate have been analysed for the period 1948–2011 using observations and reanalyses. The main results are as follows. (1) The dominant mode of the summer storm track density variability is characterized by a meridional shift of the storm track between two distinct paths and is related to a bimodal distribution in the climatology for this region. It is also closely related to the Summer North Atlantic Oscillation (SNAO). (2) A southward shift is associated with a downstream extension of the storm track and a decrease in blocking frequency over the UK and northwestern Europe. (3) The southward shift is associated with enhanced precipitation over the UK and northwestern Europe and decreased precipitation over southern Europe (contrary to the behaviour in winter). (4) There are strong ocean–atmosphere interactions related to the dominant mode of storm track variability. The atmosphere forces the ocean through anomalous surface fluxes and Ekman currents, but there is also some evidence consistent with an ocean influence on the atmosphere, and that coupled ocean–atmosphere feedbacks might play a role. The ocean influence on the atmosphere may be particularly important on decadal timescales, related to the Atlantic Multidecadal Oscillation (AMO).
Export citation and abstract BibTeX RIS

Content from this work may be used under the terms of the Creative Commons Attribution 3.0 licence. Any further distribution of this work must maintain attribution to the author(s) and the title of the work, journal citation and DOI.
1. Introduction
Extratropical storms and blocking systems are important components of the atmospheric circulation and key sources of climate variability. In the northern hemisphere, storms form preferentially in storm tracks over the North Atlantic and North Pacific (e.g., Hoskins and Valdes 1990, Chang et al 2002). Atlantic storms are often responsible for extreme weather events over Europe, which in turn can have large societal impacts. Studies of storm tracks and blocking are often focused on the winter season (e.g., Hoskins and Valdes 1990, Chang et al 2002, O'Gorman 2010, Woollings et al 2012). However, recent climate extremes in summer, such as the 2003 European heat wave (Stott et al 2004, Schaer et al 2004), the 2007 UK flooding (Blackburn et al 2008) and flooding in northern Europe and droughts in southern Europe in summer of 2012 (Dong et al 2013) demonstrate the importance of understanding the mechanisms driving European summer climate at both interannual and decadal–multidecadal timescales (Folland et al 2009, Allan and Zveryaev 2011, Lang and Waugh 2011, Bladé et al 2012, Sutton and Dong 2012).
The aim of this study is to investigate the drivers of summer climate variability over Europe at both interannual and multidecadal timescales. The focus is on dynamical features such as the jet stream, storm track, and blocking frequency, how variations of these features are related and how changes in them shape European summer climate.
2. Datasets used and analysis methods
The observational datasets used in this study are the NCEP-NCAR reanalysis data (Kalnay et al 1996), the Met Office Hadley Centre mean sea level pressure (MSLP) data HadSLP2 (Allan and Ansell 2006), the monthly mean sea surface temperature (SST) data set HadISST (Rayner et al 2003), the daily gridded E-OBS precipitation (version 7.0) over Europe from the European Climate Assessment and Dataset (Haylock et al 2008), and the station-based daily England and Wales precipitation (Alexander and Jones 2000).
The storm track analysis is based on the tracking scheme developed by Hodges (1994, 1996). Cyclones are identified as 850-hPa relative vorticity maxima at 6 hourly frequency using the NCEP reanalysis. As part of the identification, the large-scale background is first removed and the vorticity is smoothed to T42 resolution, as discussed in Hoskins and Hodges (2002). The cyclone density is computed using spherical kernel estimators (Hodges 1996) and defined as the number of tracks per unit area per month, where the unit area is taken as the area equivalent to a 5° spherical cap (∼106 km2). In this letter storm track analysis is based on one reanalysis product. However, as shown by Hodges et al (2011) there is a very good correspondence between the cyclones for the most recent reanalyses, though these only cover the 1979 onwards period. Another useful local measure for baroclinic instability and hence the potential for storm growth is the growth rate of the fastest growing Eady wave (e.g., Hoskins and Valdes 1990). The Eady growth rate is defined as 0.3l(f/N)(du/dz) where f is the Coriolis parameter, N is the Brunt–Väisällä frequency, z is the upward vertical coordinate and u is the zonal wind. The Eady growth rate is calculated from NCEP-NCAR monthly mean reanalysis data.
The blocking frequency is based on the index introduced by Tibaldi and Molteni (1990) and extended to two-dimensions by Scherrer et al (2006), using all grid latitudes between 35°N and 75°N as the central latitudes. Using NCEP daily mean geopotential height at 500 hPa, the height gradients over a range 15° north and south of each central latitude are calculated. A grid point is blocked if the southern gradient is greater than 0 and the northern gradient is less than −10 m per latitude for at least five consecutive days. Tests with a weaker northern threshold of −5 m per latitude gave very similar results.
3. Results
3.1. Variability of the North Atlantic storm track and blocking
Figures 1(a) and (b) show the first empirical orthogonal function (EOF1) and the corresponding principal component (PC1) of the cyclone track density variability for June, July, and August (JJA). Note that this mode is well separated from other modes and the structure of both mode and principle component are not sensitive to the region, but the explained fraction of variance is considerably larger for a smaller domain (not shown). This mode is dominated by interannual variability (figure 1(b)) and it is characterized by a dipole structure with positive anomalies across the UK and northwestern Europe and negative anomalies to the north during the positive phase. This corresponds to a southward shifted and more zonally elongated Atlantic storm track. The Mediterranean storm track is weakened at the same time, which is in contrast to the winter behaviour in which the Mediterranean storm track is strengthened when the Atlantic jet is shifted south (e.g., Pinto et al 2009).
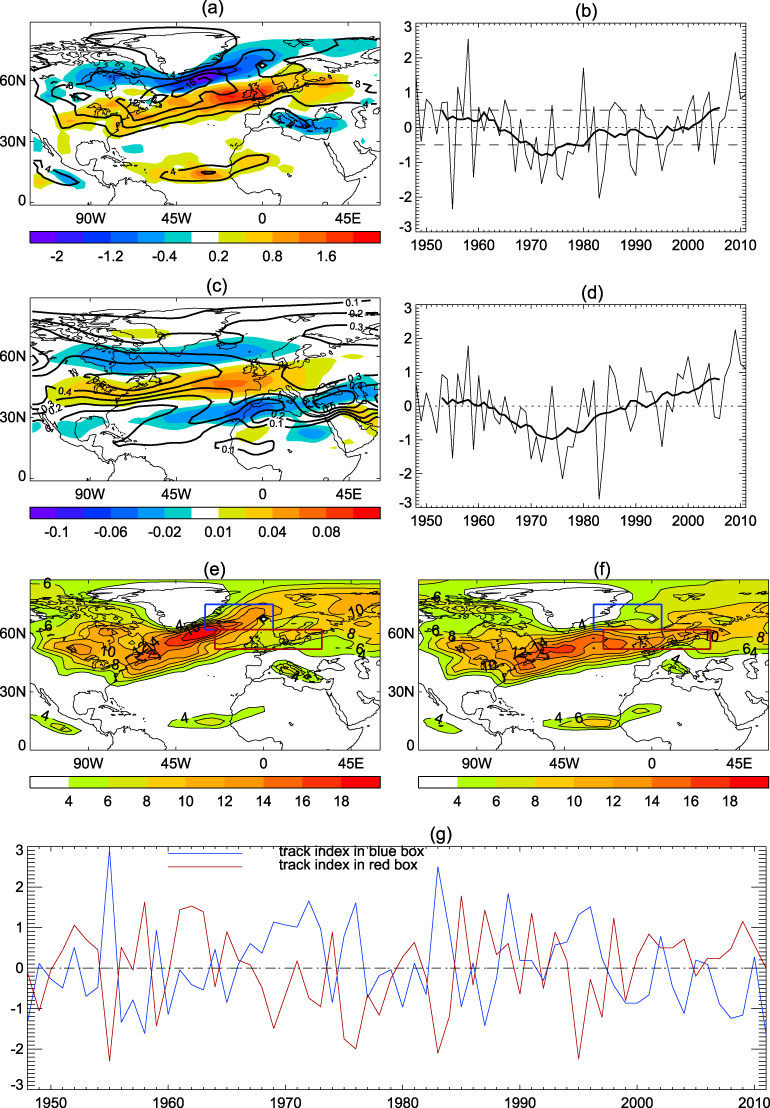
Figure 1. (a) EOF1 of storm track density interannual variability in JJA for period 1948–2011 and (b) the corresponding PC1. (c) EOF1 of Eady growth rate (d−1) and (d) the corresponding PC1. Black contours in (a) and (b) are the climatology and thick black lines in (c) and (d) are 11 year running mean. (e), (f) Composite track density for low and high PC1. Densities are in units of number density per month per unit area, where the unit area is equivalent to a 5° spherical cap (∼106 km2). (g) Normalized time series of track density averaged in two regions shown in (e).
Download figure:
Standard image High-resolution imageAnother important feature of this mode is that it has an action centre over the tropical North Atlantic hurricane main development region (e.g., Goldenberg et al 2001) and this suggests that a positive phase of this mode is also associated with increased tropical North Atlantic hurricane activity related to the reduced local vertical wind shear (not shown, see Knight et al 2006, Smith et al 2010).
The EOF1 of Eady growth rate at 500 hPa and the corresponding PC1 are illustrated in figures 1(c) and (d). The EOF1 of Eady growth rate shows a tripole structure with positive anomalies around 35°N–50°N, sandwiched by negative anomalies to the north and south (figure 1(c)). We have calculated the Eady growth rates using varying wind with the climatological N, and using varying N with the climatological wind. The results indicate that the variation of Eady growth rate is predominately related to the variation of wind (not shown). In comparison with the EOF1 of storm track density, the EOF1 of the Eady growth rate is shifted southward by 5° in latitude. This is expected since the storm track density only captures the cyclones while the Eady growth rate assesses linear growth of both cyclones and anticyclones, with cyclones (anticyclones) travelling downstream to the north (south) of the maximum of baroclinicity (e.g., Simmons and Hoskins 1978, Hoskins and Hodges 2002). The PC1 of Eady growth rate and the PC1 of storm track density are significantly correlated with a correlation of 0.87 (above the 99% confidence level using the Student t-test).
Figures 1(e) and (f) show the low and high index composites of storm track density based on the PC1 (figure 1(b)) using thresholds of 0.5 and −0.5. They show that cyclones follow two very different paths in the two phases. During the low index phase (figure 1(e)), the storm track axis runs northeastward from the east coast of America, across the Denmark Strait and Iceland and into the Arctic with few storms passing across the UK and into northwestern Europe. In contrast, the storm track axis during the high index phase is zonally elongated across the UK and into northwest Europe, with few storms reaching the Arctic (figure 1(f)). In fact, the existence of these two distinct paths is evident in the track density climatology, and the probability density function of the latitude of storm track density maxima at the jet exit shows bimodality between the two paths with a preferred southern path during years of positive PC1 and northern path during years of negative PC1 (supplementary figure S1 available at stacks.iop.org/ERL/8/034037/mmedia). The regression pattern of the cyclogenesis density in JJA to the PC1 of storm track density shows an increase in genesis upstream over the North Atlantic during PC1 positive phase, with little change over the UK and northwestern Europe (figure S2(b) available at stacks.iop.org/ERL/8/034037/mmedia), indicating that the changes there arise from more Atlantic storms travelling across the region rather than from a local increase in genesis. The numbers of storms travelling into the Arctic and those across the UK into northwestern Europe are significantly anticorrelated with a correlation coefficient of −0.61 (figure 1(g)) (above the 99% confidence level). Consistent with the storm track density differences are contrasting shifts of the North Atlantic eddy-driven jet, which shows a southward displacement in the jet exit region and a downstream extension in the high index phase (figure S2(c) available at stacks.iop.org/ERL/8/034037/mmedia).
Blocking occurs when the eddy-driven jet develops large nearly stationary meanders. The two-dimensional climatological blocking frequency in JJA is shown in figure 2(a). It indicates relatively high frequencies of blocking events occurring over Greenland, the UK, and northwestern Europe (e.g., Scherrer et al 2006). The composite differences between high and low index phases of storm track density show significantly reduced blocking frequencies over the UK and northwestern Europe and increased frequencies over Iceland. This association is evident in the time series of the PC1 of storm track density and that of area averaged blocking frequency over the UK and northwestern Europe (figure 2(c)). They are significantly and negatively correlated with a correlation coefficient of −0.41 (above the 99% confidence level). This indicates that in periods when more storms travel across the UK into northwestern Europe there is less blocking in this region. While significant, the modest value of this correlation suggests a weaker association of the blocking with the storm track variability than that in winter (Woollings et al 2008, Davini et al 2012).
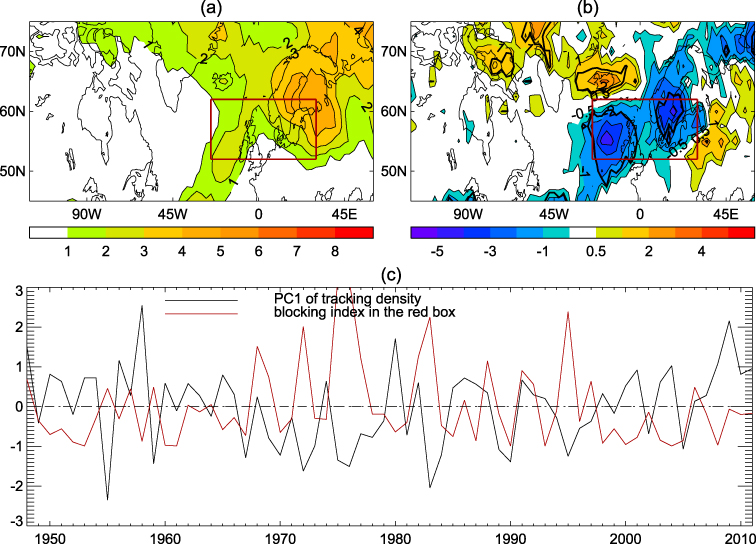
Figure 2. (a) Climatology of the blocking frequency (%) in JJA for 1948–2011. (b) Composite blocking frequency anomalies between high and low storm track phases. (c) Normalized time series of the PC1 of track density and the blocking frequency averaged over the red box shown in (b). The thick black line in (b) outlines regions where anomalies are significant at 90% confidence level using the Student t-test.
Download figure:
Standard image High-resolution image3.2. Seasonal circulation anomalies and climate impacts
The composite sea level pressure (SLP) differences in JJA between high and low index phases of the storm track density show negative anomalies centred over the UK and northwestern Europe and positive SLP anomalies to the north (figure 3(a)). This pattern of anomalies is very similar to the negative phase of the Summer North Atlantic Oscillation (SNAO), (e.g., Folland et al 2009, Bladé et al 2012). In fact, the principal component of the dominant mode of SLP variability in JJA over the region (25°–70°N, 70°W–50°E) for the period 1948–2011 (using the same sign convention as in Folland et al 2009) is negatively and significantly correlated with the PC1 of storm track density with a correlation of −0.71 (above the 99% confidence level). This high correlation indicates that the storm track variability is closely related to SNAO, with the negative phase of the SNAO being associated with a southward displaced and zonally elongated storm track and with more extratropical storms travelling across the UK and into northwestern Europe and less storm activity in the Mediterranean region, as shown by Folland et al (2009) and Bladé et al (2012).
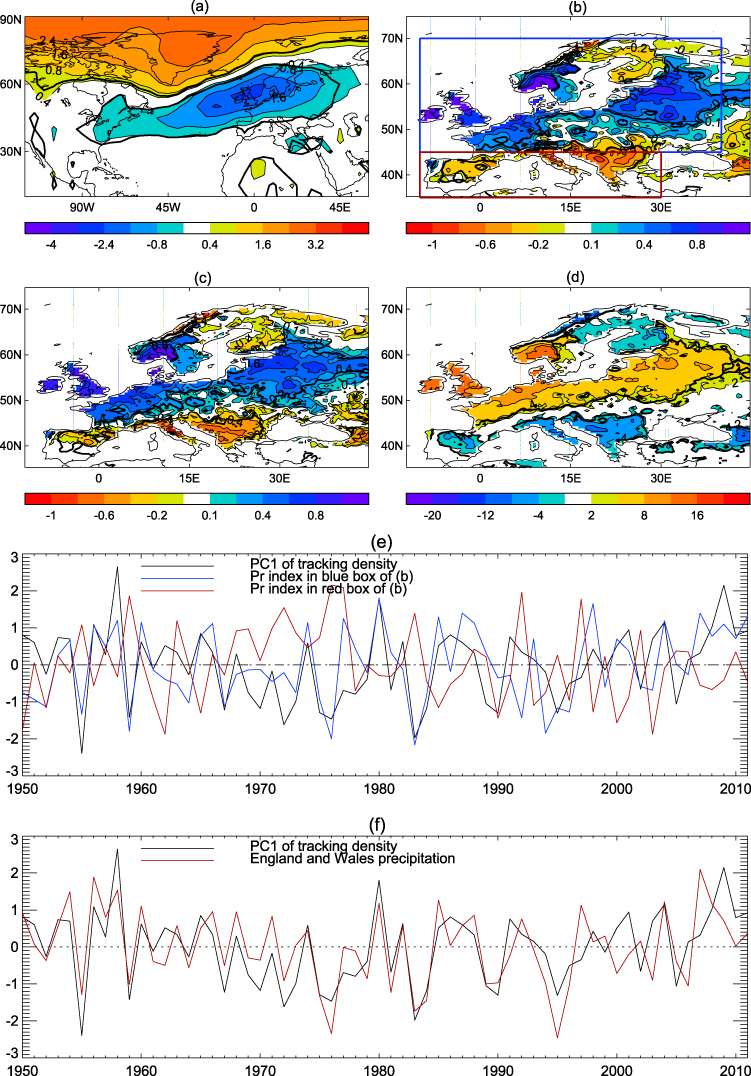
Figure 3. Composite anomalies for (a) sea level pressure (hPa), (b) precipitation (mm d−1), (c) precipitation with intensity ranging from 1 to 20 mm d−1, and (d) rainy days with intensity ranging from 1 to 20 mm d−1 in JJA for high minus low PC1 of storm track density. (e) Normalized time series precipitation indices averaged in two regions shown in (b). (f) as (e) but for England and Wales precipitation. Thick line in (a)–(d) outlines regions where anomalies are significant at 90% confidence level using the Student t-test.
Download figure:
Standard image High-resolution imageThe composite JJA precipitation differences between high and low index phases of storm track density are illustrated in figure 3(b). The southward displaced and zonally elongated storm track is associated with increased precipitation (0.4–0.8 mm d−1) over the UK and northwestern Europe and reduced precipitation (0.4–0.6 mm d−1) over southern Europe, and these changes are about 15–25% of the climatological values. The composite precipitation anomalies based on GPCC dataset (Schneider et al 2013) and the CRU TS3.1 dataset (Mitchell and Jones 2005) give similar features (not shown), indicating robustness of the precipitation anomalies. This dipole pattern of precipitation anomalies is similar to the pattern associated with negative phase of the SNAO demonstrated by Folland et al (2009) and Allan and Zveryaev (2011). It is interesting that precipitation decreases over southern Europe when the North Atlantic storm track is displaced southward. This contrasts strongly with the winter situation, when a northward shifted storm track (positive NAO conditions) is associated with a shift in precipitation from southern to northern Europe (Hurrell and Van Loon 1997). This difference may be related to the different behaviour of the Mediterranean storm track discussed above.
We have analysed the contributions of different precipitation intensities to the total JJA precipitation changes and found that it is changes of days with light to heavy rain (1–20 mm d−1) that are responsible for the dipole pattern of precipitation anomalies shown in figure 3(b). These features are illustrated in figure 3(c) which shows the seasonal mean precipitation anomalies due to light to heavy rains. Comparing figures 3(b) and (c) indicates that the dipole pattern of precipitation is predominantly due to changes in light to heavy rains. These changes in turn are related to the changes in the number of rainy days with light to heavy rain (1–20 mm d−1) with 4–10 more rainy days in summer over the UK and northwestern Europe and 4–8 less rainy days over southern Europe (figure 3(d)), while the rain intensity over both regions shows little change (not shown). These results suggest that the precipitation anomalies can be understood as consequences of the changes in storm track path, which control the number of storms and hence the number of rainy days over Europe.
The anticorrelation of JJA precipitation over the UK and northwestern Europe with that over southern Europe is further illustrated in figure 3(e), and both of these precipitation time series are significantly correlated with the PC1 of storm track density (with a correlation of 0.62 and −0.43, respectively, above the 99% confidence level). As figure 3(f) illustrates, the PC1 of storm track density in JJA is also highly correlated (with a correlation of 0.71) with the England and Wales precipitation (Alexander and Jones 2000), with a southward displaced and more zonally elongated storm track being associated with wet conditions. It is the increase of rainy days in the range of rain intensity 1.0–20.0 mm d−1 rather than changes in rain intensity or very heavy rainy days (not shown) that are responsible for the increased England and Wales precipitation during the positive phase of storm track density.
3.3. Ocean–atmosphere interactions related to the variability of the North Atlantic storm track
In this section we investigate ocean–atmosphere interactions related to the variability of the North Atlantic summer storm track. The regression pattern of JJA SSTs to PC1 of summer storm track density is illustrated in figure 4(a). This shows warm SST anomalies in the subpolar gyre region (∼0.3°–0.5 ° C), cold anomalies (∼0.2 ° C) in the midlatitudes around 40°–50°N, and weak warm anomalies in the subtropics. The warm anomalies in the subtropics might be responsible for increased tropical cyclone activity (figure 1(a)). The warm anomalies in the subpolar gyre and cold anomalies in the midlatitudes tend to weaken the meridional SST gradient around 50°N and strengthen it to the south around 40°N (figure 4(b)). This SST pattern might act to support the southward shifted baroclinicity and storm track shown in figure 1. SST anomalies in the Pacific Ocean are small and not statistically significant (not shown), but they show weak warm anomalies in the central tropical Pacific, consistent with Folland et al (2009).

Figure 4. Spatial patterns of linear regressions of seasonal mean (JJA and MAM) variables to the PC1 of storm track density in JJA. (a) SST (° C) in JJA, (b) meridional SST gradient (° C per 1000 km) in JJA, (c) surface wind in JJA (m s−1), (d) SST change (° C) in three months due to anomalous surface turbulent heat flux and Ekman transport in JJA by assuming a 40 m mixed layer ocean, (e) SST (° C) in MAM, and (f) SST (° C) in JJA for low pass filtered data based on 11 year running mean. Thick lines in (a), (b), (d), (e), (f) and grey area in (c) outline regions where regressions are significant at the 90% confidence level using the Student t-test.
Download figure:
Standard image High-resolution image
What causes these SST anomalies and associated changes in the meridional SST gradients over the North Atlantic in JJA? The linear regression of surface wind in JJA to the PC1 of summer storm track density is illustrated in figure 4(c). The changes of surface wind are characterized by anomalous easterlies over the subpolar gyre and anomalous westerlies to the south. Associated with these surface wind changes are reduced upward surface turbulent heat fluxes over the subpolar gyre, which act to warm the ocean, and increased upward turbulent heat fluxes to the south, which act to cool the ocean (not shown). In addition, the surface wind anomalies associated with a southward shift of the storm track induce anomalous Ekman transports which also act to induce warm SST anomalies in the subpolar gyre and cold SST anomalies in midlatitudes (not shown). The ocean temperature tendency due to surface turbulent heat flux and ocean temperature tendency due to Ekman transport associated with surface wind by assuming a 40 m mixed layer ocean are calculated. Linear regression of the sum of the tendency due to surface turbulent heat flux and that due to Ekman transport in JJA to PC1 of storm track variability is performed. The change in SST over three months based on the regression pattern of ocean temperature tendency is provided in figure 4(d), which shows a warming (∼0.2°–0.3 ° C) in the subpolar gyre and cooling (∼0.2 ° C) in midlatitudes. This suggests that the local response of the ocean mixed layer to the anomalous state of the atmosphere makes a major contribution to explaining SST anomaly pattern shown in figure 4(a).
The linear regression pattern of March, April, and May (MAM) seasonal mean SST to the PC1 of summer storm track density variability is illustrated in figure 4(e). It shows warm anomalies (∼0.2 ° C) in the subpolar gyre which extend equatorward to the subtropical North Atlantic along the east North Atlantic. These precursor SST anomalies in MAM (figure 4(e)) explain about half of the warm anomalies in the subpolar gyre seen in figure 4(a). In fact, many features in figure 4(a) are very similar to the sum of figures 4(d) and (e), indicating that the SST anomalies in JJA are a combination of the ocean mixed layer response to atmospheric circulation anomalies in JJA and the precursor SST anomalies in MAM. Regression patterns of the previous December, January, and February (DJF) seasonal mean SSTs are similar (not shown) and indicate persistence of these SST anomalies from the previous winter to spring over the North Atlantic. These precursor SST signals remain if the data are high pass filtered (not shown). Model studies (e.g., Knight et al 2006, Sutton and Hodson 2005) also suggest an Atlantic ocean influence on the summer atmosphere. These precursor SST anomalies suggest an influence of the ocean on the atmosphere, with potential relevance to seasonal and longer term forecasting. An interesting hypothesis is that ocean–atmosphere interactions within the summer season might act to amplify, or increase the persistence of, the dominant mode of variability in the summer storm track. In this scenario, the feedback from the ocean to the atmosphere might involve the influence of anomalous SST gradients (figure 4(b)) on the storm track, or modulation by SST anomalies of the surface evaporation that fuels storm development.
Both the PC1 of the storm track density variability (figure 1(b)) and PC1 of the Eady growth rate at 500 hPa (figure 1(d)) show multidecadal as well as interannual variability. The 11 year running mean of PC1 of the storm track density is highly correlated with the 11 year running mean of the detrended annual index of the Atlantic Multidecadal Oscillation (AMO, defined as the SST anomaly averaged over the region 0°N–60°N, 75°W–7.5°W) with a correlation of 0.86. The regression pattern of low pass filtered (11 year running mean) SSTs to the low pass filtered PC1 of storm track density (figure 4(f)) shows a basin wide warming pattern over the North Atlantic, similar to the AMO pattern (e.g., Sutton and Hodson 2005, Folland et al 2009, Sutton and Dong 2012). These results support the idea that AMO variability may influence the North Atlantic summer storm track, leading in turn to multidecadal variability in European summer climate (e.g., Sutton and Hodson 2005, Knight et al 2006, Folland et al 2009, Sutton and Dong 2012).
4. Conclusions
In summary, the observational analysis presented in this study shows that the dominant mode of interannual variability of the summer storm track over the North Atlantic and northwestern Europe is characterized by a meridional shift between two distinct pathways for storms, and is related to a bimodal distribution in the climatology of storm track density in this region. A southward displaced storm track is also characterized by a zonally extended path of the storm track, with more extratropical storms travelling across the UK and into northwestern Europe and few storms travelling to the north past Iceland. This mode of variability is closely associated with the negative phase of SNAO (e.g., Folland et al 2009) and is also linked to a modulation of blocking activity, which increases over Greenland and decreases over the UK and northwestern Europe. The southward displaced and zonally elongated storm track leads to more precipitation over the UK and northwestern Europe in summer. This enhancement in precipitation is mainly due to an increase in the number of rainy days rather than changes in rain intensity, consistent with more extratropical storms travelling across the UK into northwestern Europe. The dominant mode of summertime variability exhibits some important differences to the equivalent mode in winter, in that in summer a southward shifted Atlantic storm track is associated with a weaker Mediterranean storm track and with reduced precipitation over southern Europe.
There are substantial variations in sea surface temperature (SST) associated with the dominant mode of variability in the summer storm track. These SST variations partly reflect the ocean mixed layer response to anomalous surface heat fluxes and Ekman currents, but there is also evidence of precursor SST anomalies in the previous winter and spring, in particular in the northern subpolar gyre region. These precursor SST anomalies, together with some modelling studies (e.g., Knight et al 2006, Sutton and Hodson 2005), suggest an ocean influence on the atmosphere, with potential relevance to seasonal and longer term forecasting. There is also a possibility that coupled ocean–atmosphere feedbacks might act to amplify, or increase the persistence of, the mode of variability in the summer storm track. Investigating this hypothesis is an important area for future work.
On the multidecadal timescale, this study suggests that multidecadal variations in North Atlantic SST—sometimes referred to as the Atlantic Multidecadal Oscillation or AMO—influence European summer climate by modulating the variability of the North Atlantic summer storm track, with the positive AMO phase being associated with more storms travelling across the UK and into northwestern Europe, leading to wet summers in these regions (e.g., Knight et al 2006, Folland et al 2009, Sutton and Dong 2012).
This study has focused on observational analysis. Further work to investigate causal mechanisms more thoroughly requires numerical experimentation with models, and is underway (e.g., Dong et al 2013).
Acknowledgments
BD and RTS are supported by the UK National Centre for Atmospheric Science-Climate (NCAS-Climate) at the University of Reading. The authors would like to thank three anonymous reviewers for their constructive comments.