

Abstract
The role of submarine groundwater discharge (SGD), the leakage of groundwater from aquifers into coastal waters, in coastal eutrophication has been demonstrated mostly for the North American and European coastlines, but poorly quantified in other regions. Here, we present the first spatially explicit global estimates of N inputs via SGD to coastal waters and show that it has increased from about 1.0 to 1.4 Tg of nitrate (NO3-N) per year over the second half of the 20th century. Since this increase is not accompanied by an equivalent increase of groundwater phosphorus (P) and silicon (Si), SGD transport of nitrate is an important factor for the development of harmful algal blooms in coastal waters. Groundwater fluxes of N are linked to areas with high runoff and intensive anthropogenic activity on land, with Southeast Asia, parts of North and Central America, and Europe being hot spots.
Export citation and abstract BibTeX RIS

Content from this work may be used under the terms of the Creative Commons Attribution 3.0 licence. Any further distribution of this work must maintain attribution to the author(s) and the title of the work, journal citation and DOI.
1. Introduction
Submarine groundwater discharge (SGD) is the flow of water on continental margins from the seabed to the coastal ocean, regardless of fluid composition or driving force; SGD may therefore be salty or fresh and may be driven by hydraulic forcing from inland aquifers or by ocean forces (waves, tides, storms, and buoyancy) (e.g. Moore 2010). Base flow of continental groundwater contributes freshwater to both river flow and to SGD under many climatic conditions and in various types of aquifers (Church 1996, Moore 1996). This freshwater SGD occurs in places where aquifers are connected hydraulically with the sea through permeable sediments or rocks and where the aquifer head is above sea level. Submarine groundwater flows into the coast at the interface between freshwater and seawater (the mixing zone) where the unconfined aquifer outcrops at the beach (Moore 1996, Church 1996). Here we consider the fresh water component of SGD, which provides a direct but usually largely hidden pathway of groundwater and nutrients such as nitrogen (N) and phosphorus (P) to coastal waters (Castro et al 2003). Algae in coastal waters typically require a N/P ratio of 16 ('Redfield ratio') for their growth (Redfield et al 1963). Many coastal waters are characterized by an N/P ratio that is below Redfield and are thought to be N-limited (Howarth and Marino 2006). As P is mostly efficiently retained in soils and groundwater systems, and N is typically not (Spiteri et al 2008), SGD is usually characterized by N/P ratios ≫16, especially in agricultural areas. This differs from river water where N/P ratios of ∼14 are common (Seitzinger et al 2010). Large inputs of groundwater to coastal waters thus have the potential to impact nutrient ratios in coastal waters and change the limiting nutrient from N to P. Box modeling has shown that coastal N input via SGD has the potential to significantly affect coastal zone nutrient cycling at the global scale (Slomp and Van Capellen 2004). Although typological approaches for estimating SGD have been suggested, no spatially explicit global scale estimates are currently available (Bokuniewicz et al 2003). This letter presents the first global, spatially explicit estimate of nitrogen transport to coastal seas via SGD.
2. Data and methods
We have calculated potential nitrate transport via SGD through coastal land grid cells using a global 0.5° by 0.5° resolution flow-path model that includes spatially explicit soil N budgets in both agricultural and natural ecosystems, including plant N uptake, gaseous N losses via ammonia volatilization, denitrification, surface runoff and leaching from the subsoil to groundwater, and a description of N transport and removal in groundwater (Bouwman et al 2013, Van Drecht et al 2003) (figure 1). This model is part of the Integrated Model to Assess the Global Environment (IMAGE) (Bouwman et al 2006), and has recently been described in detail in a study to assess past and future trends in denitrification in the terrestrial system, including soils and groundwater (Bouwman et al 2013). Here we will briefly outline the groundwater component of the model.
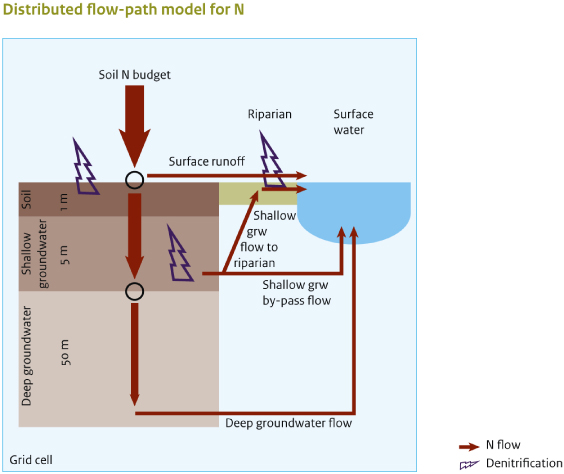
Figure 1. Global model with 0.5° by 0.5° resolution applied in this study, taking soil N budgets (accounting for ammonia volatilization) as a starting point to compute surface runoff, leaching from subsoil to groundwater, denitrification in soils, and transport and denitrification in groundwater and riparian zones. Not all grid cells include all compartments, depending on the presence of shallow groundwater, deep groundwater and surface water.
Download figure:
Standard image High-resolution imageTwo groundwater subsystems are distinguished. The shallow groundwater system represents the upper meters of the saturated zone (typically 5 m) and is characterized by short residence times before water enters local surface water at short distances, or infiltrates the deep groundwater system. A deep system with a thickness of 50 m is defined where a deeper groundwater flow is present. This deep groundwater system has a longer residence time than the shallow system, as water flows to greater depths and drains to larger rivers at greater distances.
The nitrate concentration in groundwater depends on the historical year of infiltration into the saturated zone and the denitrification loss during its transport (Böhlke et al 2002, Van Drecht et al 2003). There is evidence for anammox in attenuating ammonium in groundwater (Clark et al 2008, Moore et al 2011). Since the process is only important in areas with ammonium contamination, such as cities with leaking sewage systems, anammox was ignored in the model. The time available for denitrification during groundwater transport needs to be known. Since we use a time step of one year, seasonal changes in groundwater level are ignored, and the mean travel time depends on the ratio between specific groundwater volume and water recharge. Denitrification in shallow groundwater depends on the half-life of nitrate, which is related to the lithology (Dürr et al 2005), with alluvial materials and pyrite-containing parent material having short and other rock types longer half-lives. Denitrification is assumed to be absent in deep groundwater. We note that some denitrification could be expected with sedimentary organic matter and pyrite, but also that a bias exists in the literature for sites with rapid denitrification (Green et al 2008). Assuming denitrification rates to range between 20 and 40% of those in shallow groundwater, results in a 40% smaller global N outflow from deep groundwater (Bouwman et al 2013). This effect is, however, small, since N outflow from deep groundwater is only 10% of the total groundwater N outflow.
We used the groundwater and nitrate outflow for all coastal land, considering those shallow aquifers within a strip of 5 km, i.e. only 10% of shallow groundwater within each 0.5° grid box contributes to SGD, and 100% of deep groundwater. The shallow aquifers in the complement of the grid box are assumed to discharge towards streams and rivers. Results are calculated for different coastal types using a spatially explicit global typology (Dürr et al 2011). These types include (i) small deltas (32% of the global shoreline), (ii) tidal systems, i.e. a river stretch of water that is tidally influenced, including rias (drowned river valleys), tidal embayments and classical funnel-shaped estuaries (22% of global shoreline), (iii) lagoons (8%), (iv) fjords and fjärds (26%), (v) large rivers, including non-tidal (e.g. Huang He, Mississippi) and those with tidal deltas (e.g. Amazon, Ganges/Brahmaputra), (vi) karstic coasts and (vii) arheic coasts. We also calculated the N flux per kilometer length of shoreline within each coastal type. All results were aggregated to the level of world oceans.
The 95% uncertainty range was calculated by sampling a series (17) of model parameters (related to land use, climate, lithology, porosity and thickness of aquifers, denitrification half-life in groundwater) within an uncertainty range (Bouwman et al 2013). Sampled values within these ranges for the first model parameter are randomly paired to the samples of the second parameter, and these pairs are subsequently randomly combined with the samples of the third source, etc. This results in 400 combinations of 17 parameters. The parameter space is thus representatively sampled with a limited number of samples (Saltelli et al 2004).
All 0.5° by 0.5° data, including land use, soil N budgets, climate and the spatial runoff data for 1950, 2000 and scenarios for 2000–2050 developed for the Millennium Ecosystem Assessment (MEA) (Alcamo et al 2006) scenarios, as described in Bouwman et al (2013), form the basis of the calculations presented here. From the four MEA scenarios, we selected the business-as-usual scenario called 'Global Orchestration'.
3. Results and discussion
Compared to global patterns of riverine inputs of N via rivers (Seitzinger et al 2010), potential nutrient SGD fluxes of N show similarities in many areas. For example, elevated input is observed in densely populated areas of Europe and SE Asia. However, SGD and river fluxes are very different locally. This holds, for example, for parts of Indonesia, Indian catchments, and areas where surface flow is near zero, as in the karstic areas of Yucatan. A direct comparison of river and SGD inputs is difficult, because rivers discharge water and nutrients to the coast at the river mouth in a fjord or fjärd, estuary, lagoon, small delta, or the river plume may bypass the near shore, while SGD inputs are from aquifers that may extend over large distances laterally along the coast. While the NE coast of the US is well studied (Burnett et al 2006), only relatively few field studies have been carried out in Africa, South America and SE Asia.
Our calculations show that fresh water SGD is an important and increasing pathway for nutrients to the ocean. SGD transport to coastal waters increased from 1.0 to 1.4 Tg of nitrate (NO3-N) per year between 1950 (not shown) and 2000 (figure 2), and is expected to increase by another 20% in the coming decades. The uncertainty range (95%) for the year 2000 is 1.1–1.4 Tg N per year. The current N flux is about 7.5% of the estimated 18.9 Tg dissolved inorganic N river input to coastal seas (Seitzinger et al 2010). Except in deltas, rivers discharge at the river mouth, while SGD extends laterally along the shoreline where it has the potential to perturb nutrient cycling. Globally, tidal systems and small deltas are the major coastal types where N enters via SGD (figure 3), followed by fjords and fjärds and lagoons. Karstic areas and large rivers account for only a relatively small fraction of total N input via SGD (<3% and <2%, respectively).
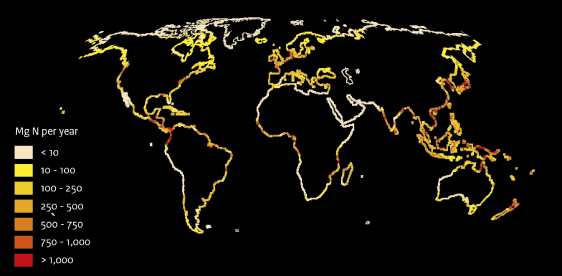
Figure 2. Input of groundwater N to coastal waters per coastal land grid cell for the year 2000 (in megagram of nitrogen per year) indicating potential hotspots with elevated N input.
Download figure:
Standard image High-resolution image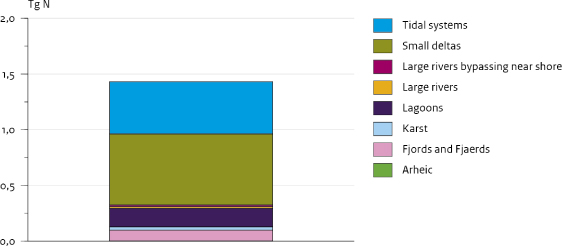
Figure 3. Global marine groundwater discharge of N to coastal seas by coastal type as calculated for the year 2000 (in teragram of nitrogen per year).
Download figure:
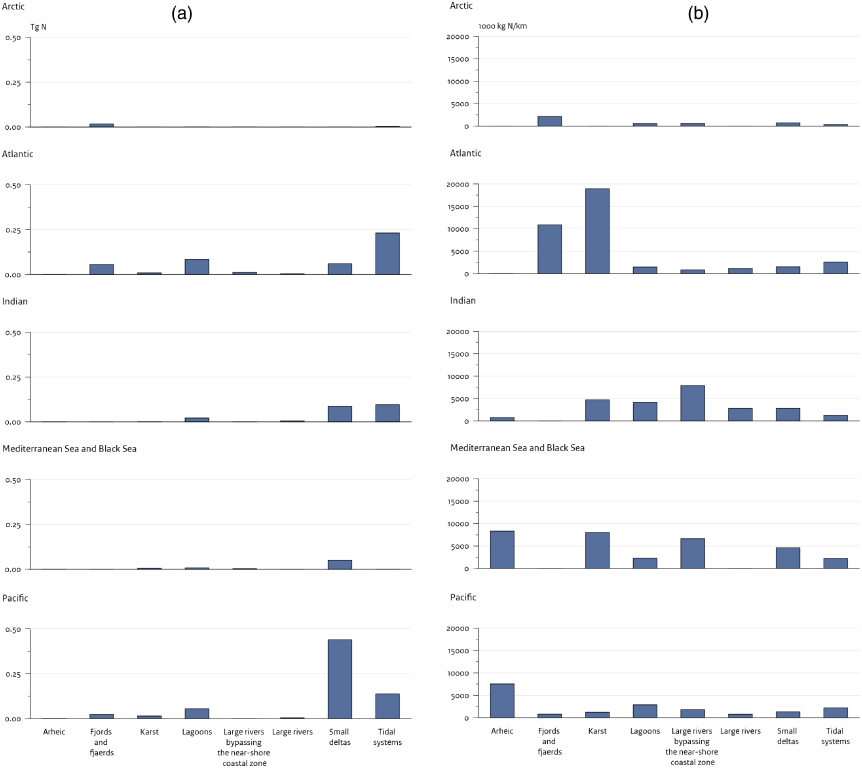
Standard image High-resolution imageThe primary type of receiving coastal water is different in the Arctic Ocean (fjords and fjärds), the Atlantic Ocean (tidal systems), Indian Ocean and Pacific (tidal systems and small deltas) and the Mediterranean Sea and Black Sea (small deltas) (figure 4(a)). The nitrate transport via SGD per kilometer of shoreline is particularly high in coastal seas with large rivers bypassing the near shore coastal zone except for the Pacific Ocean (figure 4(b)). In the Atlantic Ocean the nitrate transport per km of shoreline is also high in tidal systems. These estimates agree with fluxes of 400–100 000 kg of N per kilometer of shoreline measured in various coastal areas in the world (Paytan et al 2006).
Figure 4. Marine groundwater discharge of N by coastal type for the Arctic, Atlantic and Indian Oceans, Mediterranean Sea and Black Sea, and the Pacific Ocean for the year 2000, (a) in teragram of nitrogen per year; (b) in kilogram of nitrogen per kilometer of shoreline per year.
Download figure:
Standard image High-resolution image
The role of fresh water SGD in coastal eutrophication has been demonstrated mostly for the North American and European coastlines (Burnett et al 2006), but is poorly quantified for other regions. In this study, the first steps have been taken towards obtaining spatially explicit estimates of SGD at the global scale, and identifying potential hot spots of SGD of nitrate. Our results show that nitrate transport via SGD is an important world-wide phenomenon, but Southeastern Asia, especially Indonesia, and parts of North and Central America and Europe are hot spots for groundwater nitrate fluxes. This is probably related to intensive agricultural activity coupled with high runoff, and thus corresponds to the regions that also have high river export of nitrogen (Seitzinger et al 2010). As a source of 'new' nutrients, especially N, freshwater SGD is potentially important for coastal nutrient cycling at the global scale given the N limitation of most coastal waters (Howarth and Marino 2006).
SGD input of N to global coastal waters has increased by about 38% between 1950 and 2000, and a further 22% increase is projected for the period 2000–2050 based on a business-as-usual scenario. This increase is not accompanied by an equivalent increase in Si (Hartmann and Moosdorf 2011) and P (Slomp and Van Capellen 2004). Thus, SGD of N may lead to a distortion of the nutrient stoichiometry away from the N:P:Si molar Redfield (Redfield et al 1963) ratio of 16:1:20. Fresh water SGD transport of nitrate may therefore be an important factor for the development of harmful algal blooms in coastal waters (Gobler and Sañudo-Wilhelmy 2001, Lee and Kim 2007, Laroche et al 1997, Lapointe et al 1990, Liefer et al 2009). Recent research on the increasing frequency and extent of harmful algal blooms suggests that such distortions may in some cases lead to the proliferation of toxic blooms (GEOHAB 2006, Glibert et al 2005, Hallegraeff 2004, Anderson et al 2002, Hallegraeff 1993). These blooms are often associated with upwelling and river inputs (Kudela et al 2005, GEOHAB 2006, Heisler et al 2008).
4. Conclusions
Increasing transport of nitrogen in submarine groundwater discharge is linked to anthropogenic activities and contributes to coastal eutrophication. Our results suggest that ground-water inputs need to be considered and quantified when studying impacts of eutrophication. This study also highlights the need for more field studies in many potentially important regions where so far little direct measurements of nutrients in SGD have been carried out, such as the (sub-) tropical areas of Africa, South America and Southeast Asia.
Acknowledgments
We thank Hans Dürr of the Ecohydrology Research Group, University of Waterloo, Canada, for his contribution to an early version of this letter. AFB and AHWB gratefully acknowledge financial support from the Global Environment Facility (GEF), United Nations Environment Programme (UNEP), Intergovernmental Oceanographic Commission of the UNESCO (IOC/UNESCO) and other partners through the UNEP/GEF project 'Global Foundations for Reducing Nutrient Enrichment and Oxygen Depletion from Land-based Pollution in Support of Global Nutrient Cycle'. CPS acknowledges funding from the European Research Council under the European Community's Seventh Framework Programme for ERC Starting Grant 278364.