
Abstract
Analysis of 20th century simulations of the High resolution Global Environment Model (HiGEM) and the Third Coupled Model Intercomparison Project (CMIP3) models shows that most have a cold sea-surface temperature (SST) bias in the northern Arabian Sea during boreal winter. The association between Arabian Sea SST and the South Asian monsoon has been widely studied in observations and models, with winter cold biases known to be detrimental to rainfall simulation during the subsequent monsoon in coupled general circulation models. However, the causes of these SST biases are not well understood. Indeed this is one of the first papers to address causes of the cold biases. The models show anomalously strong north-easterly winter monsoon winds and cold air temperatures in north-west India, Pakistan and beyond. This leads to the anomalous advection of cold, dry air over the Arabian Sea. The cold land region is also associated with an anomalously strong meridional surface temperature gradient during winter, contributing to the enhanced low-level convergence and excessive precipitation over the western equatorial Indian Ocean seen in many models.
Export citation and abstract BibTeX RIS

Content from this work may be used under the terms of the Creative Commons Attribution 3.0 licence. Any further distribution of this work must maintain attribution to the author(s) and the title of the work, journal citation and DOI.
1. Introduction
The Arabian Sea region acts as a potent source of moisture for the Indian summer monsoon (Gimeno et al 2010) in part due to its warmth, reaching over 29 °C in places during boreal summer. The seasonal cycle of the Arabian Sea is complex owing to the two monsoonal wind regimes (winter and summer), with sea-surface temperature (SST) being controlled by a combination of evaporation, solar fluxes, wind-driven mixing and upwelling (Ju and Slingo 1995).
On interannual timescales, parts of the Arabian Sea are known to affect summer monsoon rainfall directly: Turner et al (2012) (their figure 1) noted strong summer monsoons feature much greater fluxes of moisture from the Arabian Sea. More locally, Vecchi and Harrison (2004) identified an association between anomalously cold SST in the western Arabian Sea and reduced rainfall during June and July along the Western Ghat mountains of India. Similarly, Izumo et al (2008) noted a relationship between upwelling-driven changes in SST on the Oman and Somali coasts and rainfall over the Western Ghats, with reduced upwelling warming the SST and leading to a greater transport of moisture towards India.
Arabian Sea SSTs are also important for understanding climate model biases. For example, Levine and Turner (2012) showed cold biases of up to 3 °C in boreal winter and spring in a version of the Met Office Hadley Centre Global Environment Model HadGEM3 to be much larger and more important than the interannual variability. By comparing integrations using coupled (biased) SST with Atmospheric Model Intercomparison Project (AMIP)-forced (realistic) SST and running a range of SST perturbation experiments, Levine and Turner (2012) showed that decreases in Indian summer monsoon rainfall between the atmosphere-only and coupled versions of the model could be almost entirely explained by the Arabian Sea SST biases that develop prior to the summer monsoon season. There is some evidence to suggest that incorporation of the effects of ocean biology on the penetration of solar radiation into the ocean (chlorophyll blooms themselves associated with the monsoons) can ameliorate some of the bias seen in the coupled model HadCM3 prior to the monsoon onset (Turner et al 2012).
There are strong precipitation and associated low-level atmospheric convergence biases in the western equatorial Indian Ocean (WEIO) of the CMIP3 (Third Coupled Model Intercomparison Project) (Bollasina and Nigam 2009) and the latest CMIP5 models (Sperber et al 2012). The mechanism suggested by Bollasina and Ming (2013) suggests that such biases could form part of an overly strong winter monsoon Hadley-type circulation, concurrent with strong northerly winds across the Arabian Sea. We build on the work of Bollasina and Ming (2013) by suggesting that there are causes for the Arabian Sea cold SST bias during boreal winter in addition to or instead of those perhaps forced by excessive convergence in the WEIO.
Given the clear implications for summer monsoon predictability, in this study we examine the relationship between advection of cold dry air across the northern coast of the Arabian Sea and anomalous north-easterly monsoon winds to see if they cause cold SST biases in the Arabian Sea of the CMIP3 models.
In section 2 we describe the models and data used and their analysis, while results are shown in section 3. We discuss the implications and draw conclusions in section 4.
2. Data and methodology
2.1. CMIP3 models and their analysis
Data from 22 models of the Third Coupled Model Intercomparison Project (CMIP3) multi-model database (Meehl et al 2007) archived at the Program for Climate Model Diagnostics and Intercomparison (PCMDI) were used in this study. The 20th century integrations (20c3m), in which greenhouse and other forcing agents were set to match as far as possible those in observations over the same period, were considered over the 1900–1999 period. Monthly data were averaged to give seasonal means for boreal winter (December to February, DJF) in lower tropospheric winds (at 925 and 850 hPa) and specific humidity, ocean surface temperature, near-surface air temperature (typically 1.5 or 2 m), and latent heat flux from the surface. The full list of models considered is as shown in the legend in figure 1. Regional means were calculated on the native model grids to avoid loss of information in production of the scatter diagrams and regression calculations, while model outputs were bilinearly interpolated to a common grid of the lowest applicable resolution to facilitate the generation of composite diagrams as in figure 2. This is 5 × 4° for the atmospheric fields and 4 × 3° for ocean surface temperature. We generate composites based on an index of northern Arabian Sea (50–70°E, 20–25°N) SST, in which the seven warmest and coldest models are selected, representing roughly one-third of the available models each. For those models in which multiple realizations (ensemble members) of the 20c3m integration were available, the first run was used.
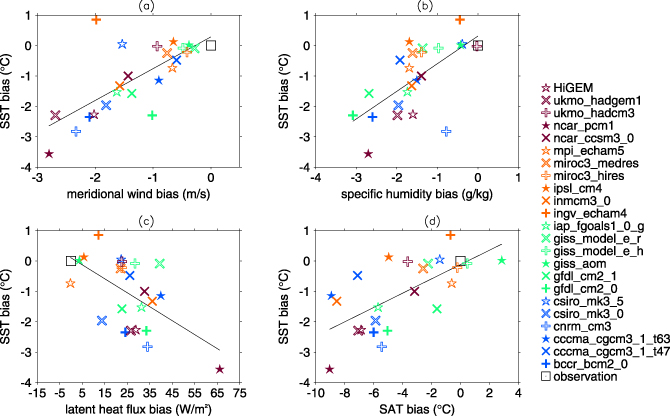
Figure 1. Northern Arabian Sea (50–70°E, 20–25°N) SST biases during boreal winter (DJF) in HiGEM and the 22 CMIP3 models regressed onto various fields: (a) Arabian Sea (50–70°E, 10–25°N) 925 hPa meridional wind biases; (b) 925 hPa specific humidity bias over the Arabian Sea; (c) surface latent heat flux over the northern Arabian Sea (60–70°E, 20–25°N); and (d) surface air temperature biases in Pakistan and north-west India (55–70°E, 25–35°N). All fields are averaged over boreal winter (DJF) using the native model grid for area-averaging in each case. Units are °C for the SST, and m s−1, g kg−1, W m−2 and °C for the abscissa on each panel respectively. Least squares regression lines are shown on each panel. Observations are HadISST for SST, ERA-40 Reanalysis for winds, CRU TS3.1 for surface air temperature, ERA-40 reanalysis for humidity and NOCS for surface latent heat flux (the sign convention is positive for upwards).
Download figure:
Standard image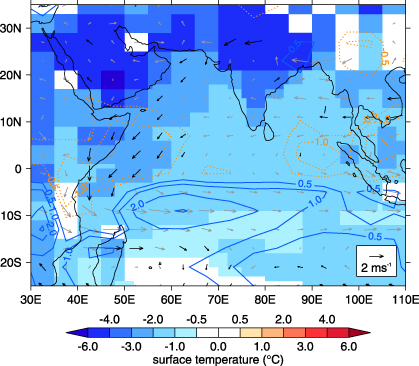
Figure 2. Composite difference of boreal winter (DJF) conditions between the seven coldest and seven warmest CMIP3 models based on the index of northern Arabian Sea SST (50–70°E, 20–25°N). See text for models used in the composite. The figure shows differences in surface air temperature over land, ocean surface temperature (both shaded), 850 hPa wind vectors and precipitation (contour lines: blue solid positive, red dotted negative). Note the different grid size for atmosphere and ocean surface temperatures: 5 × 4° and 4 × 3° respectively. Units are °C and mm d−1, the unit wind vector being 2 m s−1. The precipitation contour interval is 1 mm d−1 with the addition of ±0.5 mm d−1 contours. The zero-line is omitted for clarity. For surface temperatures, composite differences failing to pass a student's t-test at the 90% significance level are blanked out. Further wind vectors failing to satisfy the t-test at the 90% level are shown in grey. The full precipitation composite difference is shown with no significance testing.
Download figure:
Standard image2.2. The HiGEM model
In addition to the CMIP3 models described above, the High resolution Global Environment Model (HiGEM) (Shaffrey et al 2009) is also included in the study. HiGEM is based on the HadGEM1 version of the UK Met Office Hadley Centre model, but with resolution increased to N144 (1.25° × 0.83° in longitude and latitude respectively) on 38 levels in the atmosphere, and 1/3° globally for the ocean and sea ice. The high resolution in the ocean permits eddy fields to be represented (although not fully resolved) and leads to better simulation of western boundary currents and tropical instability waves, improving the simulation of the mean state along the equator (Roberts et al 2009). Here we use a 50-year present-day control integration of HiGEM as a 20th century integration was unavailable. The aim here is to support ongoing examination of Indian Ocean behaviour in HiGEM with outputs from the CMIP3 multi-model database.
2.3. Observed datasets
For comparison of the CMIP3 models with 20th century observations, a variety of datasets were used. For dynamical fields (lower tropospheric winds) and lower tropospheric specific humidity, the ERA-40 Reanalysis (Uppala et al 2005) was used over the 1958–2001 period. The HadISST 1° gridded dataset of sea-surface temperature (Rayner et al 2003) and 0.5° gridded near-surface air temperature from the Climatic Research Unit (CRU) TS3.10 dataset (Harris 2012) were used for the 1901–2001 range. Latent heat fluxes were derived from a 1° gridded data set from the National Oceanography Centre Southampton, covering 1973–2002. Precise definitions in the timings of the surface temperature datasets do not affect the main conclusions.
3. Results
To show the presence of a common cold bias in SST in the northern Arabian Sea, and examine possible causes, figure 1(a) shows a scatter plot of SST bias in the region compared to HadISST observations against the 925 hPa meridional wind component over the whole Arabian Sea. A linear regression line is overlaid on the diagram. HiGEM and virtually all of the CMIP3 models show northern Arabian Sea SSTs to be in the range 0–3 °C too cold, at the same time as the Arabian Sea suffers excessive northerly winds in the approximate range 0–3 m s−1. This indicates the presence of an excessive north-easterly (winter) monsoon over South Asia. The two fields are linearly correlated at 0.72, indicating a significant correlation well exceeding the 5% level of 0.42 (the correlation coefficient remains as high as 0.67 using Spearman's rank correlation, which removes the effects of outliers). We have tested the sensitivity of the correlation to the latitudinal placement of the wind domain, and noted that the correlation reduces somewhat when it is moved both to the north and south. We note that the large SST biases are also present in the CMIP5 models currently available (Levine et al 2013).
Examination of the low-level humidity in HiGEM and the CMIP3 models over the Arabian Sea (the SST regression onto it shown in figure 1(b)) indicates that the air advected over the region from Pakistan and surrounding regions is indeed too dry (correlation of 0.66, or ranked correlation 0.70). Note that we used here the 925 hPa humidity since very few CMIP3 models provide specific humidity at 1.5 or 2 m heights. In consequence, and with the aid of the excessive winds, evaporation from the sea surface is enhanced: indeed HiGEM and the CMIP3 models exhibit excessive (upward) latent heat fluxes from the Arabian Sea (figure 1(c)) when compared with observations from the National Oceanography Centre Southampton. This negative correlation (−0.59, also −0.59 ranked) indicates that it is the atmosphere via the low-level circulation that is driving the change in Arabian Sea SST (and therefore the immediate local origin of the bias) rather than the ocean.
To examine to what degree the atmosphere is driving the ocean, we perform a simple back-of-envelope calculation to estimate the effect of the latent heat flux bias on the mixed layer using  . We use cp = 3990 J kg−1 K−1 as the specific heat capacity of water and density ρ = 1026 kg m−3. We estimate a latent heat flux bias at the surface of ΔF = 30 W m−2 from figure 1(c), and assume a mixed layer depth of around 50 m for boreal winter (see the observed estimates in Turner et al 2012, figure 10). When accumulated over the winter monsoon season (Δt = 90 days), such a bias would decrease SST by approximately 0.8 °C. This is around half the value typical from models in figure 1. We acknowledge that there may also be oceanic factors such as ocean biology (Turner et al 2012) that aid the bias, although there may be further oceanic causes. To further support the atmosphere as a driver, examination of the individual component models of the latest Met Office GCM HadGEM3 (not shown) demonstrates that the ocean and atmosphere models elicit different responses to applied observed fluxes when run alone. The HadGEM3 atmosphere-only model, when forced with observed SST, shows similar biases in DJF surface winds and latent heat fluxes to the fully coupled model. However, when the ocean/sea-ice component of HadGEM3 (NEMO: Nucleus for European Modelling of the Ocean) is forced with observed surface fluxes, the cold bias does not develop in winter in the Arabian Sea. This strongly suggests that the bias is driven primarily by the atmosphere.
These arguments are so far consistent with the enhanced local Hadley circulation put forward by Bollasina and Ming (2013), although boreal spring was examined in their work. However we suggest that land temperature biases further north may also play a role, contributing to a significant proportion of the cold bias in the northern Arabian Sea.
To explore the origin of the cold boreal winter SST bias further, we plot a scatter diagram of the SST biases versus those in surface air temperature in the land regions to the north of the Arabian Sea, covering parts of Pakistan, Afghanistan and north-west India. Figure 1(d) shows dramatic cold biases over the land and a reasonable linear relationship between the land and SST biases, with a correlation coefficient of 0.68 (0.67 using Spearman's rank correlation). These cold air temperature biases are noted to extend to boreal spring in HiGEM and the CMIP3 models (Marathayil 2012). There is thus a close relationship between the cold land surface temperature bias and the SST biases in the northern Arabian Sea. Given that the pattern of the mean flow at this time of year is mainly northerly flow across the northern coast of the Arabian Sea, the cold land surface temperature biases will lead to anomalous advection of cold, dry air over the Arabian Sea, consistent with figures 1(a)–(c).
We note that although the ncar_pcm1 model appears as an outlier in all the panels of figure 1, since the ranked correlations differ little from the linear correlation values, its effect on the results in negligible.
To gain further insight into the spatial relationship between these biases, in figure 2 we construct a composite difference based on the seven coldest and warmest CMIP3 models in northern Arabian Sea SST (50–70°E, 10–25°N). The coldest models are bccr_bcm2, cnrm_cm3, csiro_mk3_0, gfdl_cm2_0, gfdl_cm2_1, ncar_pcm1 and ukmo_hadgem1, while the warmest models are csiro_mk3_5, giss_aom, giss_model_e_h, giss_model_e_r, ingv_echam4, ipsl_cm4 and ukmo_hadcm3. Figure 2 indicates the dramatic relationship between cold land surface biases to the north of the Arabian Sea (and elsewhere), cold SST biases in the Arabian Sea and the anomalously strong north-easterly winds. As seen in the figure, the surface temperature biases contribute to an anomalous meridional temperature gradient (exacerbating the expected cold north–warm south gradient during winter). This gradient is associated with significant excessive winter monsoon winds from the northern and eastern coasts of the Arabian Sea right down to the cross equatorial component, which turns north-westerly as it passes into the southern hemisphere (although this latter part is insignificant at the 90% level). There is anomalous convergence into the western equatorial Indian Ocean (WEIO), suggesting that the land temperature bias is associated with the development of this convergence bias. The convergence is linked to anomalously strong, although not statistically significant, precipitation in the WEIO as shown in figure 2, another common bias in both the CMIP3 and CMIP5 models (Bollasina and Ming 2013, Sperber et al 2012). Thus we hypothesize that the cold land bias north of the Arabian Sea may play a role in the enhanced (winter) monsoon Hadley-type circulation in addition to that played by the WEIO convergence bias during spring (Bollasina and Ming 2013). The lack of statistical significance in the composite precipitation difference shown in figure 2 reflects the large diversity in simulation of tropical precipitation in coupled general circulation models (GCMs) and the small sample size used in the composite. We feel that this strengthens the case for the Arabian Sea cold SST bias being caused by the cold land surface air temperature biases and associated excessive winds from the north, rather than the western equatorial Indian Ocean precipitation/convergence bias.
Another consequence of the excessive wind speeds over the northern Indian Ocean shown in figures 1(b) and 2 is that the ocean mixed layer is too deep. This has been determined by measurements of the mixed layer estimated by a 1 °C temperature deficit from the surface (not shown): typically in the range 50–100 m too deep in the north of the basin. In figure 3 we show a meridional vertical profile of ocean potential temperature through the central Arabian Sea in the coldest and warmest models, and the difference between them. Such a narrow range of longitudes is chosen due to constraints imposed by the bathymetry near the coastlines and the resolution of the models contained in the composite. Figure 3 demonstrates that the cold models are too cold over a considerable latitudinal range. In the northern Arabian Sea the temperature profile is less stable in the cold models, indicating a deeper mixed layer and a thermocline that is also too deep. This mixed layer bias would act to dampen the surface cooling owing to a larger heat capacity being held in contact with the surface, which reinforces the idea of non-oceanic processes being to blame for the cold SST biases.
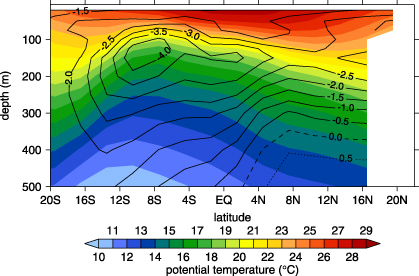
Figure 3. Composite of average (shaded) boreal winter (DJF) upper ocean potential temperature meridional profile averaged over 64–68°E in the seven coldest and seven warmest CMIP3 models based on the index of northern Arabian Sea SST (50–70°E, 10–25°N) and difference between the coldest and warmest models (contoured). Units are °C. The contour interval is 0.5 °C for the difference, with positive (negative) contours dotted (solid).
Download figure:
Standard image4. Discussion and conclusions
This study has demonstrated that the CMIP3 models (and HiGEM) possess cold biases in northern Arabian Sea SST during boreal winter, which are associated with excessive north-easterly monsoon winds and advection of cold dry air from the land north of the coast in Pakistan and surrounding regions. These enhance evaporation, cooling the surface. The excessive winds are related to an anomalous meridional temperature gradient at the surface, with land surface temperatures north of the Arabian Sea in the CMIP3 models consistently too cold, in some cases severely so.
Given that the excessive winter monsoon winds lead to enhanced meridional convergence in the WEIO, we hypothesize that the cold land surface and northern Arabian Sea temperature biases may play a role in the precipitation errors seen in the WEIO, prevalent in many models in winter and summer, and in the latest CMIP5 models (Sperber et al 2012, Bollasina and Ming 2013). In addition to being an erroneous source of diabatic heating that could affect predictability in remote regions via teleconnections, this wet bias may also impact on Indian Ocean dipole behaviour, and thus the cold land temperatures may ultimately also be contributing to reduced seasonal predictability in the tropics outside of the summer season (Marathayil 2012).
Further experimental studies are needed to isolate the role of the land surface temperature bias on the development of the excessive meridional winds and cold Arabian Sea SSTs, and also to determine their role in the WEIO biases. Since the biases are connected with those in the WEIO via a Hadley-type circulation (Bollasina and Ming 2013), such experiments could also determine the independence of land surface temperature biases from errors in the WEIO in coupled and atmosphere-only models. However we reiterate that composite precipitation differences over the WEIO shown in figure 2 were largely statistically insignificant. Preliminary experiments with the UK Met Office HadGEM3 model (Levine 2012) suggest that Arabian Sea SST biases show some response to independent nudging of both the continental temperature bias and the WEIO rainfall bias back towards observations. Since both the continental temperature bias and WEIO rainfall bias develop rapidly within the first few days in Met Office NWP simulations, we suggest that they arise independently and therefore that both play a role in the establishment of the SST bias.
It is possible that the cold land temperature bias may exist due to problems in the representation of the flows over the arid and mountainous areas of the region—valleys that are partially resolved in the model have an excessive tendency to decouple and form stagnant pools of excessively cold air (Lock 2012). However an examination of the origin of that bias is beyond the scope of this study. By examining the scatter diagram in figure 1(d) against model documentation, there is no apparent relationship between the resolution of the atmospheric component of the GCM and the size of the surface air temperature bias (not shown). It is therefore possible that if higher resolution were able to improve this surface air temperature bias, it would not be noticed until much higher resolutions are reached.
The main implication of the cold SST bias is its impact on the subsequent summer monsoon over South Asia. The bias persists into spring in the CMIP3 and CMIP5 models (Levine et al 2013) and HiGEM. Studies with the HadGEM3 coupled model of the UK Met Office have demonstrated that such cold biases in spring lead to a weak summer monsoon compared to scenarios in atmosphere-only versions of the same model (Levine and Turner 2012) due to weakening of moisture fluxes incident upon India. Indeed in the available CMIP5 models there is a clear relationship between winter SST cold biases and deficient early summer monsoon rainfall. Further, those models with larger cold biases also feature suppressed projections of future early summer monsoon rainfall (Levine et al 2013). Thus the suggestion is that resolving biases in winter land air temperatures to the north of the Arabian Sea and reducing excessive convective rainfall over the WEIO will in turn improve coupled SST biases in the Arabian Sea and could lead to enhanced predictability of the summer monsoon both on seasonal and climate projection timescales. This makes these biases an urgent topic for further study.
Acknowledgments
D Marathayil is funded by a UK-India Education and Research Initiative (UKIERI) PhD studentship; L C Shaffrey is funded by the National Centre for Atmospheric Science Climate Directorate; A G Turner is currently funded by a NERC Fellowship (NE/H015655/1) and also acknowledges the NERC Changing Water Cycle projects SAPRISE (NE/I022469/1) and Hydroflux-India (NE/I022485/1). He was previously funded by NCAS-Climate. R C Levine is supported by the Joint DECC/Defra Met Office Hadley Centre Climate Programme (GA01101). The authors thank Gill Martin for constructive comments. Resources for running the HiGEM GCM were provided by HECToR. We acknowledge the modelling groups, the PCMDI and the WCRP's Working Group on Coupled Modelling (WGCM) for their roles in making available the WCRP CMIP3 multi-model dataset. Support of this dataset is provided by the Office of Science, US Department of Energy.