
Abstract
A climatology of low cloud surface precipitation occurrence and intensity from the new CloudSat 2C-RAIN-PROFILE algorithm is presented from June 2006 through December 2010 for the southeastern Pacific region of marine stratocumulus. Results show that over 70% of low cloud precipitation falls as drizzle. Application of an empirical evaporation model suggests that 50–80% of the precipitation evaporates before it reaches the surface. Segregation of the CloudSat ascending and descending overpasses shows that the majority of precipitation occurs at night. Examination of the seasonal cycle shows that the precipitation is most frequent during the austral winter and spring; however there is considerable regional variability. Conditional rain rates increase from east to west with a maximum occurring in the region influenced by the South Pacific Convergence Zone. Area average rain rates are highest in the region where precipitation rates are moderate, but most frequent. The area average surface rain rate for low cloud precipitation for this region is ∼0.22 mm d−1, in good agreement with in situ estimates, and is greatly improved over earlier CloudSat precipitation products. These results provide a much-needed quantification of surface precipitation in a region that is currently underestimated in existing satellite-based precipitation climatologies.
Export citation and abstract BibTeX RIS

Content from this work may be used under the terms of the Creative Commons Attribution-NonCommercial-ShareAlike 3.0 licence. Any further distribution of this work must maintain attribution to the author(s) and the title of the work, journal citation and DOI.
1. Introduction
The largest uncertainties in projections of future climate lie in the representation of clouds (Stephens 2005, Soden and Held 2006, Dufresne and Bony 2008) and this uncertainty is in turn dominated by the physics of shallow clouds (Bony and Dufresne 2005, Webb et al 2006). Because of their large spatial extent and tenuous but persistent cloud cover, regions dominated by marine stratocumulus cloud systems are a critical modulator of the global energy balance, yet remain one of the most difficult regions to adequately observe and simulate. These low clouds occur in a shallow layer under a strong inversion on the eastern boundaries of subtropical oceanic regions where sea surface temperatures (SSTs) generally have a lower temperature than the warm, subsiding free tropospheric air. These regions exert a cooling effect on the climate system due to the strong shortwave cloud radiative effect that depends, in turn, on the low cloud macro- and microphysical properties.
A number of recent studies (e.g., Stevens et al 2005, van Zanten et al 2005) have focused on quantifying and exploring the role of drizzle in regulating stratocumulus cloud properties. Recent in situ observations from field experiments (e.g., Wood et al 2011) in marine stratocumulus regions in the southeastern Pacific and off the southern coast of California have shown that drizzle is a common occurrence in these clouds. Investigations of the feedback of precipitation on the cloud dynamics and cloud microphysics (e.g., Stevens et al 2005, Petters et al 2006, Sharon et al 2006, Wood et al 2008) have shown that these drizzling clouds typically exhibit higher liquid water path and larger particle sizes than their non-precipitating counterparts. In addition, drizzle is often correlated with broken, or open-cellular cloud regimes, which has a very different radiative effect than the closed-cell regime.
These shallow cloud systems are by their nature sensitive to perturbations in either their thermodynamic environment or the microphysical background in which they exist (Stevens and Brenguier 2009). Another complicating factor is that these cloud systems may also feed back on the environment in ways that could alter the water and energy budgets. One example of this would be that reduced cloudiness, due to either reduction in cloud fraction or cloud water, would both increase surface heating and reduce cloud top radiative cooling. The former would lead to a more turbulent boundary layer and would ultimately result in a greater latent heat flux from the surface, but the latter would reduce the turbulence driven by convective instability due to cloud top long-wave cooling. Uncertainties in the physics that govern the response of these clouds to their environment and their subsequent feedbacks on their environment make climate model representations of the water and energy budgets of these regimes especially problematic.
While recent field campaigns like Dynamics and Chemistry of Marine Stratocumulus (DYCOMS-II; Stevens et al 2003) and VOCALS-REx (Wood et al 2011) have advanced the understanding of the role of drizzle in marine stratocumulus, these campaigns are generally of short duration and lack the large spatial and temporal coverage offered by satellite observations. There is a long history of satellite passive microwave precipitation estimates (e.g. Wilheit 1986, Kummerow et al 2001), as well as more recent estimates from the Tropical Rainfall Measuring Mission (TRMM) active Ku-band precipitation radar (PR) precipitation retrievals (Iguchi et al 2000). However, the inherent lack of sensitivity of these methods to very light precipitation limits their ability to detect drizzle in low clouds. Attempts have also been made to indirectly quantify drizzle occurrence using other satellite-derived variables as a proxy for precipitation. Jensen et al (2008) used a 15 μm threshold in cloud effective radius retrieved from moderate resolution imaging spectroradiometer (MODIS) data to identify drizzling scenes in marine boundary layer cloud regions, however a recent study by Lebsock et al (2008) show that the effective radius threshold for precipitation in warm clouds is dependent on aerosol concentrations. The recent launch of the CloudSat (Stephens et al 2002) Cloud Profiling Radar (CPR) provides measurements with a greater sensitivity to small precipitation drops that offers a new look at the distribution of drizzle in marine stratocumulus clouds. A study by Leon et al (2008) used the first year of CloudSat data to study drizzle in marine low clouds based on their maximum radar reflectivity. This provided important information on precipitation within the column, but did not quantify what reaches the surface. Existing precipitation climatologies like the mostly satellite-based Global Precipitation Climatology Project (GPCP; Huffman et al 2009) or the Global Precipitation Climatology Centre (GPCC; Schneider et al 2008) surface rain gauge based analyses both estimate precipitation at the surface. The recently released CloudSat 2C-RAIN-PROFILE precipitation product (Lebsock and L'Ecuyer 2011) provides estimates of surface precipitation by incorporating an evaporation model below cloud base to calculate how much precipitation may reach the surface. This study focuses on using new CloudSat precipitation products to characterize the large-scale surface precipitation in the southeastern Pacific region of marine stratocumulus clouds and provide context for understanding the existing global precipitation climatologies.
2. Data
2.1. Space-borne measurements
The measurements used for this precipitation climatology are retrieved from CloudSat and CALIPSO observations and focus on the region 0–30°S, 70–100°W in the southeastern Pacific region dominated by marine stratocumulus clouds. The CloudSat CPR operates at 94 GHz and has a minimum detectable signal of about −30 dBz (Tanelli et al 2008), while the CALIPSO Cloud-Aerosol Lidar with Orthogonal Polarization (CALIOP; Winker et al 2003) measures backscattering signals at 532 and 1064 nm. CloudSat and combined CloudSat-CALIPSO retrieval products have an approximate 1.4 km × 1.8 km horizontal resolution and 250 m vertical resolution. Marine low clouds are identified using the combined CloudSat 2B-GEOPROF-LIDAR cloud mask product (Mace et al 2009). The 2B-GEOPROF-LIDAR cloud mask combines the significant echo mask from the radar-only 2B-GEOPROF product (Marchand et al 2008) with the LiDAR vertical feature mask (VFM; Vaughan et al 2009) for a merged cloud mask that identifies up to five vertical cloud layers for each CPR profile.
Precipitation in low clouds is identified using the 2C-PRECIP-COLUMN (Haynes et al 2009) rain likelihood mask. The 2C-PRECIP-COLUMN algorithm identifies the probability of a profile containing rain using the attenuation-corrected reflectivity thresholds in table 1. Contamination from ground clutter prevents the detection of rain when it originates in the lowest two atmospheric bins, or below about 720 m. Studies of this region (e.g., Bretherton et al 2010, Rahn and Garreaud 2010, Wood and Bretherton 2004) show that boundary layer depth is typically about 1 km near the coast of South America and increases away from the coast, suggesting that precipitation originating below 720 m is likely a relatively infrequent occurrence.
Table 1. CloudSat 2C-PRECIP-COLUMN likelihood of precipitation based on attenuation-corrected reflectivity.
| Precipitation likelihood | Z range (dBz) |
|---|---|
| Rain possible | −15 to −7.5 |
| Rain probable | −7.5–0 |
| Rain certain | >0 |
Low cloud precipitation is quantified using the new CloudSat 2C-RAIN-PROFILE (Lebsock and L'Ecuyer 2011) rainfall retrieval product. This product employs the reflectivity profile with a path integrated attenuation constraint in an optimal estimation framework to retrieve the profile of precipitation water and an estimate of surface rainfall. To overcome some of the limitations of earlier CloudSat precipitation products, the 2C-RAIN-PROFILE retrieval incorporates moderate resolution imaging spectroradiometer (MODIS) visible optical depth measurements to provide a climatologically consistent constraint on cloud water, assumes drop size distributions more suitable for warm rain, and includes corrections for multiple-scattering effects. Another improvement that is especially important in the southeastern Pacific is the addition of a model for evaporation of precipitation below cloud base that is based on the Comstock et al (2004) model developed for this region. In the case of precipitation, the evaporation model is applied to the bottom of the lowest layer of detectable hydrometeors (third range bin above the surface). This retrieval framework exploits the sensitivity of the CloudSat CPR to provide an unprecedented look at not only the frequency of low cloud precipitation, but also an estimate of its intensity.
2.2. In situ measurements
Measurements from the VAMOS Ocean-Cloud-Atmosphere-Land Study Regional Experiment (VOCALS-REx; Wood et al 2011) C- and W-band radars on the NOAA R/V Ronald H. Brown are used to validate the CloudSat rainfall distributions.
The W-band radar is a vertically-pointing 94 GHz motion-stabilized radar with a sensitivity of −33 dBz at 2 km and 25 m range resolution (Moran et al 2011). The measurements from the W-band radar have been motion-corrected to remove any residual effects of the ship movement and are used to compute the frequency of near-surface precipitation.
Precipitation statistics from the C-band radar are also compared to the CloudSat 2C-RAIN-PROFILE precipitation statistics. The C-band radar onboard the R/V Ronald H. Brown is a scanning 5.36 cm radar that measured radar reflectivity and Doppler radial velocity at 11 elevation angles within a 60 km radius of the ship during VOCALS-REx. This comparison uses reflectivities that are interpolated on a 250 m Cartesian grid for the layer from 0 to 500 m. To eliminate surface clutter contamination, only data outside of 25 km range of the radar are used in this comparison. Rain rates are computed from the reflectivity–rainfall (Z–R) relationships described by Comstock et al (2004) for reflectivity below 27.5 dBz and held constant above 27.5 dBz. Further description of these data are found in Burleyson et al (2012).
2.3. GPCP precipitation climatology
The CloudSat climatology of precipitation in this region is also compared to the latest version (V2.2) of the GPCP monthly merged rainfall dataset (Huffman et al 2009). This product blends multiple observational datasets to produce monthly estimates of precipitation on global 2.5° × 2.5° grid. The monthly GPCP product combines Special Sensor Microwave Imager (SSM/I) precipitation estimates and microwave adjusted infrared cloud top precipitation estimates to produce a multisatellite estimate. This satellite estimate is then adjusted by the large-scale average surface rain gauge precipitation and the gauge-adjusted satellite estimate is combined with the gauge analysis to produce the monthly merged GPCP rainfall product.
3. Methods
For this analysis, a CPR profile is considered to be cloudy if at least one cloud layer is detected by 2B-GEOPROF-LIDAR. If the cloud top height of the highest layer identified as containing cloud is below 3 km, the profile is considered to contain low cloud. Each of the low cloud CPR profiles is then screened for precipitation using the 2C-PRECIP-COLUMN precipitation occurrence flag. Clouds are classified based on their attenuation-corrected near-surface reflectivity as indicated in table 1 (Haynes et al 2009). For the majority of this analysis, only clouds identified as 'rain certain' are used since the quantitative precipitation retrievals are only performed when rain is considered certain. Each profile identified as precipitating low cloud is used in determining the frequency of shallow precipitating clouds that is defined as the number of low precipitating clouds identified relative of to the total number of observations in a 2° × 2° region. Precipitation frequency is computed for the entire period of observation, as well as seasonally. Because CloudSat is in a sun-synchronous orbit with an approximate 13:30 local equatorial crossing time, the full diurnal cycle cannot be observed. However, with the ascending orbits during the daytime and descending orbits during the nighttime, day/night differences in precipitation frequency are also explored. CloudSat-estimated precipitation frequency is also compared to estimates from the VOCALS-REx shipboard W-band radar. Estimates of precipitation incidence from the in situ W-band are computed using the near-surface Z with the same thresholds as the CloudSat 2C-PRECIP-COLUMN precipitation incidence flag indicated in table 1.
Once a CPR profile is identified as a low precipitating cloud, precipitation is quantified using the 2C-RAIN-PROFILE rain rate product. To calculate the mean precipitation rate (in mm d−1) for each 2° × 2° grid box, the retrieved precipitation rates are averaged over all observations, including profiles containing no cloud or non-precipitating cloud. Cloud-conditional and rain-conditional precipitation rates are also calculated by averaging the precipitation rates over all cloudy observations and all precipitating observations, respectively. Mean precipitation rates are computed over the entire observational period, seasonally, and diurnally (day/night).
One caveat that must be addressed is the inability of the CloudSat radar to observe clouds near the earth surface due to contamination of the reflectivity profile by the surface return or 'clutter'. Tanelli et al (2008) developed an algorithm to estimate and remove the surface return which allows the radar to distinguish cloud within the third bin (approximately 720 m) above the surface (see 2B-GEOPROF R04 quality statement at www.cloudsat.cira.colostate.edu/dataICDlist.php?go=list&path=/2B-GEOPROF). Many clouds in this region may have tops below 720 m that the CALIPSO LiDAR will detect, but the radar will not be able to identify them as precipitating. Over the study region, the fraction of low clouds in the 2B-GEOPROF-LIDAR dataset that are identified by the radar is 46.8%, with the remaining clouds being detected by the LiDAR. However, of these undetected clouds, 47.9% have tops that lie above the clutter and only 5.3% lie near the surface within the clutter. Figure 1 shows spatial distribution of the fraction of low clouds that are missed by the radar and those that are missed because they lie within the clutter. The great majority of low clouds that go undetected by the radar are missed because their reflectivity is lower than the minimum detectable signal, not because they lie within the clutter. We note that while the clutter influence on the domain average cloud detection statistics is small, it can be locally as large as 40% near the coasts where the boundary layer is shallow. Some of these 'clutter' clouds may precipitate and will not be accounted for in the climatology presented here. In addition, there may also be clouds that are shallow enough such that only the tops of the clouds are above the clutter return. In these cases, the precipitation estimate could be biased low since it will be based on reflectivity near the cloud top, rather than near the base where precipitation-sized drops are more concentrated. Bretherton et al (2010) show that median LiDAR cloud base heights from VOCALS-REx are around 1000 m near the coast and 1200 m between 80 and 85°W, with the 10th percentile no lower than about 700 m from 70 to 85°W, which suggests that this is not likely to significantly effect the climatology presented here.

Figure 1. (a) Fraction of low clouds missed by the CloudSat CPR and (b) fraction of low clouds missed due to ground clutter.
Download figure:
Standard imageTo estimate the how frequently clutter clouds precipitate and the potential effects on the regional climatology, cloud water path (W) from the advanced microwave scanning radiometer for EOS (AMSR-E) (Hilburn and Wentz 2008) is used as a statistical metric for the occurrence of surface precipitation and drizzle. The relationship for the probability of precipitation (POP) as a function of W, is developed using the clouds above the clutter. Making the assumption that the relationship between POP and W is the same for clouds above the clutter and those within it, the fraction of clutter clouds that contain drizzle or surface precipitation (fmissed) is approximated in equation (1) as the integral of the POP weighted by the probability distribution of W (PDFW) observed within the clutter,
Analysis for this region suggests that a relatively modest 0.6% of the 'clutter' clouds produce surface precipitation and only 3.6% contain drizzle. Nonetheless these missed precipitation occurrences will be weighted geographically towards the coast as indicated in figure 1 and may obscure spatial patterns found in this study.
4. Results
4.1. Validation
During the VOCALS-REx, there were no direct matchups between CloudSat profiles and the shipborne C- or W-band radars in precipitating low clouds. To validate the CloudSat 2C-RAIN-PROFILE precipitation retrieval in this region, the distribution of retrieved rain rates is compared to the full diurnal distribution of VOCALS-REx shipborne C-band radar-estimated rain rates and W-band near-surface precipitation incidence based on the CloudSat precipitation incidence reflectivity criteria in table 1. Depending on the precipitation incidence criteria, the W-band radar estimates 1%–3% of low clouds produce precipitation that reaches the surface. The CloudSat retrievals within ±5° of the 20°S, 85°W area heavily sampled during VOCALS-REx from October to November 2008 agree well, with estimates of ∼2% of low clouds producing surface precipitation.
Figure 2 shows the relative frequency distributions of surface and near cloud base (∼720 m) rain rates within ±5° of the 20°S, 85°W from CloudSat and the in situ C-band radar rain rates estimated from the interpolated 0–500 m layer reflectivity. Given the different beam resolutions and spatial and temporal sampling differences between the in situ radar and CloudSat CPR, differences between the distributions are expected. Comparison of the CloudSat near surface and in situ radar reflectivity distributions (not shown) shows CloudSat reflectivity peaks within 2 dB of the in situ C-band reflectivities, but has more frequent lower reflectivity values, which is not surprising given CloudSat's larger sampling volume and the higher minimum detectable signal of the C-band radar. Despite these sampling differences, the shape of the precipitation distributions is similar, with the 2C-RAIN-PROFILE cloud base retrievals and C-band estimates peaking near 3.34 and 3.65 mm d−1, respectively. The CloudSat cloud base rain rate distribution has relatively fewer low rain rates with a slightly longer tail at higher rain rates than the C-band radar, however after application of the evaporation model, the CloudSat surface rain rate distribution is more in the line with the C-band estimates at higher rain rates. The C-band estimates generally lie between the CloudSat surface and cloud base rain rate curves, with the differences likely due to evaporation. Sensitivity tests show that for a typical moderate drizzle case, an error of 100 m in cloud base results in approximately 8% error in CloudSat-estimated surface rain rate. It should also be noted that an equally important source of uncertainty is the coupling of the assumed drop size distribution with the evaporation model, which may result in errors as large as 30% (Lebsock and L'Ecuyer 2011). A deeper discussion of the 2C-RAIN-PROFILE retrieval uncertainties can be found in the aforementioned paper.
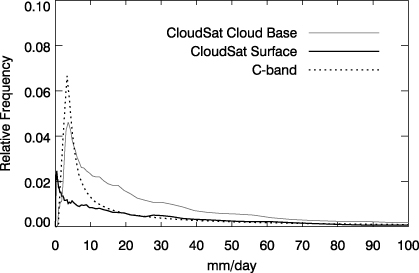
Figure 2. CloudSat 2C-RAIN-PROFILE cloud base (solid, gray), surface (solid, black) and C-band (dotted) rain rate relative frequency histograms.
Download figure:
Standard imageConditional and area average rain rates during VOCALS-REx are shown in table 2. Again, the CloudSat surface and near-base estimates are within the range of the ±2 dBz uncertainty of the C-band 0–500 m layer estimates. The range of CloudSat surface to cloud base area average rain rates, 0.1–0.25 mm d−1, respectively, also agree very well with the range of EPIC area average, 0.1–0.4 mm d−1, surface rain rate estimates of Comstock et al (2004).
Table 2. Daily rain conditional and area average rain rate (mm d−1) from the C-band radar and CloudSat during VOCALS-REx.
| Rain rate | C-band −2 dBz | C-band | C-band +2 dBz | CloudSat surface | CloudSat base |
|---|---|---|---|---|---|
| Conditional | 3.3 | 4.7 | 6.6 | 4.4 | 10.9 |
| Area average | 0.13 | 0.18 | 0.25 | 0.10 | 0.25 |
It should also be noted that, although not shown here, the CloudSat 2C-RAIN-PROFILE estimates are greatly improved from the older 2C-PRECIP-COLUMN rainfall product. Due to algorithm differences and the fact that it did not incorporate an evaporation model, the older 2C-PRECIP-COLUMN product greatly overestimates precipitation in this region, resulting in a peak rain rate frequency an order of magnitude too large at 17 mm d−1, and an area average rain rate of 0.49 mm d−1, twice as large as the CloudSat 2C-RAIN-PROFILE or the in situ range of estimates in table 2.
4.2. Precipitation climatology
Results from the identification of precipitating low clouds using the CloudSat 2B-GEOPROF reflectivity profiles and 2C-PRECIP-COLUMN 'rain certain' category are shown in figure 3(a). These data suggest that in the area of peak precipitation up to 9% of these low clouds are producing precipitation that may be reaching the surface. Relaxing the 'rain certain' criteria to 'rain probable' yields a higher frequency of precipitation, however, given the typical thermodynamic environment below cloud base in this region, it is likely that precipitation detected using the 'rain probable' category would evaporate before reaching the surface. To illustrate this, figure 3(b) shows the ratio of surface to near cloud base precipitation. Assuming that the evaporation model is accurate, for most of the region well over 50% of precipitation is estimated to evaporate before reaching the surface. This is not to imply that the evaporated precipitation does not play an important role. While the focus here is on estimating surface precipitation, evaporated precipitation may have important implications for the vertical structure of atmospheric heating and redistributing the moisture within the atmospheric column.
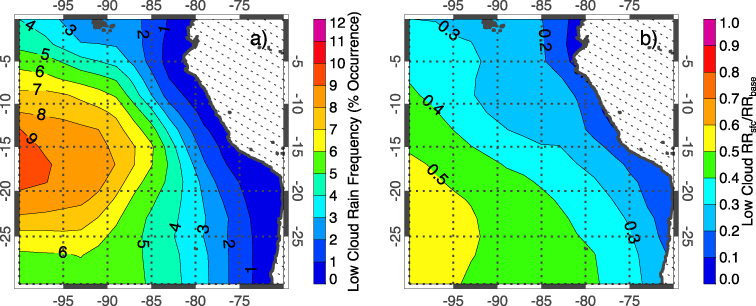
Figure 3. CloudSat 2C-RAIN-PROFILE estimates of (a) surface precipitation frequency in low clouds and (b) the ratio of surface rain rate to cloud base rain rate.
Download figure:
Standard imageThe panels in figure 4 show the category of precipitation that reaches the surface as either drizzle or light rain. The majority of the precipitation in this region is drizzle (figure 4(b)), with over 70% of precipitation observations below 4.8 mm d−1. Light rain (>4.8 mm d−1; figure 4(a)) increases in frequency further away from the coast along the eastern boundary of this region in the area of transition from stratocumulus to cumulus and in the southwestern corner and along the northern boundary associated with South Pacific Convergence Zone (SPCZ) and the Intertropical Convergence Zone (ITCZ), respectively.
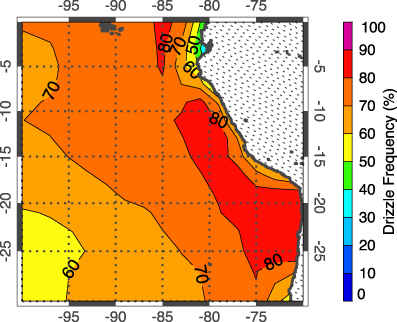
Figure 4. CloudSat 2C-RAIN-PROFILE estimates of the frequency of drizzle (≤4.8 mm d−1).
Download figure:
Standard imageThe CloudSat 2C-RAIN-PROFILE rain conditional rain rates (mm d−1) from low clouds in the southeastern Pacific region for the period 2006–10 are shown in figure 5(a). Average rain conditional rain rates increase from east to west in this region, with the precipitation rate maximum occurring in the western portion of the domain where cumulus convection is more common and the boundary layer is deeper. Daily area average precipitation (mm d−1) is shown in figure 5(b). Precipitation amounts from low clouds peak along the western side of the region, north of the area of highest precipitation intensity. Examination of figures 3 and 4 shows the reason for this offset between rain conditional rain rates and daily area average rain rate. The area average rain rates peak in the region where precipitation has relatively high frequency combined with moderate rain rates or is dominated by very frequent drizzle. Precipitation occurs much less frequently in the area with the highest rain conditional rain rates.

Figure 5. CloudSat 2C-RAIN-PROFILE estimates of the (a) conditional rain rate (mm d−1) and (b) area average rain rate (mm d−1).
Download figure:
Standard imageAs previously mentioned, there are a number of assumptions that may lead to uncertainties in the retrieved rain rate. For the range of rain rates in figure 5(a), uncertainties in retrievals range from about 80–150% (Lebsock and L'Ecuyer 2011). Because uncertainty increases with decreasing rain rate, the climatological uncertainties in conditional rain rate are largest close to the coast where precipitation rates are very low. However, the correspondence between CloudSat and the C-band conditional and area average rain rates during VOCALS-REx lends some confidence in the satellite retrieval performance.
4.3. Diurnal precipitation
A number of studies (Wood et al 2002, Kollias et al 2004, Comstock et al 2005, Leon et al 2008, Serpetzoglou et al 2008) have observed significant diurnal cycle variability in low cloud properties and precipitation from marine low clouds. While we are unable to resolve the full diurnal cycle with sun-synchronous satellite measurements, we can make some assertions about day/night differences by separating the CloudSat observations into ascending (day) and descending (night) orbits. The results of this separation, shown in figure 6, confirm the aforementioned previous in situ studies and show that 60–80% of precipitation occurs during the nighttime CloudSat observations. In the region of most frequent precipitation, CloudSat estimates suggest that 60–70% of the observed precipitation occurs at night. Daytime precipitation is relatively more frequent in the southwestern corner of this region influenced by the SPCZ with up to 40% of precipitation occurring during the day.
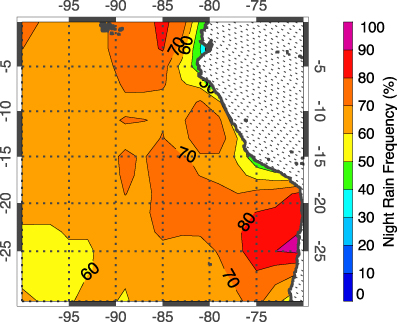
Figure 6. CloudSat 2C-RAIN-PROFILE estimates of the nighttime frequency of precipitation as a percentage of the total precipitation occurrence.
Download figure:
Standard imageExamination of the observations within ±5° of 20°S, 85°W region in figure 6 shows between 75 and 80% of precipitation occurs at night. Comparing the CloudSat observations for October and November to the subset of VOCALS-REx in situ C-band observations within ±1 h of the typical CloudSat overpass times shows agreement of nighttime precipitation frequency near 85%. However, comparison of the CloudSat observations to the full diurnal cycle of C-band observations shows that CloudSat's limited sampling may slightly overestimate the frequency of nighttime precipitation. Examination of the full diurnal cycle with the in situ data shows that only 71% of the overall precipitation occurs at night. Within ±1 h of CloudSat nighttime (daytime) overpasses, the C-band hourly average precipitation frequency is 7% (0.8%) per hour of total diurnal precipitation, but the overall average nighttime (daytime) precipitation frequency is 5.8% (2.5%) per hour. The in situ observations shows that precipitation is most frequent between 2:00 and 3:00 am local time near the typical time CloudSat of nighttime overpasses in this region. These results suggest that area average precipitation accumulations may also be overestimated since CloudSat tends to oversample precipitation at night when precipitation is most frequent.
Although not shown here, both daytime and nighttime precipitation rates have patterns very similar to the conditional rain rate map in figure 5(a). Results show that in the regions dominated by drizzle, the average precipitation rates are only slightly higher during the nighttime overpasses. Alternately, along the northwestern and southwestern edges of the region influenced by the ITCZ and SPCZ, respectively, light rain is more frequent and average daytime rain rates are higher. This is consistent with previous studies (Albright et al 1985, Shin et al 1990, Sui et al 1997, Nesbitt and Zipser 2003) showing a secondary peak in convection in the ITCZ and SPCZ regions in the afternoon. Although these studies mostly focused on cold-topped clouds, because we are including clouds with tops up to 3 km, in these regions we are likely also including developing convective clouds rather than open cell stratocumulus.
While the regional mean conditional rain rates are similar between day and night overpasses, area average rain rates are much lower during the day. Daytime area average rain rates are 0.15 mm d−1, but nearly twice as high at 0.29 mm d−1 for night overpasses. Comparison of the CloudSat and C-band observations within ±5° of 20°S, 85°W during VOCALS-REx in table 3 show similar differences, but again illustrate the CloudSat sampling limitations. Consistent with the results for precipitation frequency, in situ area average rain rates are higher at night and lower during the day near the CloudSat overpass times compared to full diurnal cycle sampled by the C-band.
Table 3. Daytime and nighttime area average rain rate (mm d−1) from the C-band radar and CloudSat during VOCALS-REx.
| Area average rain rate | C-band full diurnal cycle | C-band near overpass times | CloudSat surface | CloudSat base |
|---|---|---|---|---|
| Day | 0.11 | 0.04 | 0.04 | 0.10 |
| Night | 0.24 | 0.28 | 0.16 | 0.39 |
4.4. Seasonal precipitation
A significant seasonal cycle in low clouds (Klein and Hartmann 1993, Lin et al 2009, Wang et al 2011) and drizzle (Leon et al 2008, Painemal et al 2010) has been shown by a number of previous studies in marine stratocumulus regions. Most studies have shown an increase in cloud amount, liquid water path, and drizzle in June–August (JJA) with a peak in September–November (SON). Examination of the seasonal cycle of precipitation estimates from CloudSat in figure 7 shows results similar to these previous studies demonstrating that precipitation occurs on average more frequently in the austral winter and spring months. However, CloudSat measurements also indicate significant variability within this region. In the southeastern portion of this region off the coast of Chile, a greater fraction of the annual precipitation occurs in austral summer and fall. Just off the west coast of Peru, the greatest fraction of precipitation occurs in JJA with the largest fraction of annual precipitation shifted toward the west in SON. Figure 8 summarizes these results for the entire region. The greatest overall precipitation occurrence is in JJA, dominated by the region near the coast of Peru with SON following closely. The colors on the bar indicate the percentage of the seasonal precipitation that falls as drizzle or light rain. It is evident that the majority of the seasonal variability is due to the substantial increase in the drizzle frequency in the austral winter and spring. Light rain in clouds below 3 km that falls mostly along the boundaries of the domain is fairly consistent throughout the year.

Figure 7. CloudSat 2C-RAIN-PROFILE estimates of percentage of total number of annual precipitation observations in (a) MAM, (b) JJA, (c) SON, and (d) DJF.
Download figure:
Standard image
Figure 8. CloudSat 2C-RAIN-PROFILE estimates of percentage of total number of annual precipitation observations in each season for the entire region broken down by fraction of drizzle (light gray) and light rain (dark gray) observations.
Download figure:
Standard imageAlthough not shown, seasonal precipitation rates were also analyzed but the seasonal variability in rain rate is much smaller than the variability in precipitation frequency. Rain conditional rain rates increase from east to west in all seasons similar to that shown in figure 5. A slight increase in rain rate is observed along the northern boundary in DJF and MAM associated with shallow convection identified when the ITCZ moves further south. Conditional rain rates also have a slight increase during these same months, however the frequency of clouds is also much lower. Because of this, area average rain rates for the domain only range from 0.2 to 0.26 mm d−1 across the seasons.
4.5. Comparison with GPCP
To illustrate the importance of the new precipitation retrievals from CloudSat, they are compared to the GPCP climatology in figure 9. Because there is no way to distinguish between low clouds and deep convection in GPCP data, they are compared to the CloudSat (all cloud) precipitation climatology. Figure 9 shows that CloudSat underestimates precipitation in the convergence regions, where it is likely that heavy precipitation associated with deep convection saturates the signal at CloudSat's millimeter wavelength. There is also a slight underestimate in precipitation in the southeastern corner of the domain that aligns with the small region of 'clutter' clouds shown in figure 1, suggesting that there may be some missed precipitation within the clutter. However, much more precipitation is evident from CloudSat in the regions where figure 3(a) shows low cloud surface precipitation is most frequent. In regions of figure 9(c) where CloudSat shows more precipitation than GPCP, low clouds comprise at least 70% of the distribution of clouds. GPCP relies heavily on the passive microwave and infrared satellite measurements in this region, which biases the precipitation to areas where deep convection is common. Since the passive microwave retrievals are mostly based on the ice scattering signature and the infrared index is based on clouds with cold cloud tops, these precipitation retrieval techniques and thus, GPCP, do not have as much sensitivity to warm cloud precipitation that is common in this region. While these differences are not surprising given the sensitivities of the measurements used by GPCP, it is generally the benchmark satellite precipitation climatology used for climate model evaluation, even in stratocumulus transitions regions (e.g., Teixeira et al 2011). The large differences in figure 9 in the transition region demonstrate the potential importance of incorporating the CloudSat precipitation retrievals for both climate model evaluation and in studies to understand the role of precipitation in stratocumulus transitions.
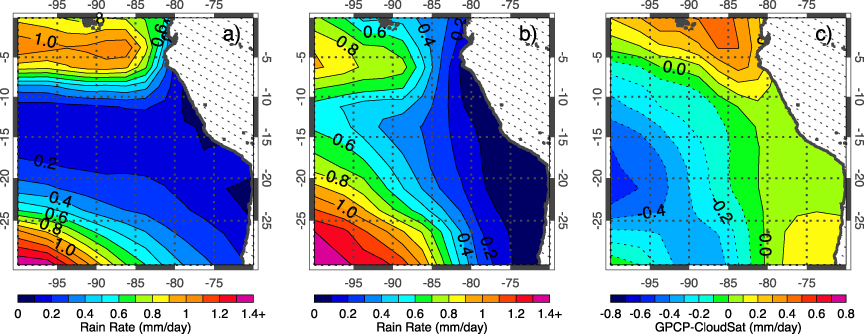
Figure 9. (a) GPCP and (b) CloudSat regional precipitation climatology in mm d−1. (c) Difference between GPCP and CloudSat precipitation climatologies in mm d−1.
Download figure:
Standard image5. Discussion
A climatology of low cloud precipitation is presented for the first 4.5 years of CloudSat measurements. Comparisons with in situ radar measurements from VOCALS-REx show good agreement on the frequency and distribution of precipitation in this region. Over 70% of the precipitation in this region is classified as drizzle, with an increase in frequency of light rain in low clouds in the ITCZ and SPCZ regions. The area average rain rate from CloudSat in this region is ∼0.22 mm d−1, that also agrees well with in situ estimates. Conditional average rain rates increase from east to west, with the highest rain rates occurring in the region influenced by the SPCZ. The highest area average rain rate is slightly north of the conditional rain rate maximum and is coincident with the region of most frequent precipitation.
Consistent with past studies of low clouds, the CloudSat precipitation climatology exhibits both strong diurnal and seasonal variability. Nearly 75% of precipitation observations occur during the nighttime overpasses with a small area of enhanced daytime precipitation in the region influenced by the SPCZ. In regions dominated by drizzle, nighttime rain rates are also slightly higher than during the day, however in areas of more frequent light rain, the daytime rain rates exceed those at night. A significant seasonal cycle in precipitation is also observed.
Precipitation, especially drizzle, is generally most frequent in JJA and SON. Comparison with GPCP shows little precipitation in the region of the CloudSat-estimated maximum low cloud precipitation. While the sampling strategy of CloudSat limits its utility on shorter timescales, these results illustrate the utility of incorporating the CloudSat measurements into the long-term precipitation climatology.
The new CloudSat 2C-RAIN-PROFILE precipitation retrieval provides a much-needed quantification of precipitation in regimes dominated by low clouds that have long been underestimated in global precipitation climatologies. A better understanding of low cloud precipitation is paramount to understanding its role in cloud microphysical, macrophysical, and radiative properties. This understanding is complicated by the fact that on an individual cloud scale, precipitating clouds tend to have larger liquid water paths and particle sizes, however precipitation is also hypothesized to play an important role in the formation of pockets of open cells (POCs) (Stevens et al 2005) through the depletion of cloud liquid water. This may in turn reduce the cloud fraction and increase the amount of solar radiation reaching the surface and provide a positive feedback on temperature. A number of studies have suggested as SST increases, a transition in cloud type, from more stratiform clouds to cumulus clouds may occur due to a change in the inversion strength or an increase in decoupling of the boundary layer. This could also potentially expand the transition area observed along the western boundary in this study further east with perhaps a shift from a drizzle-dominated regime to more frequent light rain. Because most climate models do not incorporate feedbacks of precipitation on the properties of clouds, it casts a shadow of doubt over whether climate models can adequately simulate low marine stratocumulus clouds and their radiative effects.
While this paper is focused on surface precipitation to put these new estimates into the context of other global precipitation climatologies, the estimates here are actually more of a lower bound on the role of precipitation may play in marine stratocumulus regions since many of these clouds are producing precipitation that evaporates before it reaches the surface. Leon et al (2008) estimates that 19%–34% of clouds below 4 km in subtropical stratocumulus regions may be producing precipitation. This implies an even larger role of interactions between precipitation processes, cloud dynamics, and cloud microphysics that will be the subject of future investigations.
Acknowledgments
This research was sponsored by NASA Grants NNX10AM21G and NNX12AC51G. Matthew Lebsock's contribution was performed at the Jet Propulsion Laboratory, California Institute of Technology, under contract with the National Aeronautics and Space Administration. All relevant CloudSat products were obtained through the CloudSat Data Processing Center at http://cloudsat.cira.colostate.edu. The authors thank Sandra Yuter and Matthew Miller for providing the VOCALS C-band reflectivity and rain rate histograms used for comparison in this paper. The authors also thank Chris Fairall and NOAA ESRL for providing the W-band motion-corrected radar reflectivity profiles.