
Abstract
Precise and accurate estimates of silicate mineral weathering rates are crucial when setting policy targets for long-term forest sustainability, critical load calculations and assessing consequences of proposed geo-engineering solutions to climate change. In this paper, we scrutinize 394 individual silicate mineral weathering estimates from 82 sites on three continents. We show that within-site differences of several hundred per cent arise when different methods are used to estimate weathering rates, mainly as a result of uncertainties related to input data rather than conceptually different views of the weathering process. While different methods tend to rank sites congruently from high to low weathering rates, large within-site differences in estimated weathering rate suggest that policies relying on quantitative estimates based upon a single method may have undesirable outcomes. We recommend the use of at least three independent estimates when making management decisions related to silicate mineral weathering rates.
Export citation and abstract BibTeX RIS
1. Introduction
Silicate mineral weathering is a cornerstone ecosystem service. The biological, chemical and physical dissolution of the silicate rocks which comprise 90% of Earth's crust is the ultimate source of most essential plant nutrients including phosphorus and base cations (BC; i.e. calcium, magnesium, sodium and potassium). Other processes including atmospheric deposition, litter fall, release from organic matter and fertilization only recycle mineral weathering products (Ouimet and Duchesne 2005). Precise and accurate estimates of silicate mineral weathering rates are vital for defining polices to meet environmental targets for forestry and agriculture (Kuylenstierna et al 2001, Sverdrup and Rosén 1998); long-term sustainability (Azar et al 1996) and achieving cost-effective control of soil and surface water acidification (Hodson and Langan 1999, Skeffington 2006 and McDonnell et al 2010). In addition to influencing the chemical composition of all soils, freshwaters and oceans (Roelandt et al 2010), weathering is also a driver of atmospheric CO2 concentrations over geological time-scales (Brady 1991, Hilley and Porder 2008). Anthropogenically enhanced weathering has been proposed as a countermeasure to mitigate increasing atmospheric CO2 concentrations (Köhler et al 2010).
Obtaining accurate estimates of weathering rates is difficult because weathering is a slow process that occurs over very long periods of time (Hatton et al 1987, Palviainen et al 2012). Management decisions related to plant growth (Kuylenstierna et al 2001, Sverdrup and Rosén 1998) and ecosystem ability to buffer acid deposition (Hodson and Langan 1999, Skeffington 2006, McDonnell et al 2010) rely on creditable estimates of silicate mineral weathering rates. However, several studies have questioned the use of single estimates of silicate mineral weathering rates because of large associated uncertainties (Kolka et al 1996, Starr et al 1998, Hodson and Langan 1999, Whitfield et al 2006). For example, the uncertainty range in seven different published silicate weathering rates at a single catchment was significantly greater than the expected difference in BC removal associated with different forest harvest scenarios (Klaminder et al 2011b), calling into question the utility of weathering estimates as an effective tool for forestry management. Some of this variability occurs because estimation methods differ substantially in their boundary conditions (depth of the weathering zone); spatial (pedon versus catchment) and temporal (contemporary environment versus historic) scales and assumptions regarding the processes which drive weathering; hence, there will always be inter-method biases in weathering rate estimates. Nevertheless, decisions need to be made for mitigating acid deposition, sustainable forest harvesting and assessing the feasibility of geo-engineering projects. When making such decisions, it is of crucial importance to recognize the bias associated with different weathering rate estimates derived from single approaches and what implications such biases might have.
To assess the magnitude and sources behind differences in available estimates of silicate mineral weathering rates, we assembled a data set of published BC weathering and release rates to address the following questions: (i) what is the range of published BC weathering and release rates for individual sites; (ii) what are the sources of variability in estimated rates of BC weathering and release; (iii) how many weathering rate estimates are needed to achieve an acceptable level of precision at a single site and (iv) how do MAGIC and PROFILE, two of the most commonly used weathering models, differ in their predictions? We compiled available peer-reviewed literature data including 394 individual silicate mineral weathering rate estimates from 82 poorly buffered, silicate mineral dominated locations across the world where at least three published estimates of BC weathering or release were available.
2. Materials and methods
2.1. Site selection
A literature review was conducted using Web of Science and Google Scholar to identify sites and studies where multiple BC weathering and release rate estimates were available from the same location. When a published candidate study was identified, papers cited by or citing the study were also examined. All locations included in the analysis presented here are sites where we have concluded that silicate minerals were the pre-dominant weathering source (primary carbonate minerals were absent), weathering rates were relatively low, were at risk of anthropogenic acidification and at least three published estimates of BC weathering or release were available (table SI 1, available at stacks.iop.org/ERL/7/024025/mmedia). Sites dominated by carbonate minerals, or studies where one model merely was used to constrain another weathering estimates, were excluded from the analysis. Data were either extracted from tables or digitized from figures in the original papers.
2.2. Methods for estimating weathering rates
The studies included in this analysis presented estimates of BC weathering and release rates which had been obtained in several different ways including PROFILE (Sverdrup and Warfvinge 1993), pedological mass-balances (PMB; Ouimet 2008), the compositional trends method (CTM; von Enyatten et al 2003), catchment mass-balance (Köhler et al 2011), MAGIC (Cosby et al 2001), SAFE (Warfvinge et al 1993), SMART (Vries et al 1989) and Pnet-BGC (Gbondo-Tugbawa et al 2001). Detailed information about each method can be found in the cited references, but a brief overview of the most commonly used methods follows below.
PROFILE is a steady-state model of soil acidification simulating mineral weathering in one or more soil layers based on physical and chemical principles. Estimates of field weathering rates are based on modeled BC fluxes at the soil boundary (deposition and plant uptake), where field proxies including mineralogy, soil texture and their relationship to laboratory estimates of mineral dissolution rates, are used to estimate in situ weathering rates (Sverdrup and Warfvinge 1993).
The PMB method is based on the depletion of BC in surface soil layer in comparison to deeper soil layers. Weathering rates are estimated by calculating historic net losses of BC by interpreting the ratio between BC and immobile constituents of the weathered soil in comparison to the parent material as indicative of mass losses of BC. Typically titanium or zirconium are used as immobile constituents and the calculations take into account vertical changes in soil bulk density, composition and soil volume (Ouimet 2008). The CTM (von Enyatten et al 2003) is similar to the PMB in that it summarizes compositional changes between weathered and un-weathered material.
Catchment mass-balance estimates of BC release rates are typically based on small catchment studies and are estimated as the difference between inputs from deposition and output in stream water, where chloride is used as a conservatively tracer through the catchment. BC release rates are estimated from deposition inputs, concentrations in stream outflow and chloride concentrations in precipitation and stream outflows (Köhler et al 2011).
MAGIC is a dynamic, lumped-parameter biogeochemical model of soil acidification which has often been used to simulate long-term patterns in soil solution chemistry and BC release (Cosby et al 2001). Because PROFILE is often used to determine initial weathering rates for MAGIC model applications, MAGIC-estimated BC release values were only included if it was clear that weathering rates had not first been estimated using PROFILE.
2.3. Resolving the research questions
The distribution of BC weathering and release rates used in this study was strongly skewed but approximated a log-normal distribution. Therefore, all estimates of BC weathering and release were log10 transformed prior to analysis. The relative range in weathering rate estimates at individual locations (research question 1), was calculated as the maximum log10 transformed rate minus the minimum. Log transformed data were then standardized within a location by subtracting the individual log10 transformed rates from the average of log10 transformed rate. While the 'true' BC weathering and release rate cannot be determined using models, the geometric mean value of estimates for each location was used as the best estimate of the true value. We assessed the deviation of an individual weathering rate estimate from the best estimate as the absolute value of the standardized individual rate estimate.
To assess the sources of variability in estimated rates of BC weathering and release (research question 2) we assumed that the observed variability at an individual site arose from three different factors: (i) uncertainties in data inputs; (ii) model structure and (iii) parameter values used in model runs. Data uncertainty arises from different sources and types of field and laboratory input data used to make the estimates, which includes duration of weathering, quality of mineralogical data and the use of laboratory versus field information. The contribution of data uncertainty to overall variability in BC weathering and release rates was assessed using data from Kolka et al (1996) and van der Salm (2001). van der Salm (2001) compared weathering rates estimated using laboratory measurements of mineral dissolution, measured and normative mineralogy. Kolka et al (1996) used linear or exponential functions to estimate annual rates of BC depletion.
Parameter uncertainty often arises from equifinality, i.e. multiple ensembles of parameter values that all produce credible estimates. Results from published studies were used to quantify the importance of parameter uncertainty including (i) average prediction ranges when all parameters were allowed to vary in PROFILE applications at three sites (Jönsson et al 1995); (ii) a Markov chain Monte Carlo analysis of the MAGIC parameter space for a single site (MacDougall et al 2009) and (iii) a sensitivity analysis of PMB-estimated weathering rates at three sites when all inputs were allowed to vary by ±20% (Ouimet and Duchesne 2005).
In order to determine the number of estimation methods needed to generate an acceptable level of precision in BC weathering and release rate estimates for an individual location (research question 3), we used a Monte Carlo approach in which we generated ensembles of samples of size n = 2, 3, 4, 5 or 10 from the population of the 394 weathering estimates. Ensembles were generated by sampling with replacement 250 000 times and the geometric mean value of estimates for each location was again used as the best estimate of the true weathering rate.
Structural uncertainty arises from different conceptualizations of weathering processes and the manner in which they are represented in models (i.e. use of MAGIC versus PROFILE; research question 4). One major structural uncertainty in weathering estimates discussed by Klaminder et al (2011b) relates to the assumed weathering depth. Two published data sets were available to assess the structural uncertainty relating to the assumptions about weathering depth on weathering rates. In the first, PROFILE simulations were made to soil depths of both 50 and 100 cm (Langan et al 1996) while in the second, MAGIC-estimated rates of BC release for soils (defined as the solum) and watersheds (defined as solum plus regolith and assumed to include deeper weathering below the rooting zone) were compared (Ouimet and Duchesne 2005).
3. Results
We found substantial variability in BC weathering and release rates estimated using different methods at individual locations (figure 1). The differences in BC weathering and release rates between log10(Max) and log10(Min) at each site had a minimum of 0.055 and a maximum of 1.7 with a median value of 0.77. This equates to a median difference of ∼600% between maximum and minimum estimated weathering rates. Approximately 34% of the sites had maximum estimates exceeding the minimum weathering rate estimates by more than 10 times. Clearly, this large variation illustrates that without a well-defined set of criteria for choosing a method of estimating weathering rates, a high degree of uncertainty will result. There was no relationship between number of rate estimates reported at individual sites and variability in the estimate. Approximately 44% of the weathering rates were between 0.6 and 1.8 times the mean value for a site; an additional 34% were between either 0.2–0.6 or 1.8–5 times the site mean.
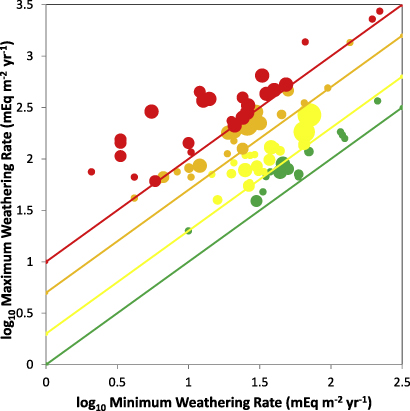
Figure 1. Plot of log10 transformed maximum versus minimum published weathering rates for each site. Symbol size is proportional to the number of weathering rate estimates for a site, where the largest size indicates n = 8 and the smallest n = 3. The green, yellow, orange and red lines show 1:1, 2:1, 5:1 and 10:1 ratios between maximum and minimum weathering rates respectively. The green, yellow, orange and red symbols are used to illustrate the number of sites that correspond with the 1:1, 2:1, 5:1 and 10:1 ratios between maximum and minimum weathering rates. The average difference between log10(Max) and log10(Min) is 0.77, which can be back-transformed to an average difference of 5.9 times between maximum and minimum weathering rates.
Download figure:
Standard imageEstimated sources of uncertainty contributing to overall variability of BC weathering rate estimates were quantified and partitioned into individual sources. The relative magnitude of different sources of uncertainty increased as follows: structural uncertainty (including depth of the weathering zone) < parameter uncertainty < input data uncertainty (table 1). The contribution of data uncertainty to overall variability in BC weathering and release rates was high (69–135 times) when laboratory data were used (data, overall in table 1). Similar estimates of the effect of using different data sets from the same site on prediction ranges were reported to give 8–9 times difference in estimated weathering rates (data, non-laboratory in table 1). The estimated contribution of model parameter uncertainty to overall variability related to PROFILE and MAGIC were relatively small ranging from 1.7 to 2.1 for the two models, respectively. For PMB, the parameter uncertainty resulted in a range in the weathering estimate of 8.6 times. Although an inter-comparison of uncertainties in model parameters between different studies should be avoided, the results indicate that model parameter values are an important source of uncertainty. The estimated contribution of structural uncertainty relating to the depth of the weathering zone indicated a 2X difference in BC weathering and release rates, where rates doubled as deeper soil depths were used (table 1).
Table 1. Estimates of the magnitude of different sources of uncertainty in weathering estimates. Parameter uncertainty ranges are estimated as the ratio of published 95 percentile divided by 5 percentile. For all other types of uncertainty, range is either the mean estimated prediction range (for paired t-tests and ANOVA); t/F is the t- or F-statistic at df degrees of freedom and p is the probability. Study reports the data source.
| Source | Range | t/F | df | p | Study |
|---|---|---|---|---|---|
| Structural, two-way ANOVA comparing different models in which data from the same sites where different BC weathering and release rates were used; results are stratified by solum (rooting zone) and watershed (whole catchment) | |||||
| Models, solum | 1.5 | 0.434 | 5, 5 | 0.8166 | Ouimet and Duchesne (2005) |
| Models, watershed | 1.3 | 3.03 | 2, 2 | 0.158 | Ouimet and Duchesne (2005) |
| Depth of weathering zone, paired t-test | |||||
| PROFILE at 50 or 100 cm | 2.2 | −2.7 | 7 | 0.015 | Langan et al (1996) |
| Same methods for solum or watershed | 2.0 | −9.0 | 11 | < 0.001 | Ouimet and Duchesne (2005) |
| Parameter, Monte Carlo estimates of uncertainties based on varying parameter values for a single model at a single site | |||||
| PROFILE, deviation from best estimate, all parameters | 2.1 | Jönsson et al (1995) | |||
| MAGIC, MCMC calibration | 1.7 | MacDougall et al (2009) | |||
| PMB, all variables | 8.6 | Ouimet and Duchesne (2005) | |||
| Input data (overall), two-way ANOVA on log10 transformed data of weathering estimates in which the same method was applied to different data sets obtained at the same site | |||||
| PROFILE with three data sets | 135 | 1756.4 | 7, 2 | < 0.001 | van der Salm (2001) |
| Batch release with three adjustments | 69 | 1837.5 | 2, 2 | < 0.001 | Kolka et al (1996) |
| Input data (non-laboratory), two-way ANOVA on log10 transformed data | |||||
| PROFILE, excluding lab | 9.4 | 4505.2 | 1, 1 | < 0.001 | van der Salm (2001) |
| Batch release, excluding lab | 7.8 | 804.5 | 1, 1 | < 0.001 | Kolka et al (1996) |
To determine whether or not different methods ranked sites congruently from high to low weathering rates within a region, we assembled data from the seven most extensive studied sites, each including up to eight weathering methods at numerous sites (table 2). A two-way rank ANOVA was performed to test whether or not different estimation methods ranked weathering rates congruently across sites. In five of seven studies where different weathering rate estimation methods were applied to a series of sites, a similar rank ordering of weathering rates was observed (table 2).
Table 2. Summary of significance of site effects from two-way ANOVAs on rank weathering. P-values < 0.05 are indicative of a significant site effect, i.e. the ensemble of methods predicted similar rank-ordered weathering rates across sites. Here '# sites' indicates the number of sites at which weathering rates were estimated while '# methods' indicates the number of methods used.
| Study | # Sites | # Methods | P |
|---|---|---|---|
| Duan et al (2002) | 10 | 5 | 0.0048 |
| Ouimet and Duchesne (2005) | 3 | 8 | 0.0004 |
| Kolka et al (1996) | 5 | 7 | 0.2697 |
| Stutter et al (2003) | 21 | 3 | 2 × 10⁻⁸ |
| Thornton (2001) | 5 | 3 | 0.0042 |
| Whitfield et al (2006) | 5 | 5 | 0.0983 |
| van der Salm (2001) | 8 | 7 | 0.0038 |
Precision in weathering rate estimates could be increased substantially as the number of members in an ensemble of weathering rate estimates increase, suggested by the outcome of our Monte Carlo simulation (figure 2). A single weathering rate estimate was estimated to be within a factor of 3 (i.e. between 33% and 300%) of the best estimate < 80% of the time. An ensemble of three estimates was calculated to be within a factor of 2 approximately 80% of the time, while ten estimates were calculated to be within a factor of 1.5 approximately 80% of the time.
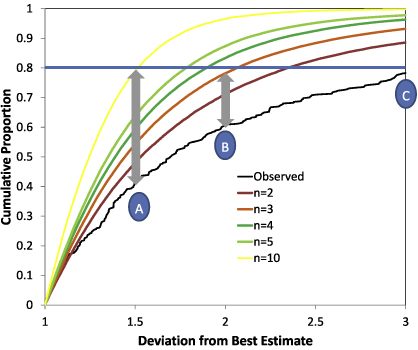
Figure 2. Cumulative proportions of distributions of deviations from the best estimate of true weathering rates using geometric mean values from ensembles of weathering rate estimates. The observed distribution (in black) is based on all the 394 measured values used in this study. As ensemble of 10 estimates is able to achieve a precision of 1.5 times the best estimated value about 80% of the time (A) and a single estimate only achieves this level of precision about 40% of the time. A single estimate is likely to be within a factor of 2 about 60% of the time, while an ensemble of three estimates will be within a factor of 2 just under 80% of the time (B). A single estimate is never predicted to be within a factor of 3 (300%) of the best estimate (C).
Download figure:
Standard imagePROFILE-estimated weathering rates and MAGIC-simulated BC release rates were available for 30 sites (figure 3). A paired t-test comparing log10 estimated weathering rates for the two models showed on average log10 MAGIC estimates rates were on average 0.35 (2.2 times) higher than log10 PROFILE estimates (t = 4.76, p ≤ 0.01, SE = 0.074, lower95 = 0.2, upper95 = 0.5).
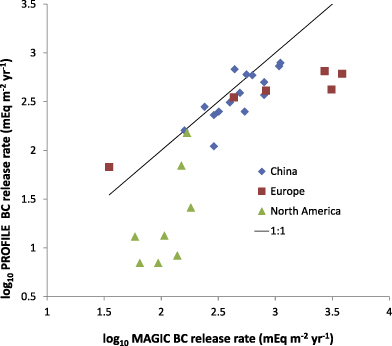
Figure 3. MAGIC- and PROFILE-estimated BC release rates from 30 sites where both models had been applied in North America (green triangles), Europe (red squares) and China (blue diamonds). Note that European estimates display a greater range of MAGIC-estimated rates than PROFILE while North American estimates show the opposite pattern. Estimates from China (Duan et al 2002) follow the 1:1 line most closely.
Download figure:
Standard image4. Discussion
This synthesis indicates that there is a significant difference between methods estimating silicate weathering rates (figure 1), supporting previously raised concerns about the usefulness of using data derived from single methods as a basis for land management decisions (Hodson and Langan 1999, Langan et al 2001, Skeffington 2006, McDonnell et al 2010). However, the differences between methods can to a large extent be identified and attributed in an increasing order of relevance to structural uncertainties (including depth of the weathering zone) < parameter uncertainty < input data uncertainty. In other words, while assumptions about key processes and the manner in which BC are released contributes to total uncertainty as part of a structural component, greater uncertainties are associated with the assumptions made about data and parameter values to use when estimating weathering rates. We highlight this finding and suggest that, in contrast to previous suggestions (Klaminder et al 2011b), the largest source of uncertainty can be related to input data and not to different conceptual understanding of the weathering process. This conclusion is especially problematic when attempting to up-scale point scale measurements using individual or a few soil samples to model weathering and BC release rates for an entire catchment or even region.
Despite large discrepancies in absolute values of weathering rates estimated by different methods, most rank relative weathering rates between sites in a similar way, which is very encouraging (table 2). In other words, if the main goal is to identify sites with relatively low or alternatively relatively high weathering rates, then single estimates from any of the reviewed methods will be informative. The two models which have been most widely used to make assessments of weathering rates for environmental decision making are MAGIC (Cosby et al 2001) and PROFILE (Sverdrup and Warfvinge 1993). These two models represent the landscape in different ways. PROFILE provides estimates for a shallow one-dimensional soil pedon whereas MAGIC integrates weathering processes for the whole catchment including deep soil weathering. Therefore, lower weathering rate estimates are expected from PROFILE in comparison to MAGIC, considering that deep soil weathering could constitute an important source of BC in catchment weathering (Klaminder et al 2011a), which is also the general resulting trend (figure 3). As indicated in our analysis of sources of differences between estimates of weathering rates (table 1), differences in the depth of the weathering zone are unlikely to be the main explanation for the discrepancy but rather uncertainties in the input data. However, it is very encouraging that PROFILE (pedon based) and MAGIC (watershed based) rank site BC weathering rates similarly, considering their frequent use.
The large ranges in weathering rates reported by different studies at a given site are commonly the result of estimates made using the mass-balance method. This is not surprising given the age of most of the soils in the studies and the difficulties in sampling the deepest horizon. For example, Duan et al (2002) highlight the important role of secondary minerals in old soils since the formation of secondary minerals may lead to erroneous weathering rate estimates when Ca and Mg are accumulated in B horizons. Other large observed ranges in our assembled data set are due to the occurrence of clays of undefined stoichiometry and their role in weathering (Kolka et al 1996, Langan et al 1996, van der Salm 2001).
One key finding from this work is that precision in weathering rate estimates increases as the number of members in an ensemble of weathering rate estimates increases (figure 2). A single weathering rate estimate will be within a factor of 3 (i.e. between 33% and 300%) of the best estimate < 80% of the time. An ensemble of three estimates will be within a factor of 2 approximately 80% of the time, while ten estimates be within a factor of 1.5 approximately 80% of the time. This suggests that single estimates of weathering rates must be interpreted with extreme caution. Ensembles of three estimates may provide a minimum acceptable level of precision but likely still not sufficiently precise to support management decision making.
5. Management implications
Many well established decisions about environmental management rely on precise and accurate silicate mineral weathering rate estimates. In both Europe and North America, estimates of acceptable levels of acid deposition and forest management recommendations have all been based on single model results of BC weathering rates using a critical loads concept (Akselsson et al 2007, Menz and Seip 2004). The credibility of these calculations has been questioned due to uncertainty in estimated weathering rates (Hodson and Langan 1999, Langan et al 2001, Skeffington 2006, McDonnell et al 2010). While there are substantial differences between weathering estimates at a given site (figure 1), the credibility of estimates would be significantly improved if ensembles (n ≥ 3) of weathering rates were used in critical load calculations. Decreasing uncertainty of input data would further improve calculations of critical loads (table 1).
Uncertainties in silicate mineral weathering rates were likely less of a problem for policymakers during the 1980s. Despite the substantial uncertainty in estimates of both acid deposition and weathering rates, it was clear that the effects of the large amount of acid deposition in many regions could not be offset by the relatively small, albeit uncertain weathering rate. This was clearly manifested by negative environmental impacts of acid deposition on soils and surface waters across large regions of northern Europe and northeastern North America. With present deposition load, which has decreased dramatically in recent decades (Skjelkvåle et al 2005, Fowler et al 2007), forest uptake is currently the dominant BC sink in many regions (Akselsson et al 2007). The importance of this sink will probably be enhanced by shorter rotation times for forest harvesting that are to be expected in a future warmer and wetter climate (Laudon et al 2011). With a greater pressure on forests as an alternative to fossil fuels, new management strategies including whole-tree harvesting (all above-stump tree biomass) and full-tree harvesting (all tree biomass including the stump) as well as an increased use of fertilizers and genetically improved seedling stocks are being implemented. All of these strategies have the potential to cause BC removal from forest soils faster than they can be replaced through mineral weathering. The external pressure on BC sustainability of forest soils and surface waters will shift from being a regional problem caused by long-range atmospheric transport of air pollution to a more local issue caused by excessive forest harvesting. This paradigm shift in the causality of BC depletion underscores the need for scientifically sound forest management guidelines and hence weathering rate estimates. Whereas environmental managers during the acid deposition era merely could observe, or at best stop the symptoms of soil and water acidification, the likelihood of unacceptable levels of BC depletion can be minimized by avoiding intensive forestry practices in the most sensitive areas. Here, all reviewed methods can play an important role in identifying these sensitive areas. However, in order to reach these goals better measures of weathering rate are greatly needed as uncertainties associated with currently used methods are unacceptably large.
Using an ensemble approach which includes multiple estimates of BC weathering and release rates at a single location using multiple independent estimation methods is the only credible way forward with present modeling tools for making decisions related to BC cycling and environmental sustainability. Estimates should be classified according to their scale (pedon versus catchment based), soil age (importance of secondary minerals for weathering) and the role of clays in general (mineral stoichiometry). Ensembles of BC weathering and release rate estimates produce more realistic results and provide some estimate of uncertainty. Only by using ensembles of comparable results (i.e. pedon or watershed based), can managers and decision makers produce credible quantitative estimate of local sensitivity to BC losses caused short and long term by changes in climate, air pollution and land use.
6. Conclusions
Management decisions made on the basis of single weathering rate estimates should be interpreted with a great deal of caution. There are large uncertainties associated with silicate mineral weathering rates. However, these uncertainties can be reduced through better input data, an improved appreciation of the conceptual differences between estimation methods and the use of ensembles of weathering rate estimates. Better input data based on more extensive field sampling will reduce uncertainty in weathering rate estimates The two most widely used models for management decision making, MAGIC and PROFILE, can give widely different weathering rate estimates, mainly due to differences in their conceptual approach. However, they can give similar rankings for weathering rates across sites. As precision increases with larger ensembles of weathering rate estimates, we recommend the use of three independent estimates to provide a minimum acceptable level of precision.
Acknowledgments
This research was funded by the MISTRA Future Forests program and the FORMAS ForWater strong research environment. We are grateful to D Kothawala, S Löfgren and anonymous reviewers for comments which improved the manuscript.