
Abstract
Most sources of atmospheric dust on Earth are located in the Northern Hemisphere. The lower dust emissions in the Southern Hemisphere in part limit the supply of micronutrients (primarily soluble iron) to the Southern Ocean, thereby constraining its productivity. Climate and land use change can alter the current distribution of dust source regions on Earth. Can new dust sources be activated in the Southern Hemisphere? Here we show that vegetation loss and dune remobilization in the Southern Kalahari can promote dust emissions comparable to those observed from major contemporary dust sources in the Southern African region. Dust generation experiments support the hypothesis that, in the Southern Kalahari, aeolian deposits that are currently mostly stabilized by savanna vegetation are capable of emitting substantial amounts of dust from interdune areas. We show that dust from these areas is relatively rich in soluble iron, an important micronutrient for ocean productivity. Trajectory analyses show that dust from the Kalahari commonly reaches the Southern Ocean and could therefore enhance its productivity.
Export citation and abstract BibTeX RIS
1. Introduction
Atmospheric dust affects the radiative properties of the atmosphere, hydrological (Ramanathan et al 2001) and global biogeochemical cycles (Martin 1990, Mahowald et al 2005), and human health (Griffin and Kellogg 2004). The atmospheric entrainment, transport and deposition of mineral dust connect land surface processes in source regions to ecosystem dynamics in depositional areas over land or in the ocean (Martin 1990, Mahowald et al 2005). Iron (Fe) is the limiting micronutrient in high nutrient low chlorophyll (HNLC) regions of the ocean, where productivity is in large part constrained by iron, of which wind-borne atmospheric dust is believed to be a major supplier (Duce and Tindale 1991, Okin et al 2011).
Northern Hemisphere sources account for more than 90% of global dust emissions (Ginoux et al 2001, Li et al 2008). The relative lack of sources in the Southern Hemisphere limits the supply of micronutrients (e.g., soluble iron) to the Southern Ocean thereby in part constraining its biological productivity (Martin 1990, Martin et al 1994, Cassar et al 2007). The dependence of productivity on mineral dust inputs in this and other HNLC ocean regions has been suggested to explain the lower levels of atmospheric CO2 during glacial maxima, when dust loads in the atmosphere were higher (Martin 1990, Mahowald et al 1999).
Although, currently, the contribution of dust emission from the Southern Hemisphere is relatively low, we hypothesize that reductions in vegetation cover due to land use or climate change provide the potential for new source areas to emerge. The activation of new dust sources under regional land use and global climate change scenarios has seldom been investigated because potential new sources are by definition still inactive and difficult to detect in satellite images. Overall, the relative dust potential of currently stabilized wind-erodible soils is difficult to assess before extensive areas are devegetated. For example, in relatively recent years deforestation and overgrazing in Patagonia (McConnell et al 2007), and persistent droughts and land use in Australia's deserts (Hesse and Simpson 2006) have contributed to increased wind erosion and dust mobility in the Southern Hemisphere (Mitchell et al 2010, Johnson et al 2011).
It has been observed that with climate change scenarios such as increased drought and intensification of winds, dune activity in the Southern Kalahari has the potential to increase (Thomas et al 2005). More recently, this hypothesis has been challenged on the basis of model-based analyses of wind drift potential and precipitation (Ashkenazy et al 2011), which indicate that the Kalahari dunes will remain stable. However, it has been shown that enhanced dune activity was observed during the 1980s when rainfall was 50% of the mean for the 30 yr period after 1960 (Bullard et al 1997). There are signs of contemporary dune surface activity, especially on the crests, and incipient dune remobilization as a result of vegetation loss from drought and overgrazing (Wiggs et al 1995, Thomas and Leason 2005, Thomas et al 2005). Sand dune areas are traditionally considered to be poor dust sources due to their lack of a dust-sized sediment supply. Intense dust emissions on Earth are primarily associated with topographic depressions and basins of internal drainage (e.g., Prospero et al 2002). Indeed, in Southern Africa the depressions of the Makgadikgadi and Etosha pans are recognized as the major dust sources in the region (Prospero et al 2002, Washington et al 2003, Bryant et al 2007). There is, however, some evidence that sand dunes can also emit dust following disturbance (e.g., Bullard et al 2008, Strong et al 2010), especially dunes that have remained stable for a long time and have accumulated dust-sized particles via atmospheric deposition, weathering, and their generation by occasional abrasion (Bullard et al 2007).
Here we use a dust impact generator to determine the relative dust potential of soil samples from linear dune crests and interdunes in the Kalahari, and sediments from the Makgadikgadi and Etosha pans (figure 1). Moreover, we assess the soluble iron content in dust-sized fractions obtained from the soil samples, and use air parcel trajectory (APT) analysis to determine whether and how frequently dust emissions from a Southern Kalahari source could reach the iron-poor waters of the Southern Ocean.
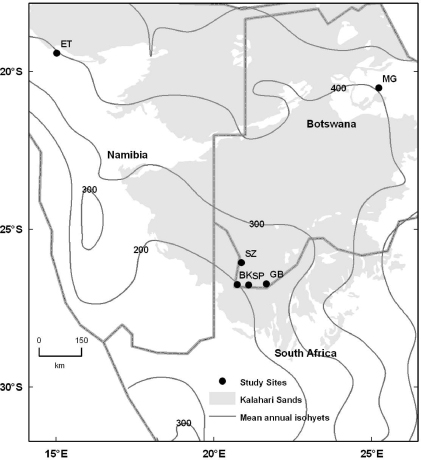
Figure 1. Map of Southern Africa. The study sites (table S1 available at stacks.iop.org/ERL/7/024001/mmedia) were located in Bokspits (BK), Spaarwater (SP), Gakhibane (GB), Struizendam (SZ), Makgadikgadi pans (MG) and Etosha pans (ET). Mean annual isohyets at intervals of 100 mm of annual precipitation are also reported. The Kalahari sand areas receiving less than 200, 250 and 300 mm yr−1 are 26 465 km2, 87 073 km2 and 172 850 km2, respectively.
Download figure:
Standard image2. Methods
Soil samples from the top 5 cm of dunes, and interdunes were collected at four sites in the Southern Kalahari as well as in the Etosha and Makgadikgadi pans (figure 1). Three replicates were used for each site. The samples were collected at sites with different land use practice (overgrazed communal land, managed leased ranch).
2.1. Dust generation
While, active dust sources can be assessed with remote sensing, the determination of potential dust sources that could be activated by vegetation loss under regional environmental change scenarios requires an analysis of the soil properties and their dust generating potential. To this end, we used a dust generator, an apparatus designed to quantify in relative terms the different amount of dust that can be generated by soils sampled in different areas. The dust generator used in this study was built at the USDA-ARS wind erosion lab in Lubbock, TX (Singer et al 2003, Gill et al 2006). Each test was performed on 25 g of soil sample placed in a 2.5 cm × 2.5 cm aluminum tube, 50 cm long. The sample tube rotates 13 times per minute with a 4 s pause after each 180° rotation. When the tube is in motion, the sediment repeatedly falls to the base of the tube, thereby generating dust. Dust laden air is drawn by a vacuum pump at a rate of 0.014 m3 min−1 from the dust generator into a settling chamber 45 cm tall with a 30 cm square base. The settling chamber is fitted with a dust sensor attached to an aerosol spectrometer (Grimm®, Model 1.108), which provides real time measurements of dust concentrations within different size classes. The data units recorded by the Grimm spectrometer are in particle count per liter for particles ranging between 0.3 and 20 µm in diameter. The aerodynamic diameter, Da, of the particle was calculated as

with ρ' being the specific gravity and c, a shape factor. The specific gravity of soil from dunes is 2.65. The sediments from pans are high in silt content so, the specific gravity is 2.70 and a shape factor of 0.9 was used. The volume of the particles was then multiplied by average particle count per liter, to express the particle concentration in volume per liter (μm3 l−1) for different size ranges. The volume was then converted to mass by multiplying by the specific gravity. The units PM10(particulate matter less than 10 µm in diameter) and PM2.5(particulate matter less than 2.5 µm in diameter) are reported in table 1 in mg m−3.
Table 1. PM10 (mg m−3) and PM2.5 (mg m−3) values from dust generation measurements (with ±1 standard deviation).
| Site | PM10 (mg m−3) | PM2.5 (mg m−3) | % PM2.5 |
|---|---|---|---|
| Bare dune | |||
| Struizendam | 12.00 ± 1.25 | 1.74 ± 0.45 | 14.5 |
| Spaarwater | 10.79 ± 3.56 | 1.51 ± 0.80 | 14.03 |
| Gakhibane (bare) | 22.78 ± 3.46 | 3.70 ± 1.00 | 16.24 |
| Vegetated interdune | |||
| Bokspits | 212.79 ± 35.12 | 23.72 ± 4.30 | 11.15 |
| Gakhibane | 244.10 ± 102.41 | 12.08 ± 4.75 | 4.95 |
| Struizendam | 261.89 ± 81.47 | 16.78 ± 6.55 | 6.41 |
| Vegetated dune crest | |||
| Bokspits | 58.21 ± 12.69 | 4.35 ± 0.83 | 7.47 |
| Spaarwater | 65.09 ± 2.32 | 3.65 ± 0.88 | 5.61 |
| Gakhibane (recovery) | 31.99 ± 11.65 | 3.98 ± 1.48 | 12.43 |
| Pans | |||
| Etosha | 788.88 ± 23.17 | 43.93 ± 1.08 | 5.57 |
| Makgadikgadi | 814.05 ± 120.53 | 46.27 ± 6.21 | 5.68 |
2.2. Forward trajectory analysis
A trajectory model (HYSPLIT, Hybrid Single-Particle Lagrangian Integrated Trajectory) (Draxler and Rolph 2003) was used to calculate the terminal points of the 7-day forward trajectories of air parcels originating from a point within the Southern Kalahari and the Makgadikgadi pan. We used 7-day forward trajectory following the approaches of Wagener et al (2008) and Buck et al (2010), as well as recent estimates of the residence time of dust in the atmosphere (Han and Zender 2010). The trajectories were run every day at 5 UTC for years, 1999–2009. To this end, we used GDAS1 (Global Data Assimilation System) archives for years between 2006 and 2009, and the NCEP/NCAR global reanalysis dataset for years 1999–2005. We used two different starting heights for the parcel, namely 500 (for both the Southern Kalahari and the Makgadikgadi pan) and 750 m a.s.l. (only for the Southern Kalahari).
2.3. Soluble iron content
Soil samples from interdunes and pans were sieved through a 45 μm sieve to separate the dust-sized particles from the Kalahari. Soil fractions less than 45 μm were then analyzed for total soluble iron (FeTs) and soluble ferrous (Fe(II)) ion as in Zhu et al (1997) with the main difference that dust was not sampled as aerosol particulate in air filters but by sieving the potentially dust-emitting soil. Soluble ferrous ion, Fe(II), the most bioavailable form of iron, was extracted by using 0.25 g of dust in 10 ml of 0.5 M HCl. The solution was shaken for an hour, and then filtered to eliminate particulate matter. The pH of the aliquot was increased to 5.5 by adding an acetate buffer. Then, 0.1 M ferrozine was added to the solution to measure Fe(II) content spectrophotometrically using a Shimadzu® 4100 UV photospectrometer at 562 nm (Stookey 1970, Zhu et al 1997). FeTs was measured using the same method as above after Fe(III) reduction by adding 0.01 M hydroxylamine hydrochloride (Zhu et al 1997).
3. Results
The dust emission potential of soil samples from the Southern Kalahari (figure 1) is greater on vegetated dune crests than bare dune crests (figure 2(a) and table 1). PM10 concentrations obtained with dust generator measurements were on average 51.8 mg m−3 for samples from vegetated dunes, and 15.2 mg m−3 for bare dune crests. PM10 from vegetated interdune samples is on average much higher (239.6 mg m−3) than those from either bare or vegetated dune crests. The vegetated interdune values are about 30% of those obtained for the Etosha (PM10 = 814.1 mg m−3) and the Makgadikgadi (PM10 = 788.9 mg m−3) pans, the two major dust sources in the region. The PM10 values from the pans were both greater but comparable to dust generator results for Aral Sea playa sediments (Singer et al 2003). A similar pattern is found for PM2.5 values, though in this case the dust yield from interdunes increases to almost 40% of the pans.
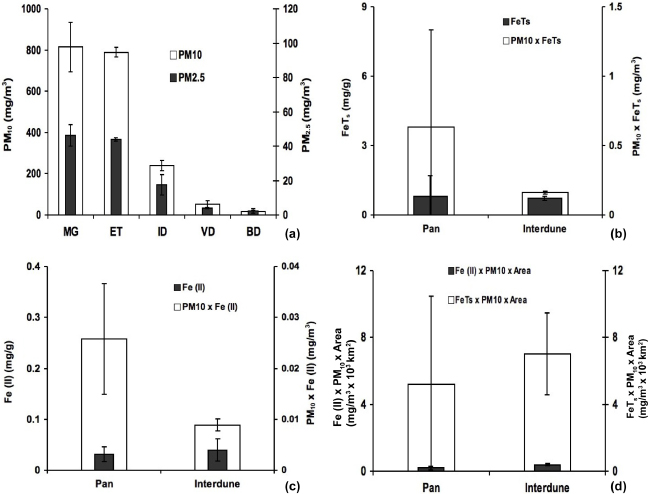
Figure 2. (a) PM10 and PM2.5 concentration from dust generation experiments ±1 standard deviation. (b) Total soluble Fe (±1 standard deviation) in mg g−1 for the pans (Makgadikgadi and Etosha pans) and interdunes (Bokspits, Struizendam and Spaarwater) (gray bars). FeTs values multiplied by PM10 concentrations (white bars). (c) Fe(II) (±1 standard deviation) in mg g−1 for the pans and interdunes (gray bars). Fe(II) values multiplied by PM10 concentrations (white bars). (d) FeTs × PM10 value from (b) (white bar) and Fe(II) × PM10 values from (c) (gray bars) for both pans and interdunes multiplied by the area of the pans and interdunes (white bars).
Download figure:
Standard imageIn the fine sediment fraction (less than 45 µm), the contents (mg g−1) of soluble ferrous, Fe(II) (figure 2(b)) and total soluble iron, FeTs (figure 2(c)) are not significantly different between interdunes and pans (table 2). To account for the differences in dust generating potential of surfaces, a measure of their 'iron-in-dust potential' was created by multiplying the iron contents by PM10 values for interdunes and pans. As the dust concentration value for the pans is higher than for the interdunes, the iron content in the dust is considerably greater from the pans, for both Fe(II) and FeTs (figures 2(b) and (c)).
Table 2. Iron content (ferrous ion, Fe(II) and total soluble iron, FeTs) in mg g−1 of soil samples from interdunes and pans.
| Site | Fe(II) (mg g−1) | FeTs (mg g−1) |
|---|---|---|
| Bokspits | 0.049 | 0.814 |
| Struizendam | 0.038 | 0.664 |
| Gakhibane | 0.031 | 0.662 |
| Etosha | 0.042 | 1.439 |
| Makgadikgadi | 0.020 | 0.154 |
For an assessment of iron-in-dust potential at a regional scale, it is necessary to factor in the contributing area of each (potential) dust source surface type. To this end, the iron-in-dust potential value for pans was then multiplied by the areas of the Makgadikgadi and Etosha pans. The contributing area for interdunes was assumed as half of the dunefield region most susceptible to reactivation, determined as the portion of the Kalahari dunefields with mean annual rainfall less than 250 mm yr−1 (figure 1). When considering the spatially adjusted measures of potential iron-in-dust yield, the contribution of the interdunes increases substantially (figure 2(d)). The potential iron-in-dust emission from the interdunes exceeds that of the pans.
Can these new potential emissions play an important role in the fertilization of the Southern Ocean? It depends both on the soluble iron content and on how far south the Kalahari dust is deposited. Figure 3(a) shows the spatial distribution and latitudinal variation of the end points of 7-day air parcel trajectories originating at 500 m a.s.l. from the Southern Kalahari for the period 1999–2009. These data reveal a significant transport pathway from the Southern Kalahari to the Southern Ocean, with 26% of the trajectories reaching locations south of 40° Lat S within a 7-day period of transport. A comparison between long range transport potential during the dry (April–September) and wet (October–March) seasons shows that a greater number of trajectories (33%) travel beyond 40°S in the dry period when conditions are likely to favor emission (e.g., Bryant et al 2007), though in this season (austral winter) light is likely the major limiting factor to productivity of the Southern Ocean. To investigate the sensitivity of these results to the initial height, we started the trajectory calculations both at 500 m a.s.l. (e.g., Begum et al 2005, Davis et al 2010), and at 750 m a.s.l. from a point within the Southern Kalahari and found no significant difference in the spatial distribution of terminal points (figure 3(b)). Figure 3(c) shows the spatial distribution and latitudinal variation of the 7-day forward trajectories initiated from the Makgadikgadi pan. The geographic location of the Makgadikgadi pan (approximately 6° North of the Southern Kalahari) hinders the transport of dust to the Southern Ocean as only 15% of the trajectories travel south of 40° Lat S. On the other hand, land cover change could activate new dust sources in Australia and Argentina or strengthen existing ones (e.g. the Mallee, Lake Eyre Basin or Northern Patagonia (Mitchell et al 2010, Johnson et al 2011)) that are even closer to the Southern Ocean than the Kalahari dunes.

Figure 3. The spatial distribution of terminations of the 7-day trajectories originating in the Southern Kalahari initiated at (a) 500 m a.s.l. and (b) 750 m a.s.l. and (c) the Makgadikgadi pan at 500 m a.s.l. Based on HYSPLIT model calculations for 1999–2009, with the star marking the adopted origin for modeled air parcels. The percentages are calculated with the total number of terminations in a 5° × 5° grid. The histogram shows the frequencies of trajectory terminations grouped into 10° latitude bins.
Download figure:
Standard image4. Discussion
The loss of vegetation cover—as an effect of intensified grazing pressure (Thomas and Twyman 2004) and/or climate change—and the associated reactivation of the Kalahari dunefield after millennia of inactivity (Thomas and Leason 2005, Thomas et al 2005) may result in an important new dust source in the Southern Hemisphere. Our results show that interdune sediments contain a supply of fine dust material as also found by other studies of grain-size variations on Kalahari dunes (Lancaster 1986, Livingstone et al 1999).
The notion that dust emission from vegetated interdunes and dunes could be comparable to that of the major dust sources in Southern Africa, however, is made with certain assumptions. These relate to the extent of stabilized dunefields susceptible to reactivation and the dynamics of dust emissions. Although remote sensing of predominantly vegetated dunefields has identified them as sometimes-active sources, primarily following disturbance to their vegetation cover (Bullard et al 2008), these dunefield surfaces do not emit consistently from the same area. In fact, dust emissions from dunes following loss of vegetation are probably not sustained over the long term from the same area because the sediments of stabilized dunes do not have extensive supplies of dust-sized material and the typical processes of rapid recharge of fines are absent (e.g., large-scale delivery of fines by flooding). This means that the full extent of the dunefield could not be an active dust source at the same time, and our measure of dunefield emission potential based on its area is a maximum possible value. Furthermore, any transition of the dunefield to a potential dust source state will not occur instantaneously. With climate or land use changes in the Southern Kalahari encouraging dust emission, the dust generating potential of the dunefield would be a balance between the area becoming susceptible to dust emission, and the area of dunefield depleted of its fine sediment supply. Such a complex relationship also makes the longevity of the Kalahari dunefield as a possible dust source difficult to assess.
Under current conditions, the dust from Southern Kalahari has higher probability to travel beyond 40°S during the dry season. Recent work by Young et al (2011) shows that, at least over the oceans where windspeed can be measured in a spatially intensive way, that global average windspeeds are increasing, with the rate of change for extreme events greater than that for average winds. This result holds for the latitude of the Southern Kalahari. In addition, climate models predict a polarward migration and intensification of Southern Hemisphere winds (e.g.Kushner et al 2001, Yin 2005), potentially enhancing the delivery of iron-rich dust to the Southern Ocean in the future. The processes that lead to removal of airborne dust by wet and dry deposition are not explored in this study because there are large uncertainties associated with estimating removal via wet deposition (Mahowald et al 2005, Croft et al 2010). Also, this study does not address the ability of the intersecting precipitating clouds to alter the lifetime of airborne dust and soluble iron. Although light is the limiting factor to productivity in the Southern Ocean during austral winter, the iron-in-dust will likely serve as a reserve for the following spring. Even though the percentage of total soluble iron in Kalahari soils (table 2) may appear to be relatively low in comparison to values measured in rain and snow or aerosol samples from other regions (Fan et al 2006), the bioavailability of iron in soils from dust source regions cannot be directly compared to that in meteoric water or mineral aerosols. In fact, during airborne transport iron bioavailability is modified by photochemical reactions. Iron solubility depends also on a number of other factors, such as aerosol size, bacterial activity, and the presence of seawater iron-complexing organic ligands (Baker and Croot 2010). Therefore, the values reported here are used only to compare the iron content among different source areas.
What is causing dune mobilization in the Southern Kalahari? Thomas et al (2005) identified increased aridity as the major driver of vegetation mortality and dune activation in this region. However, overgrazing is also a major contributor to vegetation loss. It has been reported that the grazed area in the Kgalagadi district in southwest Botswana has increased from 13 000 to 32 000 km2 and the number of boreholes increased from eight to approximately 380 between 1950 and 1990s (Thomas and Twyman 2004). In the overgrazed areas bare soil increased at the expenses of perennial grasses (Perkins and Thomas 1993). Although the grazed area almost tripled in the past 50 years, most of the region still remains vegetated, which motivates the study of the possible impact of regional dust emissions.
For a range of different global circulation models, Thomas et al (2005) predict that the interdunes in the Southern Kalahari, currently the most-stabilized and fine sediment-rich parts of the dunes, will be active and therefore erodible by 2070 upon doubling of CO2 levels. Although these effects of climate change are subject to an open debate (Ashkenazy et al 2011), the compound effect of climate change (aridification) and land use patterns is likely to decrease vegetation cover and enhance regional dust emissions.
5. Conclusions
Our results show that the dune mobilization in the Southern Kalahari can activate dust emissions comparable in strength to those from existing dust sources in the region. The activation of this potential future dust source has important implications as a contributor of iron. The iron-in-dust potential determined based on laboratory-measured sediment emissivity and total source area suggests that, considering its full spatial extent, the dunefield will contribute comparable amount of iron-rich dust as the major pans in the region. Forward trajectory analysis shows that the Kalahari dust will reach the Southern Ocean and contribute to its supply of soluble iron under current conditions.
Acknowledgments
Thanks to Dean Holder, Shamika Ranasinghe, Noaa Spiekermann, Katherine Tully, Danielle Perrot, Mokganedi Tatlhego, Kebonye Dintwe and Thoralf Meyer for field and laboratory assistance; Bob Swap and Christine Bonthius for providing samples from Etosha pan; and Lixin Wang for helpful suggestions. The authors gratefully acknowledge the NOAA Air Resources Laboratory (ARL) for the provision of the HYSPLIT transport and dispersion model and/or READY website (www.arl.noaa.gov/ready.php) used in this publication. This work was supported by the National Science Foundation through Grants DEB-0717360, EAR-0746228.