

Abstract
In September–October 2015, El Niño and positive Indian Ocean Dipole conditions set the stage for massive fires in Sumatra and Kalimantan (Indonesian Borneo), leading to persistently hazardous levels of smoke pollution across much of Equatorial Asia. Here we quantify the emission sources and health impacts of this haze episode and compare the sources and impacts to an event of similar magnitude occurring under similar meteorological conditions in September–October 2006. Using the adjoint of the GEOS-Chem chemical transport model, we first calculate the influence of potential fire emissions across the domain on smoke concentrations in three receptor areas downwind—Indonesia, Malaysia, and Singapore—during the 2006 event. This step maps the sensitivity of each receptor to fire emissions in each grid cell upwind. We then combine these sensitivities with 2006 and 2015 fire emission inventories from the Global Fire Assimilation System (GFAS) to estimate the resulting population-weighted smoke exposure. This method, which assumes similar smoke transport pathways in 2006 and 2015, allows near real-time assessment of smoke pollution exposure, and therefore the consequent morbidity and premature mortality, due to severe haze. Our approach also provides rapid assessment of the relative contribution of fire emissions generated in a specific province to smoke-related health impacts in the receptor areas. We estimate that haze in 2015 resulted in 100 300 excess deaths across Indonesia, Malaysia and Singapore, more than double those of the 2006 event, with much of the increase due to fires in Indonesia's South Sumatra Province. The model framework we introduce in this study can rapidly identify those areas where land use management to reduce and/or avoid fires would yield the greatest benefit to human health, both nationally and regionally.
Export citation and abstract BibTeX RIS

Original content from this work may be used under the terms of the Creative Commons Attribution 3.0 licence. Any further distribution of this work must maintain attribution to the author(s) and the title of the work, journal citation and DOI.
1. Introduction
The thick smoke that blanketed Equatorial Asia during September–October of 2015 was likely the worst haze episode since 1997, when land use fires caused billions of dollars in damage and thousands of premature deaths (Johnston et al 2012, Marlier et al 2013). The degraded peatlands that typically burn during such episodes contain significant combustible organic material and so release large amounts of fine particulate matter (PM2.5), the leading cause of global pollution-related mortality (World Health Organization 2009, Lelieveld et al 2015). As in previous episodes, the prevailing winds in 2015 transported the smoke to densely populated areas across Indonesia and the Malay Peninsula, including Singapore and Kuala Lumpur. In this work, we identify provinces where land use policies and management strategies could most effectively mitigate the downwind smoke exposure and consequent costs to human health during such haze events. We also compare the 2015 event to another large smoke episode in 2006 in order to determine how fire emission patterns driven by land use and land cover change may be evolving.
Across Indonesia, fires are frequently used to burn agricultural residue, clear forest, or prepare land for plantations and smallholder farms. Fires also occur from vandalism and accidental ignitions (Dennis et al 2005, Gaveau et al 2014a). Fire emission levels are greatest from degraded peatlands, especially in dry years (Marlier et al 2015a, 2015b). In 2006, burning in industrial concessions to clear land for oil palm and timber plantations accounted for ∼40% of total fire emissions in Sumatra and ∼25% in Kalimantan (Indonesian Borneo) (Marlier et al 2015c). As on oil palm plantations, fire on timber plantations is used to clear native vegetation quickly and cheaply in order to establish commercial wood pulp species. Such species include fast growing trees such as Acacia, whose turnover rate is about three times faster than oil palm (∼7 years compared to ∼25 years), potentially resulting in more frequent post-harvest burning (Effendy and Hardono 2001, Feintrenie et al 2010).
As in 1997 and again in 2006, the severe haze in September–October 2015 was enabled by a combination of El Niño and positive Indian Ocean Dipole (pIOD) conditions, both of which promote drought and greatly enhance fire activity in the region, either because fuel loads are drier allowing fires to escape and burn out of control or because farmers take advantage of the dry weather and clear more land than usual (Field and Shen 2008, van der Werf et al 2008, van der Werf et al 2010, Reid et al 2012). Though the underlying meteorological triggers are similar across these extreme haze events, the spatial distributions of land cover and fire emissions are evolving rapidly, driven largely by expanding global markets for oil palm, pulpwood and timber, and by increases in small-scale agriculture (Field et al 2009, Miettinen et al 2011, Margono et al 2014, Gaveau et al 2014b, Marlier et al 2015a). A comparison between the 2006 and 2015 events is critical for (1) quantifying the contributions of specific fire source locations to smoke exposure in downwind population centers during extreme haze events, and (2) identifying possible trends in the magnitudes of these differentiated contributions over the last decade. We chose 2006 and not 1997 for this comparison since modern satellite technology (e.g., the multi-wavelength instruments on board Terra and Aqua that can capture burned area and AOD) was not available until 1999 (King et al 2003). Diagnosis of the fire emission locations that result in the greatest smoke exposures downwind can guide the design of more informed strategies to prevent or minimize recurrent haze events.
In this study, we demonstrate the potential of a new analytical framework to rapidly assess in near real-time the emission sources and health impacts of an ongoing smoke episode in Equatorial Asia. The framework, presented here all together for the first time, integrates information on (1) fire emissions related to land cover and land use (Marlier et al 2015a, 2015b, 2015c), (2) meteorological drivers of smoke transport, (3) domestic and transboundary source–receptor relationships, which quantify the sensitivity of PM2.5 concentrations in receptor areas to the specific locations of fire emissions (Kim et al 2015, Marlier et al 2015a, 2015c), and (4) health impact functions incorporating regionally specific data on mortality rates, age structure, and population. Previous efforts to quantify health impacts from biomass burning in Equatorial Asia have proven computationally expensive (e.g., Johnston et al 2012, Marlier et al 2013). In contrast, once the source–receptor relationships have been mapped, our novel framework can readily quantify smoke exposure from any given distribution of fire emissions without the need for additional computationally expensive model simulations. In this way, stakeholders can quickly identify the key emission areas contributing to that exposure and estimate the resulting morbidity and premature mortality in downwind populations, even as an extreme smoke event unfolds.
2. Methods
Below we describe the fire emissions estimates and the surface and satellite observations used in this analysis. In the supplement, we describe the GEOS-Chem adjoint used to calculate smoke exposures and the health impact calculations.
2.1. Fire emissions
We use near-real time fire emission estimates for the 2015 haze event from the GFAS, a product that was readily available for next-day processing at the time of our analysis (GFAS, http://join.iek.fz-juelich.de/macc/; Kaiser et al 2012). GFAS emissions are derived at 0.5° × 0.5° horizontal resolution from observations of fire radiative power (FRP) from the Moderate Resolution Imaging Spectroradiometer (MODIS) instruments on board the Terra and Aqua satellites. The emissions are based on observed relationships between FRP and combusted dry matter for eight land cover types based on those used in the Global Fire Emissions Database (GFED; van der Werf et al 2010), supplemented with maps of organic soil and peatlands. Here we define smoke as the sum of organic carbon (OC) and black carbon (BC) aerosol, the primary components of smoke-related PM2.5. Based on comparisons with satellite AOD, Kaiser et al (2012) recommended scaling GFAS OC and BC emissions by a global factor of 3.4. However, the Kaiser et al (2012) underestimate in modeled AOD may be partly due to model treatment of carbon aerosol in the atmosphere rather than emissions (Andela et al 2013). Somewhat arbitrarily, we instead scale the GFAS emissions up by 50%, which produces model results that better match surface observations during 2015 (section 2.2). Scaling up by 50% also yields PM2.5 emission totals for Indonesia in 2006 that match those obtained from a different emission inventory (Marlier et al 2015c). To identify sources of fire emissions, we rely on estimates of the spatial distributions of peatlands and industrial concessions in 2010, the only year for which such data are available (figure S1). We overlay these estimates onto 1 × 1 km2 MODIS FRP detections to attribute fire activity to these sources (table S1). This finer spatial scale information is necessary given the multiple types of land use and land cover within each 0.5° × 0.5° GFAS grid cell.
2.2. Surface PM observations
We compare the GEOS-Chem adjoint estimates for smoke exposure in Singapore during 2015 against observed PM2.5 concentrations for five stations in Singapore operated by the National Environment Agency (NEA; http://nea.gov.sg/). In order to isolate enhancements in surface PM2.5 due only to smoke aerosol, we first calculate the average observed PM2.5 during June (13.6 μg m−3), the earliest available measurements before the onset of the haze event. We then subtract the June average non-smoke concentration from the full time series.
2.3. Satellite observations
We also compare the adjoint smoke exposures from the 2006 and 2015 haze events to two satellite products: ultraviolet aerosol index (AI) from the Ozone Monitoring Instrument (OMI; Torres et al 2002, Torres et al 2007) and aerosol optical depth (AOD) at 550 nm from MODIS aboard the Terra satellite (Levy et al 2010). We use the Level 3 quality-assured products from both instruments, processed at 1° horizontal resolution. Both products are frequently employed to characterize smoke aerosol in Southeast Asia (Reid et al 2013, Chang et al 2015). By using two different aerosol products, we overcome some of the uncertainty associated with representing smoke optical properties in the retrievals (Zender et al 2012). We also maximize the amount of usable satellite data retrieved during the time periods of interest in an environment that is challenging to observe from space due to frequent cloudiness, lengthy coastlines, and mountainous terrain (Reid et al 2013).
3. Results
3.1. Fire emissions
Figure 1 shows the 1995–2015 time series of the NINO3.4 index and Dipole Mode Index (DMI), the standard indices used to represent the phases of the El Niño Southern Oscillation (ENSO) and the Indian Ocean Dipole (IOD; www.stateoftheocean.osmc.noaa.gov). Both El Niño and positive phases of the IOD result in suppressed convection over Indonesia, leading to drought and increased fire activity. September 2015 was the strongest El Niño on record since 1997 and much stronger than September 2006. September 2006, however, saw a slightly stronger positive IOD. Over the entire 20 year record, there are only three instances when both the NINO3.4 and DMI indices simultaneously exceed a value of +1:1997, 2006, and 2015. Prior to 2015, the 1997 regional haze event was the most severe on record. However, due to a lack of available satellite data for 1997, we focus our comparison on 2006, the second most extreme haze event prior to 2015.
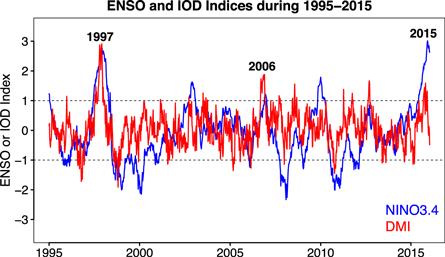
Figure 1. Indices of large scale circulation patterns in Equatorial Asia. The blue line shows the NINO3.4 index for the El Niño-Southern Oscillation for January 1995–December 2015. The red line shows the Dipole Mode Index (DMI) for the Indian Ocean Dipole (IOD). Dotted lines indicate the thresholds for El Niño (+1) or La Nina (−1) in the NINO3.4 series, and for strongly positive (+1) or strongly negative (−1) IOD conditions in the DMI series. Data are from the National Oceanic and Atmospheric Administration (stateoftheocean.osmc.noaa.gov).
Download figure:
Standard image High-resolution imageSouth Sumatra and Central Kalimantan both burned strongly during the 2006 event, contributing 30% and 31% respectively of total Indonesian OC + BC emissions released (figures 2 and 3). The July–October 2015 Indonesian fire emissions were 2.1 Tg higher compared to the 2006 emissions over the same months, an increase of 110% (figure 3). South Sumatra contributed 62% (1.3 Tg) of the emission difference between 2015 and 2006, while Central Kalimantan contributed only 18% (0.4 Tg). Jambi Province, which was responsible for less than 5% of the haze during 2006, contributed the third highest emissions of any individual province in 2015 and 12% to the emission difference between 2015 and 2006. Contributions from West Kalimantan decreased from 16% in 2006 to 6% in 2015.
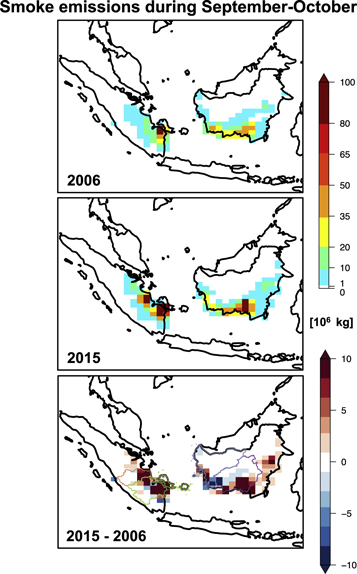
Figure 2. September–October total emissions of organic and black carbon (OC+BC) from GFAS during 2006 and 2015. The top panel shows 2006, the middle panel shows 2015, and the bottom panel shows the difference (2015–2006). Province boundaries are shown in the bottom panel by colored lines, corresponding to Jambi in coral, South Sumatra and Bangka–Belitung in green, West Kalimantan in blue, and Central Kalimantan in purple.
Download figure:
Standard image High-resolution image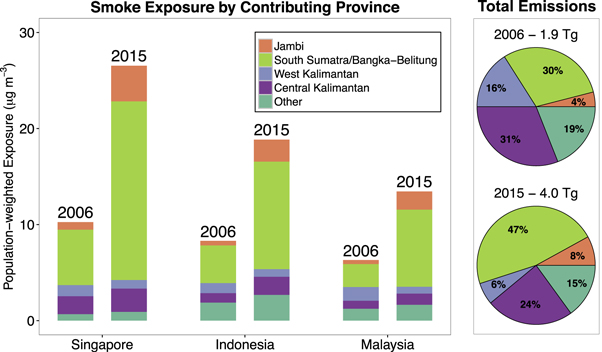
Figure 3. Contributions by province to average regional population-weighted smoke exposures (left) and total Indonesian fire emissions of OC+BC (right) during July–October 2006 and 2015. The island province of Bangka–Belitung is included with South Sumatra. Province boundaries are shown in figure 2 and supplement figure S2.
Download figure:
Standard image High-resolution image3.2. Smoke exposure during haze events
To estimate smoke exposure at each receptor area during the two haze events, we multiply the GFAS emissions for July–October 2006 and July–October 2015 by the adjoint sensitivities simulated for July–October 2006 (figure S3). Although the most intense haze occurred during September–October in both years (65% of total annual fire emissions in 2006, 80% in 2015), we extend our time horizon to include the entire burning season from July–October (83% of total annual fire emissions in 2006, 93% in 2015). As described above, we assume that the 2006 smoke transport patterns are similar to those in 2015. Smoke transport for all three receptors shows a strong sensitivity to the prevailing southeasterly winds governed by the location of the Intertropical Convergence Zone (ITCZ) during September–October (Chang et al 2005). To test our results using meteorology from other years we also calculate smoke exposures in Singapore due to the 2015 fire emissions with adjoint sensitivities for 2005 and 2007–2009 (figure S4). Seasonal mean exposures are similar across the 2005–2008 sensitivities, while 2009 is ∼25% greater than the 2006 average.
Figure 4 shows a combined time series of daily NEA PM2.5 concentrations at Singapore for 1 July–31 October 2015. Smoke concentrations returned to normal levels in late October with the onset of monsoonal rains (Cochrane 2015). The NEA data reveal an average observed smoke exposure of 30 μg m−3 in Singapore for July–October 2015. Our approach yields an average July–October 2015 smoke exposure at Singapore of 27 μg m−3, consistent with the NEA surface observations. Estimated population-weighted smoke exposures in Indonesia and Malaysia during 2015 are 19 μg m−3 and 14 μg m−3, respectively. Mean July–October non-smoke PM2.5 concentrations in these areas are ∼10–15 μg m−3 (section 2.2; GEOS-Chem forward model simulation, not shown), yielding total annual average PM2.5 exposures below 50 μg m−3 and within the range of linearity (supplement section 2).
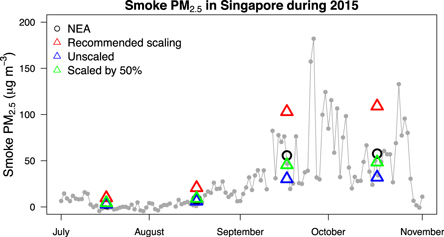
Figure 4. Time series of observed daily smoke PM2.5 concentrations in Singapore from the National Environment Agency (NEA; www.nea.org) for 1 July–31 October 2015. Gray dots represent mean 24 h concentrations averaged across five stations: Central, North, South, West, and East Singapore. Unfilled black circles at mid-month represent monthly mean observed smoke PM2.5 from NEA averaged across all five stations. Non-smoke PM2.5 has been removed from the time series by subtracting the average observed PM2.5 concentrations during June, before the onset of the haze event. Triangles show monthly mean smoke exposure at Singapore estimated by this work for July–October 2015 using unscaled GFAS emissions (blue), GFAS emissions scaled by the recommended factor of 3.4 (red) and GFAS emissions scaled by 50% (green).
Download figure:
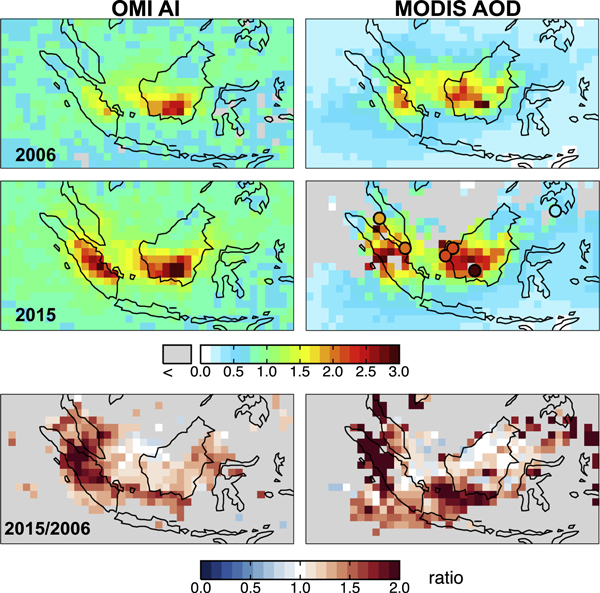
Standard image High-resolution imageDuring 2006, we find that July–October exposures are lower by at least a factor of 2 at all three receptors compared to 2015, with values of 10 μg m−3 in Singapore, 8 μg m−3 in Indonesia, and 6 μg m−3 in Malaysia. Figure 5 compares OMI AI and MODIS AOD for September–October 2006 to those quantities in September–October 2015. Also shown for 2015 is a comparison of MODIS AOD to AOD measurements at several sites in the Aerosol Robotic Network (AERONET; Holben et al 1998); no data are available at these sites for September–October 2006. Both satellite instruments reveal an approximate doubling in aerosol levels in 2015 compared to 2006 across much of the domain, consistent with the adjoint exposure results and confirming the utility of our approach.
Figure 5. Average satellite aerosol observations for September–October during the 2006 and 2015 haze events. Observations during the 2006 event are shown in the top two panels; the 2015 event is shown in the middle panels. Values of Aerosol Index (AI) from the Ozone Monitoring Instrument (OMI) are shown at left; aerosol optical depths (AOD) at 550 nm from the Moderate Resolution Imaging Spectroradiometer (MODIS) on the Terra satellite are on the right. Gray pixels indicate missing data. Colored circles in the MODIS AOD 2015 panel indicate mean September–October AERONET observations. These data are level 1.5, which include cloud filtering but not the final calibrations of the quality-assured level 2.0 product. For consistency with the Terra MODIS morning overpass time, the AERONET data has been averaged during 9am–12pm local time. The bottom two panels compare the 2015 values to those in 2006 for the two satellite products, calculated as the ratio of 2015/2006. For clarity, ratios in those gridboxes with low aerosol content in both products (AOD < 0.5 and AI < 1.0) are not shown.
Download figure:
Standard image High-resolution image
3.3. Emission sources
During 2006, South Sumatra and Central Kalimantan contributed roughly equally to regional emissions (30%–31%), but across all three receptor areas, South Sumatra accounted for more than three times as much smoke exposure than did Central Kalimantan (figure 3). Also in 2006, West Kalimantan contributed only 16% to regional emissions, but was responsible for the second highest exposure levels in Malaysia, after South Sumatra. In 2015, the percent contributions to smoke exposure from South Sumatra increased by 10%–15% in the absolute sense across all receptors, compared to South Sumatra's contribution to smoke exposures across the same areas in 2006. Exposure contributions from Jambi doubled in 2015 compared to 2006, while contributions from the other regions decreased. The trends in smoke exposure from South Sumatra and Jambi in 2015 suggest significant changes in land use occurred in these regions during the intervening years as discussed below.
Emission source regions for both the 2006 and 2015 haze events differ from those contributing to a severe haze event in June 2013 that severely affected Singapore and the Malay Peninsula (Gaveau et al 2014a). The 2013 haze has been traced to agricultural burning in Riau, a province in northern Sumatra covered extensively by peatlands and oil palm concessions (figure S1; Gaveau et al 2014a). In contrast, we find that Riau did not contribute significantly to smoke exposure at any receptor during either the 2006 or 2015 haze events. This difference is partly due to the longer burning season in Riau than further south in Indonesia, with increased burning earlier in the year (Reid et al 2013). Also, the prevailing winds over Riau shift from westerly in June to southeasterly during September–October as the ITCZ moves southward across Equatorial Asia, transporting what smoke there is later in the season toward the northwest rather than towards the populated Malay Peninsula.
To estimate the contributions of different types of land use and land cover to fire activity, we used satellite FRP observations at high-resolution (1 km × 1 km) for July–October 2006 and 2015 (table S1). While FRP totals are not directly comparable to emissions, they are available in near real-time and can reveal the spatial distribution of fire activity and land use types affected by fires, as demonstrated by Marlier et al (2015c). For example, although oil palm concessions have previously been implicated as a major driver of peat burning in Indonesia (Koh et al 2011), we find that burning in oil palm concessions in 2006 accounted for only 11% of total FRP in Sumatra and 32% in Kalimantan. In 2015, these contributions declined to just 5% and 20%, respectively. In Sumatra, FRP in timber concessions increased from 27% in 2006 to 55% in 2015, while in Kalimantan the timber contribution was <10% in both years. In contrast, the percentage of total FRP occurring in peatlands increased in both Sumatra (44%–72%) and Kalimantan (32%–43%) from 2006 to 2015. Reasons for the apparent increase in fire activity in peatlands are not clear. Draining of peatlands to prepare for agricultural use in the intervening years may have made the peat more vulnerable to fires (Carlson et al 2012, Turetsky et al 2015). Further analysis of the 2015 event with updated land use maps is needed to fully understand these patterns at a spatial scale that is useful for stakeholders.
3.4. Health impact estimates
The US Environmental Protection Agency primary standard for unhealthy levels of annual average PM2.5 is 12 μg m−3. According to the World Bank, much of Equatorial Asia is close to this standard in non-haze years—e.g., annual mean values reported for 2011 are 13–14 μg m−3 for Indonesia, Malaysia, and Singapore (http://data.worldbank.org/indicator/EN.ATM.PM25.MC.M3). Based on smoke exposures for 2006 (section 3.2), we estimate the following excess deaths for that year, with 95% confidence intervals calculated as in Driscoll et al (2015): 34 600 (9000–60 100) in Indonesia, 2300 (600–4000) in Malaysia, and 700 (200–1200) in Singapore. For 2015, we estimate these excess deaths to be: 91 600 (24 000–159 200) in Indonesia, 6500 (1700–11 300) in Malaysia, and 2200 (600–3800) in Singapore. (See supplement section 2 for description of the health impact calculations and comparison to previous estimates for the 1997 event.) Our results suggest that regional smoke-related mortality was 2.7 times higher in 2015 than in 2006, an increase whose causes we summarize in the discussion and conclusions.
4. Discussion and conclusions
A combination of El Niño and pIOD conditions in July–October 2015 led to dry conditions that exacerbated agricultural and land clearing fires in southern Sumatra and Kalimantan. The resulting dense haze persisted across much of Equatorial Asia for weeks, imposing adverse public health impacts on populations in Indonesia, Singapore, and Malaysia. Using the adjoint of the GEOS-Chem global chemistry model together with health response functions, we estimate ∼60 μg m−3 of population-weighted smoke PM2.5 exposure and 100 300 premature deaths across Indonesia, Malaysia, and Singapore due to extreme haze in 2015. These values are more than double the 25 μg m−3 of smoke PM2.5 and 37 600 premature deaths that we estimate for a similar haze event in the region in 2006. The approximate doubling of regional smoke exposure in 2015 compared to 2006 is consistent with observations of haze from both OMI AI and MODIS AOD during the two events.
Smoke exposures in downwind population centers in both 2006 and 2015 stemmed mainly from burning in South Sumatra, an area that contributed more than 30% of the regional emissions and more than 50% of the regional smoke exposure during both events. We also find that Jambi Province, which did not burn significantly during 2006, contributed about ∼20% of the increased smoke exposure between 2006 and 2015. High resolution FRP data suggests that fire activity on Sumatra in 2015 was dominated by burning on timber concessions (55%) and peatlands (72%). An updated analysis of the sectors and land types contributing to smoke exposure would build on Marlier et al (2015c) and test our hypothesis.
There are several limitations to the model framework we present. First, peatland emissions are difficult to quantify and thus lead to a wide range of emission estimates across fire inventories. Peat fires can smolder in the subsurface for weeks to months after ignition, often at temperatures too low to be detected accurately from space (Tansey et al 2008). The contribution of this low temperature burning to total smoke emissions in peatlands is uncertain. The amount of peat fuel consumed during each fire event is also uncertain and currently not explicitly represented in fire emission inventories (Konecny et al 2016). Second, the concession maps we use in our attributions correspond to 2010 rather than 2015, and a subset of the concessions recorded in 2010 may have been converted to other land use types prior to 2015. Also, since our analysis was conducted on a 0.5° × 0.67° grid, there is some uncertainty in our attributions of emissions and exposure contributions to specific provinces. Third, our method produces population-weighted average smoke exposures, which neglect the spatial variability in exposures within a receptor region. Populations living close to fires may experience annual average PM2.5 exposures above the 50 μg m−3 linearity threshold in the concentration response function we used. We also focus only on adult mortality due to lack of knowledge on the effects of air pollution on child mortality, even though impacts on children are likely significant. Additionally, the concentration response function used here is based on studies done in high-income countries with different baseline health characteristics and air pollution sources. To date, there is little evidence quantifying the relationship between PM2.5 composition and toxicity, and so we do not consider this factor (Levy et al 2012). Our approach also does not explicitly eliminate the potential influence of confounding health effects from conditions related to El Niño-pIOD meteorology that are independent from fire pollution, such as heat waves or excess airborne dust from the drier conditions. Ideally we would validate our results with a multi-year epidemiological study, but such an evaluation is beyond the scope of our analysis. Finally, our approach relies on the assumption that the prevailing transport patterns between 2015 and 2006 are likely similar given the background meteorological conditions (sections 3.1–3.2). Predictive real-time tools to forecast haze in Southeast Asia exist and have recently been improved upon (Hertwig et al 2015), but these methods require substantial computational investment and do not readily provide the geographical source attribution information inherent in our adjoint approach.
These limitations in our approach are largely offset by the benefits of (1) identifying in near real-time the key fire locations contributing significantly to downwind smoke exposure during haze events in Equatorial Asia, and (2) rapidly producing estimates of the associated health impacts when the policymakers and civil society groups are seeking ways to effectively address seasonal burning in Equatorial Asia. In particular, our approach provides an early-response diagnosis of those provinces where effective fire and land use management would yield the greatest benefits to human health, even as the haze event is still unfolding. (See supplement section 6 for discussion of challenges facing existing fire management strategies in Indonesia.) Applying the framework presented in this work requires only spatially explicit estimates of carbon aerosol emissions from fires, the archived GEOS-Chem adjoint sensitivities (available upon request), and a health impact model. The exposure calculations are effectively a one-step multiplication combining the sensitivities with the fire emissions, taking only seconds to perform and requiring minimal computational resources. In the immediate aftermath of large haze events, when the incentive for constructive decision-making among stakeholders is greatest, our framework supplies detailed information on the air quality consequences of agricultural fires, a common land use practice in Equatorial Asia.
Our modeling approach quantifies the public health impacts of smoke pollution, including haze crossing international borders. The capacity of our framework to quickly identify the provinces where fire emissions are most severely affecting downwind populations and to quantify the resulting PM2.5-related health impacts can help government agencies prioritize forested and peatland areas for protection and restoration. Furthermore, our integrated modeling approach can help policymakers reduce health impacts from haze and strengthen long-term efforts like Reducing Emissions from Deforestation and Forest Degradation (REDD+) to decrease greenhouse gas emissions, maximizing the climate co-benefits of preventing the release of carbon from trees, peat, and other soil. Finally, the framework's ability to causally link specific fire events to public health impacts in domestic and transboundary locations could support implementation of laws that hold responsible those individuals and entities involved in illegal burning of land and forests in this region.
Acknowledgments
Code and supporting material for the GEOS-Chem model is available at www.geos-chem.org. Analysis of MODIS and OMI satellite data used in this paper were processed with the Giovanni online data system, developed and maintained by the NASA GES DISC. This work was funded by the Rockefeller Foundation and the Gordon and Betty Moore Foundation through the Health & Ecosystems: Analysis of Linkages (HEAL) program. Miriam Marlier was funded through the Winslow Foundation. The authors would like to thank Han Sheng Quek and collaborators at the Singapore National Environment Agency for providing PM measurements. We also thank Santo V Salinas Cortijo, Susana Dorado, Brent Holben, Soo-Chin Liew, Mastura Mahmud, Maznorizan Mohamad, Lim Hwee San, and the rest of the AERONET team for their efforts in establishing and maintaining the Singapore, Kuching, Pontianak, Palangkaraya, ND Marbel University, and USM Penang sites. We also thank Guido van der Werf for helpful comments on fire emission inventories. Finally, we thank the Monitoring atmospheric composition and climate (MACC-II) project for processing, maintaining, and distributing the GFAS data. The GFAS data was taken from a website managed by the ECMWF. Neither the European Commission nor the ECMWF accepts any responsibility or any liability for any use which is made of this data.