

Abstract
Flash flooding is often caused by sub-hourly rainfall extremes. Here, we examine southern UK sub-hourly 10 min rainfall from Met Office state-of-the-art convective-permitting model simulations for the present and future climate. Observational studies have shown that the duration of rainfall can decrease with temperature in summer in some regions. The duration decrease coincides with an intensification of sub-hourly rainfall extremes. This suggests that rainfall duration and sub-hourly rainfall intensity may change in future under climate change with important implications for future changes in flash flooding risk. The simulations show clear intensification of sub-hourly rainfall, but we fail to detect any decrease in rainfall duration. In fact, model results suggest the opposite with a slight (probably insignificant) lengthening of both extreme and non-extreme rainfall events in the future. The lengthening is driven by rainfall intensification without clear changes in the shape of the event profile. Other metrics are also examined, including the relationship between intense 10 min rainfall and temperature, and return levels changes; all are consistent with results found for hourly rainfall. No evaluation of model performance at the sub-hourly timescale is possible, highlighting the need for high-quality sub-hourly observations. Such sub-hourly observations will advance our understanding of the future risks of flash flooding.
Export citation and abstract BibTeX RIS

Original content from this work may be used under the terms of the Creative Commons Attribution 3.0 licence. Any further distribution of this work must maintain attribution to the author(s) and the title of the work, journal citation and DOI.
1. Introduction
There are few climatic studies examining sub-hourly rainfall [1–3], due to the lack of observations. More work has been done at hourly timescales, due to the greater availability of hourly data. Here we examine changes in sub-hourly (10 min) rainfall using a state-of-the-art high-resolution 'convective-permitting' regional climate model (RCM; [4]) over the southern UK (SUK). Short-duration intense bursts of rainfall are the primary cause of rapid surface water run-off and flash flooding [5]. Small river catchments and sewers are sensitive to sub-hourly rainfall intensities, and can respond to high intensity rainfall in less than a hour [5]. To understand the causal processes and risks of such (urban) flash flooding, one can use hydrological models. Hydrological models are best used in conjunction with high temporal (sub-hourly) and spatial (sub-kilometre) resolution data [6]. Such high-resolution data are not available from traditional climate models and reanalysis products, but recently available convective-permitting models [4, 7] may be able to provide reliable sub-hourly rainfall output. However, sub-hourly rainfall output has not previously been examined, and we cannot assume improvements in hourly precipitation extend to sub-hourly timescales. Assessment of this requires sub-hourly observations, which are not commonly available.
Another motivation for this study is to examine the potential intensification of rainfall extremes with increasing temperature ('positive scaling'). A number of recent studies have explored this scaling on the hourly timescale, with observations showing that this intensification can exceed expectations from atmospheric thermodynamics [8–12]. However, several studies have shown that this relationship does not hold at higher temperatures, with many regions showing hourly extreme intensity to stop increasing at a high-enough temperature threshold ('zero scaling') and decline with further temperature increases ('negative scaling') [1, 9, 13]. A recent observational study has indicated that rainfall event duration over Japan decreases with increasing temperature, when surface-air temperature is higher than 25 °C (hereby U11; [1]). These duration decreases appear to explain the decline in the scaling between hourly (and daily) extreme rainfall and temperature at high temperatures. No decline in scaling is observed for sub-hourly or instantaneous extreme rainfall intensities. An observational study of Australian precipitation profiles shows that rainfall profiles change with temperature; warmer temperatures are associated with higher peak intensities and lower off-peak intensities [3]. However, it is unclear whether similar mechanisms are operating elsewhere. Here we examine rainfall duration, over the SUK, with sub-hourly rainfall simulated by the convective-permitting model, as well as exploring profiles of extreme precipitation events. The latter is only possible with sub-hourly precipitation data, which are rarely available from climate simulations.
2. Model and methodologies
The 10 min rainfall data is output for summer (June–July–August; JJA) for a 1.5 km resolution RCM over a SUK domain. The model simulations are fully described elsewhere [14]. The 13 year present- (1996–2009) and future-climate (end of 21st century, RCP8.5) 1.5 km simulations are driven by HadGEM3 general circulation model simulations that have been previously documented [4, 14, 15]. The model domain includes most of Wales and England5 . We downscale summer only due to the high cost of outputting 10 min diagnostics and the more frequent occurrence of convective storms in JJA, which are responsible for high-intensity short-duration rainfall [16, 17]. The 1.5 km model time step is 50 s; hence, 10 model minutes are equivalent to 12 model time steps. It remains an open question as to which output frequency the quantisation of model time stepping may have an impact and how it may manifest.
Diagnostics are chosen to assess sub-hourly duration and profile changes in (extreme) rainfall. Some previous hourly rainfall analyses are also repeated using the new 10 min data [13, 18]. The diagnostics include:
- (i)Probabilities and persistence of 10 min rainfall P (extreme or not): diagnosed with a two-state ('wet' or 'dry') Markov chain (section 3.1).
- (ii)
- (iii)
- (iv)
Unlike previous work [18, 20] which uses data that are re-gridded to 12 km grid boxes, most results here are performed using native 1.5 km gridded data. The exception here is the temperature-rainfall scaling analysis in which we re-grid the data to 12 km grid boxes first, so final results can be directly compared with a recent paper [13].
Here we define 'extreme' rainfall as whenever a 10 min 'wet period' accumulation exceeds the 99.0 percentile for all 'wet periods'. 'Wet period' is defined to be a 10 min period with at least  accumulation. Under this definition, approximately 3% and 1.5% of the present- and future-climate simulation 10 min data at each grid point are 'wet' (not shown). For both extreme profile and return level analysis, we isolate 'extreme' rainfall peaks with an automatic declustering scheme [21]. Previous analyses [4, 18] for the same model simulations have used different spatial averaging and temporal aggregation scales. Therefore, it is difficult to have consistent definitions for wet periods and extremes. However, the use of declustering isolates independent events, and addresses the problem of inconsistent thresholds. All analyses are performed under a stationary Eulerian framework—mirroring the rainfall profiled by immobile rain gauges. No attempts are made to track the movement of individual rainfall cells.
Profiles of individual events (section 3.2) are computed at each grid point. A local composite of all events from that grid point is computed by centreing each individual event profile at t = 0, and then takes the median value from t0 − 300 to t0 + 300 for each 10-min period. Uncertainty is estimated using the inter-quartile range (IQR) of the profiles at each 10 min period. The peak intensity of each profile (t = 0) is then fitted with the GPD to allow the estimation of return levels (section 3.3) [19]. As high-resolution data are noisy, we implement a basic regional frequency analysis (RFA) pooling [22]. Details can be found in the supplementary data.
3. Results
3.1. Overall duration changes to rainfall of all intensities
We begin by examining model-simulated rainfall duration, including all events. Here we assume that being 'wet' or 'dry' is a memoryless auto-regressive process with discrete 10 min steps (Markov chain), which we represent with a transitional probability matrix. The probabilities are computed by simply counting the number of wet and dry state transitions. In both reality and the model world, precipitation is not memoryless. The underlying physical processes and feedbacks depend on both precipitation intensity and synoptic condition. We are only seeking a basic representation in the persistence of wet and dry states. figure 1 shows the Markov chain transitional probabilities between 10 min wet and dry periods. The average length (in minutes) of a run for wet (E(tW)) or dry (E(tD)) states are given by:


Figure 1. Spatial representation of the transitional probabilities between wet ( ) and dry 10 min periods. The three columns represent the present-climate simulation, future-climate simulation, and future divided by present change respectively. The four rows represent the transitional probabilities for dry-to-dry (
 ), dry-to-wet (
 ), wet-to-dry (
 ), and wet-to-wet (
 ) respectively. Each panel's spatially averaged value is given in the title of that panel.
Download figure:
Standard image High-resolution imageThe spatially averaged difference in  between the present- and future-climate simulation is small (0.01), and that small difference translates to a small difference in average rainfall duration of 38.6 and 40.2 min for the present- and future-climate simulations respectively. This 1.6 min (4%) lengthening of duration has little physical relevance, and is less than the 10 min sampling frequency. While the change of the spatially averaged
  is small, there are hints of spatial patterns in the change: westward-facing coasts (especially in Wales and near to the mouth of the River Severn) see a shortening of rainfall duration, while the rest of the SUK domain shows a lengthening of rainfall duration. There is a ≈60% decline in
  in the future simulation, corresponding to a significant decline in rainfall occurrence. This is consistent with results derived from hourly data [20].
3.2. Profile of heavy rainfall
As convective rainfall tends to last at most for a few hours, proper event profiling and compositing require sub-hourly data which are often difficult to obtain for both observations and climate model simulations. Figure 2 shows the median extreme event composite profile and accumulation of the 10 min rainfall from both the present- and future-climate simulations over the entire SUK domain.
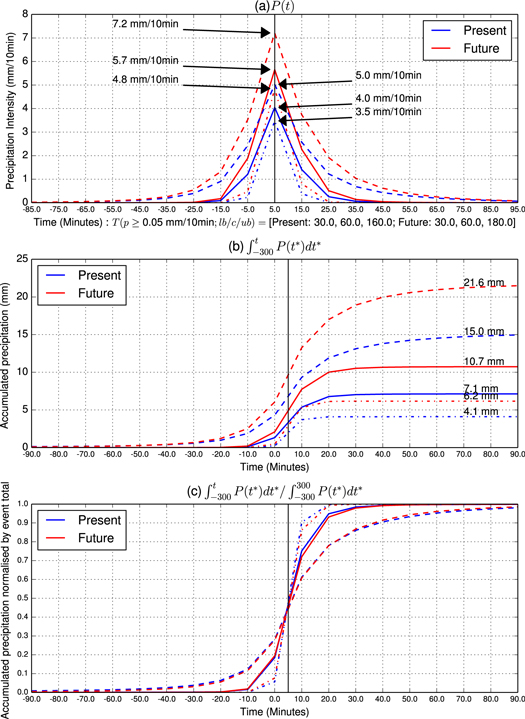
Figure 2. Spatially averaged composites of (a) 10 min total (P(t)), (b) accumulation of (a) since t − 300 ( ) and (c) accumulation normalised by grand total (
 ) for events with peak intensity exceeding 99.0th percentile of 10 min 'wet values'. By model output configuration, the intensity recorded at t is the accumulation between t and t + 10. Hence, (a) P(t) is plotted at t + 5. The (b) total accumulation up to t is plotted at t + 10. As t = 5 is the 'real' centre of the profile, it is marked with a black solid vertical line. We take the spatial median (solid line) of all local composite profiles and IQR (upper quartile: dashes; lower quartile—dashes and dots) from each grid point. Red and blue lines are for the present- and future-climate simulations respectively. The number of minutes (multiples of 10s) that the upper-quartile ('ub'), median ('c'), and lower-quartile ('lb') profiles remain over the 0.05 mm/10 min 'wet' threshold is given in below panel (a).
Download figure:
Standard image High-resolution imageBoth intensities (panel (a)) and accumulations (panel (b)) are nearly symmetrical around the profile centre for both the present- and future-climate simulations. Consistent with previous results [14], the future-climate simulation has higher intensities and accumulations than the present-climate simulation. For both present- and future-climate simulations, events generally last no longer than 2 h.
The durations for which the P(t) profiles remain above the  'wet' threshold are given in the text below panel a of figure 2. The more intense events within each individual simulation last longer than weaker events within the same simulation (as marked by same-coloured lines and dashes in panel (a)). The most intense events in the future simulation last longer (
 ) than the most intense events in the present-climate simulation (as marked by the upper dashes with different colours for the median, lower and upper quartiles in panel (a)). There are no clear changes in the normalised frequency distributions (panel (c)) between the present- and future-climate simulations. This suggests that the lengthening of rainfall event duration in the future simulation is associated with future rainfall intensification. In other words, if it rains harder, it rains for longer regardless of climate regime. There is no suggestion of any major changes in the temporal evolution of rainfall in the future simulation here as has been observed in Japan [U11] and Australia [3].
Considering the SUK domain as a whole, intensity and total accumulation increases between the future and present-climate simulation can be estimated by comparing the changes in the numbers quoted in panels (a) and (b). The future simulation shows a 37%–44% increase in peak intensity. Total accumulation (panel (b)) increase in the future simulation is somewhat higher (44%–51%). The wet-day surface air temperature rise between the present- and future-climate simulation is about 5 °C [13]. The thermodynamic extreme rainfall-temperature scaling is about  for the mid-latitudes (Clausius–Clapeyron scaling; [8, 23]). Hence, the modelled intensifications of peak 10 min intensity and the total accumulation intensification exceed Clausius–Clapeyron scaling expectations. However, this intensification is not as high as the 'super' 2× scaling that has been observed in Japan (U11) and in the Netherlands [8]. Observed UK scaling has shown no 'super' 2× scaling [11].
The disagreements with duration changes may be due to differences in geographic region, but there may also be other factors. It is possible that our convection-permitting model does not have a sufficiently realistic representation of sub-hourly precipitation. When examining model simulations results in 10 min periods and 1.5 km grid squares, the ability of the model to represent storm dynamics and cloud processes is likely to become more important relative to longer temporal and larger spatial averaging scales. Previous work [24–26] have shown that updraught mass fluxes are too high in convective cores in the 1.5 km model, and that the structure and realism of convection is sensitive to both model resolution and the representation sub-grid mixing. Steering winds for convective storms and synoptic systems may also be weaker in the future climate. Slower storms equate to longer duration and higher total accumulation. As we have already shown, total storm accumulations have increased in the future simulation.
The spatial variations of total and peak intensity are examined in the supplementary data (supplementary figure 1), and a full discussion can be found there. With the possible exception of peak 10 min intensity for the present-climate simulation, there are no clear spatial patterns of the rainfall profiles.
3.3. Return levels of 10 min and 1 h (60 min) rainfall
Unlike previous hourly return level estimates [20] where results are presented in 12 km grid boxes7
, return levels here are estimated at native 1.5 km grid boxes. For comparison purposes, the return levels for 1 h (60 min) rainfall are also presented at the native 1.5 km resolution. This serves not only as a comparison with the 10 min rainfall projections (temporal scale dependence) but also with previous 12 km results [20] to assess the sensitivity to spatial averaging (spatial scale dependence). Unlike 10 min rainfall, the 1 h return levels are estimated using a threshold of  percentile of all values above
  following previous work [20]. The change of wet threshold for the 1 h data means a different number of wet values are used to estimate the extreme threshold. Given the different spatial and temporal scales that we use here and in previous work [20, 27], it is difficult to use a consistent choice of threshold. We note that the 1 h data is declustered [21]. Hence, only independent 1 h maximum values are selected for extreme value analysis as required by extreme value analysis [19, 21]. The 10 yr return levels, z(10), are shown in figure 3 along with the change between future- and present-climate simulations.

Figure 3. 10 yr return levels (z(10)) for 10 min (left) and 1 h (60 min) (right) rainfall for the present and future simulation. Present-climate, future-climate, and future divided by present are shown in the upper, middle, and lower panels respectively. Note all return levels are in mm/10 min (including 1 h rainfall return levels) in order to make comparisons easier.
Download figure:
Standard image High-resolution imageAs one may expect from figure 2, the sharp maximum (e.g. high kurtosis and 'spikiness') of 10 min rainfall leads to higher 10 year return levels than 1 h rainfall when comparisons are made at a common unit of mm/10 min (i.e. hourly return levels are divided by 6). The changes are positive everywhere, and the spatial median of the change (indicated in the titles of panels (e) and (f)) is slightly higher (3% greater) for 10 min rainfall. However, the z(10) changes here are smaller than for both peak 10 min intensity and total accumulation change (supplementary figure 1). This is a consequence of the large decline in the frequency of rainfall in the future simulation (figure 1) [20]. For the present-climate simulation, there are hints of a lower z(10) in both 10 min and 1 h rainfall over Wales and the SW England moorlands. The same east–west gradient is not as evident in the future simulation. The largest return level increases appear to be concentrated where z(10) is lowest in the present-climate simulation. The above is not evident in section 3.2 where RFA pooling is not employed.
The variation of the return levels as a function of return period and its change are shown in the supplementary data (supplementary figure 2). The 10 min and 1 h rainfall return levels generally increase by ≈20% across a range of return periods. Additional discussion can be found in the supplementary data.
3.4. Scaling between 10 min rainfall and surface air temperature
U11 find that sub-hourly rainfall continues to intensify at high temperatures where a downturn in temperature-rainfall scaling is observed for hourly and daily rainfall. Figure 4 shows the nonlinear LOESS temperature-rainfall scaling relationship using 10 min rainfall [1, 9, 13, 28]. The 10 min rainfall scaling here is computed in the same way as previous work [13], and we use the same surface air temperature as in previous work [29]. The mean intensities, averaged across all sampled temperatures, are shown as orange dashes.

Figure 4. The LOESS-estimated scaling relationships between the 99th percentile of the daily maximums for 10 min (red line,  ) and 1 h (cyan line,
  ) rainfall and daily averaged surface air temperature (
 ). The black hexagons represent the density distribution for
  . The orange lines represent the mean values for
  and the 99th percentile of
  , and the actual values are given by the green numbers inside each panel. This is a replication of the temperature scaling plot from previous work [13] but for different rainfall accumulations. Unlike previous figures, data here are regridded to 12 km first so comparisons can be made with previous results [13]. 1 h rainfall is rescaled to have units of mm/10min.
Download figure:
Standard image High-resolution image
The nonlinear LOESS scalings between temperature and 10 min and 1 h rainfall are nearly identical (nearly parallel red and cyan curves). In the present-climate simulation (panel (a)), both 10 min and 1 h rainfall increase at rates that are theoretically expected from the Clausius–Clapeyron relationship [23]. There are no hints of 'super-scaling' as seen in some observed datasets [1, 8].
In the future simulation (panel (b)), mean 10 min rainfall extreme intensity (orange dashes) increases by about  , which is nearly the same as the ≈25% increase in 1 h extreme intensity that is found previously [13]. Both 10 min and 1 h rainfall show a downturn into negative scaling for extreme 10 min intensities above 21 °C with intensities falling below the mean for
  27 °C. This 23% change is lower than the peak intensity and total accumulation changes in section 3.2. The scaling results here are consistent with the changes that we find with return levels in which the projected changes are higher if comparisons are made at the native 1.5 km grid boxes.
Another way to illustrate the above result is to examine the change in peak intensities when one divides up individual events (section 3.2) according to their surface air temperature. The histogram and mean change of peak 10 min intensity when one divides the profiles according to their temperature at the native 1.5 km resolution are shown in supplementary figure 3. The average peak intensity is the highest at the highest temperature quartile (panel (c)) within each respective simulation. The right tail of the distribution is also heaviest at the highest temperature quartile. However, the mean increase of the peak intensity between present- and future-simulations is the smallest for the highest temperature quartile. This is consistent with the scaling downturn as illustrated in figure 4. We do note that the changes estimated here (36%–47%) are higher than the 23% change in figure 4. This is again similar to the results that we get for 1 h rainfall return levels in which return level changes that are estimated using 1.5 km data are higher than the changes estimated using 12 km re-gridded data.
4. Discussion and conclusions
While temperature-rainfall scaling is our original motivation for this study, the importance of sub-hourly rainfall goes well beyond—from the understanding of flash flooding to model precipitation physics. In this study, we investigate if the results from U11 can be found in high-resolution convective-permitting model simulations for the UK. Our regional model simulations show a decline of extreme hourly rainfall intensity at higher temperatures in the future-climate simulation [13]—a feature that is observed in warmer climates, and we wanted to examine if this was due to duration and profile changes as in observational studies. However, we fail to find the same duration and profile changes within our modelled results, suggesting that the same mechanism is not operating. In fact, we have found that changes to model-simulated extreme 10 min rainfall are remarkably similar to those for 1 h rainfall, with a slight lengthening of rainfall durations associated with intensification of the peak 10 min intensity and total accumulation intensification for about 40%–50%.
There are many possible explanations why our results may differ from U11. Perhaps the most likely ones are that we are simply examining a different geographic region with different climate and weather circulation patterns. Japan has an east coast mid-latitude and subtropical climate, while the UK has a maritime west-coast mid-latitude climate. The former is expected to be more convective than the latter, but that difference may be irrelevant for the heaviest sub-hourly rainfall intensities as they all tend to be convective. Apart from geographical and climate differences, changes in synoptic and mesoscale conditions are also important as slow-moving cloud systems increase rainfall accumulations. Although our convective-permitting simulation represents the state-of-the-art in RCM, with more realistic dynamics in convective storms [4, 30], we cannot rule out the possibility that the present results contain some model artefacts as we are extracting information at the model grid scale as well as approaching the time scale of convective updrafts and model time step. The representation of storm dynamics at sub-hourly scales is known to be questionable with convective mass fluxes being too strong [24–26]. At present, there are no appropriate UK quality-controlled multi-year in situ or remote sensing observations with which to validate our model results at sub-hourly timescales. However, such observations may become available in the near future as hourly datasets derived from 'raw' sub-hourly radar and gauge observations exist for the UK [11, 31, 32]. Our results raise more questions that can only be answered with further observational and numerical model studies.
Our results indicate that return level and intensity changes are sensitive to the horizontal averaging scale of the model. Comparing the present results with previous results using 12 km re-gridded data [20], the change signal for z(10) is significantly higher in percentage terms when using native 1.5 km data (≈10% for data regridded to 12 km and ≈20% for data at native resolution). However, a proper physical understanding of the spatial-scale sensitivity requires quantification of the spatial organisation of model-simulated rainfall; this is not a trivial problem, and is beyond the scope of this manuscript.
Our results suggest that changes in 10 min rainfall behave similarly to changes in 1 h rainfall in many respects. However, this study highlights the importance of validating model-simulated sub-hourly rainfall, especially given its role in flash flooding. If climate models can simulate sub-hourly rainfall reasonably, it will help us in the assessment of future flooding risks. In addition, understanding model biases at such short-time scales are likely to be beneficial for future model development with new insights gained in the evolution of model rainfall. Yet, the above is precluded by the need of high-quality observations. We believe this paper highlights the merit in further efforts in the acquisition and quality control of such datasets and in coupled observational and model analyses of sub-hourly precipitation.
Acknowledgments
This research is part of the projects CONVEX and INTENSE, and UKMO Hadley Centre research programme, which are supported by the United Kingdom NERC Changing Water Cycle programme (grant: NE/I006680/1), European Research Council (grant: ERC-2013-CoG), and the Joint Department of Energy and Climate Change and Department for Environment Food and Rural Affairs (grant: GA01101), respectively. Hayley J Fowler is funded by the Wolfson Foundation and the Royal Society as a Royal Society Wolfson Research Merit Award (WM140025) holder. Large portions of the analysis have been carried out with the free-and-open-source software R and Python. We will like to thank Murray Dale of ch2m for his valuable inputs in the applications of 10 min rainfall data. Model data are available upon request from the Met Office. Data fees may apply.
Footnotes
- 5
The simulation domain approximately follows figure 1.
- 6
All units of time are in minutes unless specified to be otherwise; this is to avoid cluttering in equations and figures.
- 7
For comparisons with 12 km RCM projections.