

Abstract
The Deepwater Horizon oil spill (DWHOS) spatially and temporally overlapped with the spawning of many fish species, including Red Snapper, one of the most economically important reef fish in the Gulf of Mexico. To investigate potential impacts of the DWHOS on larval Red Snapper, data from a long-term ichthyoplankton survey off the coast of Alabama were used to examine: (1) larval abundances among pre-impact (2007–2009), impact (2010), and post-impact (2011, 2013) periods; (2) proxies for larval condition (size-adjusted morphometric relationships and dry weight) among the same periods; and (3) the effects of background environmental variation on larval condition. We found that larval Red Snapper were in poorer body condition during 2010, 2011, and 2013 as compared to the 2007–2009 period, a trend that was strongly (and negatively) related to variation in Mobile Bay freshwater discharge. However, larvae collected during and after 2010 were in relatively poor condition even after accounting for variation in freshwater discharge and other environmental variables. By contrast, no differences in larval abundance were detected during these survey years. Taken together, larval supply did not change relative to the timing of the DWHOS, but larval condition was negatively impacted. Even small changes in condition can affect larval survival, so these trends may have consequences for recruitment of larvae to juvenile and adult life stages.
Export citation and abstract BibTeX RIS

Original content from this work may be used under the terms of the Creative Commons Attribution 3.0 licence. Any further distribution of this work must maintain attribution to the author(s) and the title of the work, journal citation and DOI.
Introduction
The Deepwater Horizon oil spill (DWHOS) released an estimated 700 000 metric tons of oil into the northern Gulf of Mexico (McNutt et al 2012) and overlapped temporally and spatially with the spawning period of many fish species (Hernandez et al 2010a, 2010b). Most marine fish eggs and larvae are planktonic, therefore these life stages are vulnerable to toxicity related to oil and chemical dispersant exposure, which can often lead to increased mortality (Hjermann et al 2007, Fodrie et al 2014). For example, larval stages of pelagic fish predators (e.g., tunas, amberjack) exposed in laboratory experiments to polycyclic aromatic hydrocarbons at levels observed during the DWHOS developed morphological and cardiac defects (Incardona et al 2014). Zebrafish (Danio rerio) larvae hatched from eggs exposed to Macondo oil developed similar defects, as well as a suite of other abnormalities, including deformities in sensory and muscle development and impaired locomotive abilities (de Soysa et al 2012). These findings are similar to those from experiments that followed other historical oil spills (e.g., Torrey Canyon Linden 1975, Argo Merchant Longwell 1978, Ixtoc I Getter et al 1981 and Exxon Valdez Carls et al 2002), which also documented both acute and chronic effects due to oil and/or dispersant exposure. Relatively small changes in natural mortality rates encountered during larval stages can result in order-of-magnitude changes in juvenile recruitment (Houde 1997), therefore additional mortality due to the DWHOS may have a significant impact on year-class strength.
Red Snapper (Lutjanus campechanus) is one of the most economically important reef fish in the northern Gulf of Mexico, and among the many species with pelagic early life stages at risk during the DWHOS. Mature Red Snapper spawn every 3–5 days over a protracted season ranging from late April through September (Woods 2003). The incubation period for Red Snapper eggs is short (20–27 h), but the pelagic larval duration is approximately 26 days (Szedlmayer and Conti 1999, Lindeman et al 2006). Oil from the DWHOS flowed for 87 days from 20 April to 15 July 2010 (Anderson et al 2014). The size of the surface slick at its peak exceeded 200 000 km2, and oil was transported onto the continental shelf where juvenile settlement habitat and natural and artificial reef habitats used by Red Snapper are prevalent (Gallaway et al 2009, Le Hénaff et al 2012). The extensive temporal and spatial overlap of Red Snapper spawning and the DWHOS is cause for concern, because at least some portion of the egg and larval pool was exposed to oil and dispersant.
To investigate potential impacts of the DWHOS on larval Red Snapper, we used samples collected during a long-term ichthyoplankton survey off the coast of Alabama in a region that was frequently exposed to oil during the summer of 2010 (Graham et al 2010, Szedlmayer and Mudrak 2014). First, we compared larval Red Snapper abundances among pre-impact (2007–2009), impact (2010), and post-impact (2011, 2013) periods to examine larval supply. Second, we compared proxies for larval condition (size-adjusted morphometric relationships and dry weight (DW)) among the same periods. Third, we sought to account for the effects of background environmental variation on larval condition. This study is the first to use a high-resolution time series from an ichthyoplankton field survey to examine larval fishes before, during, and after the DWHOS. Thus, it fills a critical information gap and complements both laboratory exposure experiments and efforts to quantify damage based on juvenile and adult surveys.
Methods
Ichthyoplankton surveys
Ichthyoplankton samples were collected once a month (May through November) along a cross-shelf transect off the coast of Alabama (USA) during years prior (2007–2009) and after (2011, 2013) the DWHOS, and twice a month during the DWHOS (2010). Occasionally, months were not sampled due to gear malfunction or inclement weather, and no samples were available for 2012. Red Snapper larvae were collected primarily at two stations (T20 and T35) on the continental shelf during the time series (figure 1). Both stations were impacted by pulses of oil during the DWHOS (Graham et al 2010, Carassou et al 2014). Field survey methods are described fully in Hernandez et al (2011) and Carassou et al (2012). Briefly, plankton samples were collected during daylight hours using a Bedford Institute of Oceanography Net Environmental Sampling System (BIONESS; Open Seas Instrumentation, Inc., Musquodoboit Harbour, Nova Scotia, Canada) with a 0.25 m2 mouth opening fitted with 0.333 mm (for depth-discrete and oblique samples) and 0.202 mm (for additional oblique samples) mesh nets. Replicate neuston net samples (0.5 × 1 m opening, 0.505 mm mesh) were also collected. Maximum sampling depths at stations T20 and T35 were 18 m and 33 m, respectively. Plankton samples were fixed at sea in buffered formalin, then transferred to ethanol within 48 h. Samples were sorted and fish larvae were identified by taxonomists at the Plankton Sorting and Identification Center (Szczecin, Poland) and at the University of Southern Mississippi (Ocean Springs, MS).
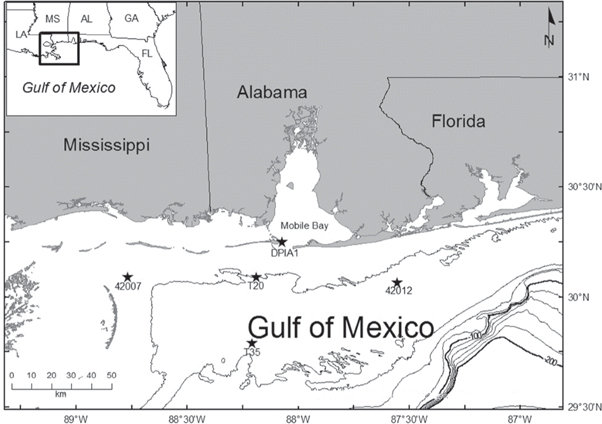
Figure 1. Locations of ichthyoplankton sampling stations (T20, T35) and environmental data platforms (DPIA1, 42007, 42012) listed in table 1 off the coast of Alabama in the northern Gulf of Mexico. Contour lines are at 20 m intervals.
Download figure:
Standard image High-resolution imageAbundance and condition measurements
Larval Red Snapper areal abundance (larvae/10 m2) was compared among years (2007–2011) using an independent-sample Kruskal–Wallis test. Abundance estimates were based on oblique tows only (not available for 2013). All larvae identified from oblique and depth-discrete samples were imaged under a dissecting microscope fitted with a high-resolution digital camera (Canon EOS Rebel T3i, Canon Inc., Tokyo, Japan). In addition to notochord length, 6 linear body dimensions of each larva were measured that have been shown in other fishes to vary according to larval feeding success, and hence are related to body condition (body depth at pectoral fin, DPF; body depth at anus, DA; head length, HL; head height, HH; eye diameter, ED; and lower jaw length, LJL) (Koslow et al 1985, Theilacker 1986, Lochmann and Ludwig 2003, Gisbert et al 2004). Body dimensions were measured using i-Solution Lite imaging software (IMT i-Solution, Inc., Rochester, New York), after which the residual of each dimension was calculated from its linear correlation with notochord length to account for size variation among larvae.
To reduce the dimensionality of our 6 body size residuals, and to account for strong pairwise correlations among body dimensions, non-metric multidimensional scaling (NMS) was used to ordinate the relative body shape of each larva (from six-dimensions) using fewer composite, orthogonal dimensions (i.e., NMS axes). NMS was selected as the best ordination technique for these data because it has the least restrictive assumptions and faithfully represents the structure of data sets in their original dimensionality (McCune et al 2002). The NMS was performed using the Sorensen Bray–Curtis distance measured on the residual+1 body dimensions (this distance measure only works with positive integers, so a nominal value of 1 was added to all residuals). All NMS ordinations were performed in PC-ORD 6 (MjM Software Design, Gleneden Beach, Oregon, USA) using the 'slow and thorough' setting. Once the NMS axes were derived, each axis was correlated with the original body dimension residuals to explain which dimensions drove variation among larvae in body shape. Because NMS axes are orthogonal, they were interpreted and tested independently using univariate statistics (i.e., independent-sample K–W tests) to compare differences among larval body shape explained by each axis through time and space (Rettig et al 2006).
After all Red Snapper larvae were imaged and measured, each larva was individually added to a pre-weighed tin capsule, dried at 60 °C for 24 h, and weighed to the nearest microgram (μg) using a Mettler Toledo XP26 microbalance (Mettler Toledo LLC, Columbus, Ohio, USA). Larval loge-transformed DWs were linearly correlated with loge-transformed notochord lengths, after which DW residuals were calculated to provide an additional, independent proxy of larval feeding success and body condition. Hereafter, this index will be referred to as the DW condition score. Larvae with negative DW condition scores were lighter than average for their given length, whereas those with positive scores were heavier than average and thus in better body condition. DW condition scores were compared through time and space using independent sample K–W tests. The DW condition scores were also correlated with each NMS axis from the body dimension ordination to determine whether each axis was informative of larval body condition.
Environmental analyses
Observations for 7 oceanographic and climatic variables were collated from online sources (table 1; figure 1) to examine environmental effects on larval body condition. Climatic data (El Nino-Southern Oscillation Index; North Atlantic Oscillation Index) were available at monthly intervals, and water temperature and local wind data were available at hourly intervals. Total freshwater discharge from Mobile Bay was estimated by summing daily river discharge data collected at two gauging stations at the head of Mobile Bay (Dzwonkowski et al 2011).
Table 1. Environmental variables used in NMS analyses, along with their respective units, data sources and observation station names.
| Variable | Unit | Source | Observation station(s) |
|---|---|---|---|
| El Nino-Southern Oscillation Index (SOI) | — | NOAA (National Oceanic and Atmospheric Administration) (2015a) | — |
| North Atlantic Oscillation Index (NAO) | — | NOAA (National Oceanic and Atmospheric Administration) (2015a) | — |
| Wind speed | m s−1 | NOAA (National Oceanic and Atmospheric Administration) (2015b) | DPIA1 |
| u-wind component | m s−1 | NOAA (National Oceanic and Atmospheric Administration) (2015b) | DPIA1 |
| v-wind component | m s−1 | NOAA (National Oceanic and Atmospheric Administration) (2015b) | DPIA1 |
| Water temperature | °C | NOAA (National Oceanic and Atmospheric Administration) (2015b) | DPIA1; 42007; 42012 |
| Mobile Bay discharge | m3 s−1 | USGS (United States Geological Survey) (2015a) | Claiborne Lock & Dam |
| USGS (United States Geological Survey) (2015b) | Coffeeville Lock & Dam |
The environmental ordination was performed on a subset of the data that only included conditions experienced by the Red Snapper larvae used in the condition analyses. Based on a cursory examination of daily rings in otoliths of Red Snapper 3.9–6.3 mm long (n = 17), larvae of this size range were 7–14 days old (median = 10 days). Thus, environmental conditions were averaged for the one-week period prior to collection (i.e., during the first or second week of life). To estimate environmental conditions experienced by larvae during this time, water temperature and wind variables (speed, directionality) were averaged over the week prior to each sampling event. Additional lag time was added to water discharge measurements to account for the one-week delay between water moving from the gauge stations upstream of Mobile Bay to the sampling locations on the continental shelf. Monthly averages were used for the NAO and SOI climatic indices, because these represent long-term climatic fluctuations. The NMS was performed on the loge(x + 5)-transformed variables using the same settings as those for the body dimensions ordination. Each resulting NMS axis was correlated with the loge(x + 5)-transformed environmental variables. To identify relationships between environmental variation and larval condition, the environmental NMS axis scores were correlated with the DW condition scores and morphometric NMS axes.
Results
Red Snapper larvae were identified in 169 plankton samples collected from July 2007 through June 2013. Larval abundance was highly variable but did not differ statistically among years (P = 0.82, independent-samples K–W test; table 2). In total, 380 larvae were imaged for condition analyses, of which 343 were intact to allow for measurements of all 6 body dimensions (some larvae had damaged or missing eyes). The median notochord length of the intact larvae was 3.9 mm, and larvae ranged from 1.6 to 13.9 mm. To ensure the larvae were Red Snapper and not another lutjanid, larvae <3.7 mm (n = 148) were excluded from all analyses (Drass et al 2000). To account for the potential confounding effects of allometric growth during early life on our condition measurements, larvae >8 mm (n = 9) were also excluded. One additional larva was removed from the analysis because its recorded weight was an extreme outlier relative to its notochord length. The remaining 185 larvae were used to estimate condition using body dimensions and DW (table 2).
Table 2. Station, year, annual mean (larvae/10 m2, with standard error, SE) and month of collection for Red Snapper larvae used in the condition analyses. Annual means were estimated from oblique tows (not available for 2013). Larvae used in condition analyses were selected from oblique and depth-discrete tows (see methods for sampling details). Station locations are depicted in figure 1.
| Station | Year | Annual mean (SE) | Month | No. of larvae available for condition analyses |
|---|---|---|---|---|
| T20 | 2007 | 0.92 (0.51) | July | 6 |
| August | 4 | |||
| 2008 | 0 | October | 2 | |
| 2009 | 0.11 (0.11) | June | 3 | |
| October | 1 | |||
| 2010 | 1.17 (0.46) | June | 20 | |
| July | 2 | |||
| August | 1 | |||
| September | 4 | |||
| 2011 | 0.83 (0.62) | August | 1 | |
| October | 1 | |||
| 2013 | — | June | 13 | |
| T35 | 2007 | 0.72 (0.72) | July | 3 |
| August | 2 | |||
| 2008 | 4.37 (2.19) | October | 53 | |
| 2009 | 2.86 (1.20) | June | 17 | |
| September | 2 | |||
| October | 5 | |||
| 2010 | 1.20 (0.43) | June | 8 | |
| July | 11 | |||
| August | 4 | |||
| September | 11 | |||
| October | 2 | |||
| 2011 | 3.57 (1.56) | June | 1 | |
| September | 2 | |||
| October | 1 | |||
| 2013 | — | June | 5 |
The NMS ordination performed on residuals of the 6 linear body dimensions reduced the morphometric data set to two dimensions that explained 98% of the variance in the original data set with extremely low stress (stress = 7.5) (McCune et al 2002). Axis 1 explained 93% of the variation in larval body shape, whereas Axis 2 explained an additional 5%. To test whether each axis was informative of body condition or other variation in measurements, axis scores were correlated with DW condition scores of larvae. Axis 1 scores were strongly positively correlated with DW condition scores, but Axis 2 scores were not (figure 2). Thus, Axis 1 captured larval body condition, but Axis 2 did not. Axis 1 explained variation in body depth among larvae, whereas Axis 2 captured relatively minor variation (5%) in the shape of larvae that was not related to condition (table 3).
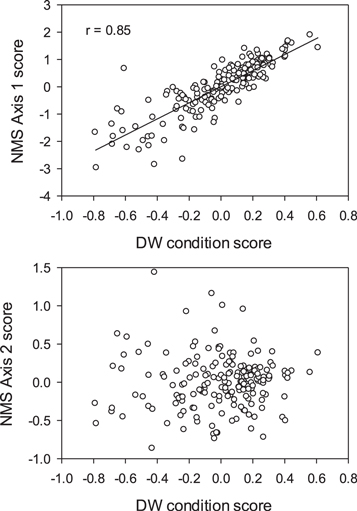
Figure 2. Relationships between morphometric NMS axis scores and DW condition scores of larvae. Note that Axis 1 scores, but not Axis 2 scores, were positively correlated with dry weight residuals.
Download figure:
Standard image High-resolution imageTable 3. Correlations between NMS axes and the 6 body size residuals in the original data set. Significant correlations are denoted with asterisks (P < 0.05, after Bonferroni correction to account for multiple comparisons).
| Axis 1 | Axis 2 | |||
|---|---|---|---|---|
| Larval body measurement | r | P | r | P |
| Depth at pectoral fin | 0.94 | <0.001* | −0.12 | 0.11 |
| Depth at anus | 0.90 | <0.001* | −0.24 | <0.001* |
| Head length | 0.69 | <0.001* | 0.64 | <0.001* |
| Head height | 0.94 | <0.001* | 0.02 | 0.77 |
| Eye diameter | 0.70 | <0.001* | −0.17 | 0.02 |
| Lower jaw length | 0.71 | <0.001* | 0.16 | 0.03 |
To examine differences in larval body condition through time and space, NMS Axis 1 scores from the morphometric analysis and DW condition scores were compared using independent-sample Kruskal–Wallis tests with pairwise comparisons by period (before, during, and after the DWHOS), year, month, and station (figure 3). Larvae collected during and after the DWHOS were in poorer body condition (i.e., were skinnier and weighed less at length) as compared to those collected before the spill (P < 0.001). This trend was driven by especially poor larval body condition in 2010 and 2013, but not in 2011 when few larvae were collected (n = 6). Averaged across years, larval body condition improved as the summer progressed by month (P < 0.001), and larvae collected at the more offshore Station T35 were in better body condition than those collected at the more nearshore Station T20 (P < 0.001).

Figure 3. Comparisons of DW condition scores (left) and morphometric NMS Axis 1 scores (right) for larvae grouped by period, year, month, and station. Boxes represent the interquartile ranges with medians, whiskers represent 10th and 90th percentiles, and circles represent larvae with more extreme values. Different letters represent significant pairwise difference between groups after independent sample Kruskal–Wallis tests.
Download figure:
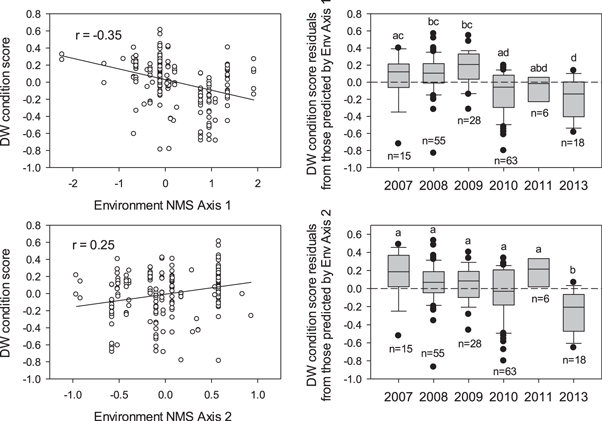
Standard image High-resolution imageThe NMS performed on the environmental variables experienced by Red Snapper larvae reduced the data set to two dimensions that explained 95% of the variance in the original data set with extremely low stress (stress = 9.0) (McCune et al 2002). NMS Axis 1 captured 80% of variation in the data set and was driven by differences in Mobile Bay discharge, the u-wind component, and wind speed (table 4). NMS Axis 2 captured an additional 15% of variation and was also correlated with the u-wind component. Red Snapper larvae DW body condition scores were correlated with both NMS axes from the environmental data set, such that larval condition was poorer during high discharge and low-speed wind events (figure 4). Although variation in east-west wind directionality (u-wind component) drove both NMS axes, the axis scores were correlated with larval body condition in opposing directions, suggesting the impacts of this variable on larvae are yet unresolved. Given NMS Axis 1 explained 80% of environmental variation and was most strongly correlated with discharge from Mobile Bay, this variable clearly impacts larval condition at the coastal sampling stations in this study.
Table 4. Correlations between NMS axes and 7 environmental variables in the original data set for the ordination based on weekly environmental patterns experienced by Red Snapper larvae. Significant correlations are denoted with asterisks (P < 0.05, after Bonferroni correction to account for multiple comparisons).
| Axis 1 | Axis 2 | |||
|---|---|---|---|---|
| Environmental variable | r | P | r | P |
| SOI | −0.48 | 0.02 | 0.42 | 0.05 |
| NAO | −0.48 | 0.02 | −0.49 | 0.02 |
| Wind speed | −0.62 | 0.002* | −0.45 | 0.03 |
| u-wind component | 0.65 | <0.001* | 0.68 | <0.001* |
| v-wind component | 0.50 | 0.02 | −0.53 | 0.01 |
| Water temperature | 0.26 | 0.23 | −0.39 | 0.06 |
| Mobile Bay discharge | 0.81 | <0.001* | −0.22 | 0.31 |
Figure 4. Correlations between Red Snapper larvae DW condition scores and environmental conditions experienced by those larvae captured by the NMS axes (left) and residual variation in larval body condition not explained by those NMS axes (right). Different letters represent significant pairwise differences in larval body condition among years after accounting for environmental variation.
Download figure:
Standard image High-resolution image
To examine variation in Red Snapper larval body condition not explained by the environmental conditions examined in this study, residuals from the correlations between DW condition scores and environmental NMS axes were compared among years. Condition residuals from the correlation with Axis 1, which again explained 80% of environmental variation, revealed a trend of relatively better larval condition during 2007–2009 as compared to poorer condition during 2010, 2011, and 2013 (figure 4). This trend was not observed for residuals from the correlation with Axis 2, which captured only 15% of environmental variation. Thus, Red Snapper larvae were in relatively poorer body condition during and after 2010, even after accounting for physical environmental conditions experienced by each larva.
Discussion
Larval Red Snapper were in poorer body condition during 2010, 2011, and 2013 as compared to the 2007–2009 period. This trend was strongly related to variation in discharge from Mobile Bay, such that high discharge periods generally coincided with poorer larval body condition. However, larvae collected during and after 2010 were in relatively poor condition even after accounting for variation in several physical variables, including wind speed and directionality, water temperature, and freshwater discharge. This study does not provide evidence to directly attribute this pattern to release of oil and dispersants during the DWHOS, although the findings do suggest that some combination of conditions related to this event negatively impacted larval Red Snapper condition. By contrast, no differences in larval abundance were detected during these survey years. Taken together, larval supply did not change relative to the timing of the DWHOS, but larval condition was negatively impacted. Even small changes in larval condition can dramatically alter lifetime growth and fitness, so this trend may have important consequences for recruitment of larvae to juvenile and adult life stages.
The negative impact of freshwater discharge from Mobile Bay on larval body condition was further supported by patterns we observed through time and space. Within years, poor body condition in the early months of the Red Snapper spawning season coincided with peak discharge events from Mobile Bay. High discharge years were also matched by relatively poor larval body condition. In space, larvae collected at the sampling station closer to Mobile Bay were in poorer condition as compared to those collected further offshore. Although freshwater discharge is related to relatively poor larval body condition, the mechanisms driving this pattern are yet unclear. Increased river discharge onto the continental shelf likely coincides with decreased water temperature and salinity. Larval fish growth has been shown to vary positively with water temperature (Houde 1989), but a clear effect of temperature on larval quality was not observed in this study. However, condition of larvae collected in late summer was better as compared to those collected in early summer, which may be indicative of higher growth. Changes in salinity have been shown to affect growth rates (Lankford and Targett 1994, Peterson et al 1999) and growth efficiency (Wuenschel et al 2004) in juvenile fish, but primarily for estuarine species that encounter variable salinity conditions. Red Snapper is a temperate reef fish species that spends its entire life in offshore waters. Little is known about in situ salinity tolerance of Red Snapper larvae (Jones 2013), although the mean salinity observed for Red Snapper larvae collected during NOAA Southeast Area Monitoring and Assessment Program (SEAMAP) surveys in the northern Gulf of Mexico is 34 ppt (Lyczkowski-Shultz and Hanisko 2007). Salinity was not explicitly addressed in this study, but it is possible that reduced salinity associated with relatively high discharge may have resulted in sub-optimal physiological habitat for Red Snapper larvae at the sampling site nearest the coast.
The abundance of Red Snapper larvae in this study region was not impacted by the DWHOS. Larval densities were not different across our time series and were about equal or higher in 2010 and 2011 as compared to years prior to the spill. A similar pattern was observed in larval Red Snapper frequency of occurrence from the SEAMAP, a large-scale fisheries-independent survey (Rester et al 2000). Model fits of the SEAMAP larval index for the eastern Gulf of Mexico used in the Red Snapper stock assessment also indicated no decrease in abundance during and after 2010 (Cass-Calay et al 2015). The survey used in this study (monthly sampling across the Alabama continental shelf) and the SEAMAP survey (annual sampling across the northern Gulf of Mexico) are the only long-term time series data for ichthyoplankton in the northern Gulf of Mexico region (Love et al 2015). That similar findings have been observed from these surveys which vary in spatial and temporal scale is compelling, and suggests that any impact on larval Red Snapper abundance in the eastern Gulf of Mexico was minimal.
Pelagic fish eggs and larvae are potentially the most vulnerable life stages to the toxic effects of oil and chemical dispersant (Anderson et al 2014). Thus, the pattern of relatively abundant Red Snapper larvae during and after 2010 may be interpreted as counterintuitive. One explanation is that the DWHOS had no impact on larval survivorship, provided that egg supply, hatching success, and larval predation rates and feeding rates were constant through time. More realistically, changes in each or all of these factors (and their interactions) during the DWHOS may have altered larval abundances aside from simple, direct exposure to oil and dispersants. First, a large-scale fishery closure was imposed during the spill and its aftermath, which at its peak excluded over 36% of the Gulf of Mexico Exclusive Economic Zone (>229 000 km2) from fisheries harvest (NOAA (National Oceanic and Atmospheric Administration) 2015c). The fishery closure potentially explains observed fish population increases during and after the spill for several species in the northern Gulf of Mexico (Fodrie and Heck 2011). Likewise, this unprecedented release of fishing pressure may have led to increased spawning output by adult Red Snapper which would have otherwise been removed from the population by the recreational and commercial fishery. Second, it is possible that mobile adult fish like Red Snapper moved away from the most heavily impacted areas during the DWHOS towards less impacted areas. Our sampling stations were clearly impacted during 2010 (Graham et al 2010, Carassou et al 2014), but less so than other regions closer to the wellhead blowout (Le Hénaff et al 2012). Although Red Snapper exhibit relatively high site fidelity, this species is capable of large movements (Strelcheck et al 2007), and thus it is reasonable to assume that spawning-capable adults would be able to leave areas with highly degraded environmental conditions. For example, larval abundance and distribution data suggest that large pelagics (e.g., blue marlin, mahi mahi) shifted their spawning distribution away from areas impacted by the DWHOS, possibly in direct response to the oil spill, or in response to prey species leaving the impacted area (Rooker et al 2013). An analogy to this scenario is the documented avoidance of large swaths of coastal areas impacted by seasonal hypoxia off the coast of Louisiana (Craig et al 2001). Data on adult movements of Red Snapper during the DWHOS are lacking, so it is unknown whether an influx of spawning adults to peripheral reaches of the oil spill impacts may have contributed to increased larval abundances in our region in 2010.
Other hypotheses that may explain our observed variability in larval condition include bottom-up and top-down trophic interactions in the planktonic food web. In general, increased nutrient concentrations associated with riverine discharge often stimulates primary production, and the subsequent enrichment of secondary productivity theoretically provides increased zooplankton prey for larval fishes (Denman and Powell 1984). Several studies have examined the supposed benefits of the 'short-food-chain' hypothesis, particularly in relation to larval fish assemblages associated with larger river plumes (e.g., Mississippi River, Amazon River), but evidence for growth and condition advantages for larval fish in these regions has been equivocal (Grimes and Kingsford 1996). In this study, however, Red Snapper larvae were in better condition in waters farther offshore and during periods of relatively low discharge. A previous study from our sampling region found significant (albeit weak) short-term changes in mesozooplankton assemblage structure during the DWHOS (in May and June), but relatively higher densities of many zooplankton groups (e.g., calanoid and cyclopoid copepods) during 2010 compared to years prior (Carassou et al 2014). Therefore, although we have not completed gut content analyses on our Red Snapper larvae, we do not anticipate a limitation in available prey. Alternately, a top-down explanation for our observed differences in larval Red Snapper condition may be related to temporal, spatial, and environment-related variability in planktonic predators. Selective removal of poor-condition larvae by predators in our offshore (T35), early season (May), or low discharge years would result in inflated mean condition values (Hauff 2012). In general, certain piscivorous larval types (e.g., scombrids, sphyraenids, coryphaenids) are more common in offshore waters (Lyczkowski-Shultz et al 2013), but we have yet to describe the predator assemblages from our collections. Our ongoing research into variability associated with larval Red Snapper condition will include characterizations of predator and prey fields to address these alternate hypotheses.
Baseline data and plankton collections prior to the oil spill are generally lacking (Love et al 2015), therefore our collections offered a unique opportunity to examine before, during, and after impact conditions related to the DWHOS. Because the historic survey samples were initially preserved in formalin, our choice of methods for examining condition were relatively limited, and we acknowledge that morphometric analyses of preserved larvae may be plagued by issues such as shrinkage (Theilacker 1980). Formalin preservation precluded the use of more sophisticated measures of larval condition and growth (e.g., DNA/RNA ratios, otolith increment analysis). To minimize the effects of shrinkage and allometric growth in our analyses, we limited our selection of Red Snapper to a relatively narrow size range and used a relative (length-standardized DW) measure of condition. These two proxies correlated well, and we are therefore confident our observations are measuring real differences in condition.
An additional concern of sampling highly variable plankton in the field is that the resulting collections of organisms are uneven in time and space, potentially confounding broad-scale differences in target species. For example, over or under-sampling larvae with different body condition at particular months, years, or stations could be misinterpreted as more general differences at broader scales. To address this issue, the body condition analyses (by morphometrics and DW) were completed using a resampled subset of the data to examine the robustness of our results to variation in sampling by month, year, and station. The reduced data set was generated by excluding all larvae collected in September and October (to specifically address the high number of larvae collected in October 2008 at Station T35). The reduced data set removed 84 larvae in total from different months, years, and stations. The body condition results for the reduced data set were similar to results for the full data set, suggesting the observed patterns in condition were robust to uneven sampling in time and space. Thus, although we cannot fully eliminate the issue of uneven sampling, we feel confident that our results are generally robust to this phenomenon.
The DWHOS was a major environmental perturbation in the northern Gulf of Mexico during 2010, yet direct long-term negative effects on larval fishes are unlikely, and the zooplankton community (larval fish prey) in general appeared resilient to the oil spill impacts (Carassou et al 2014). In regards to adult Red Snapper, changes in trophic ecology (Tarnecki and Patterson 2015) and exposure to polycyclic aromatic hydrocarbons likely derived from the DWHOS (Murawski et al 2014) have been reported, so it is possible these and other possible stressors manifested in poorer condition larvae through maternal effects (Green 2008). Evidence of a DWHOS impact on the recruitment of Red Snapper juveniles to natural and artificial reefs in the northcentral Gulf of Mexico has been mixed. Szedlmayer and Mudrak (2014) used diver observations in 2010 and 2011 to examine age-0 and age-1 abundances of Red Snapper on artificial reefs off the coast of Alabama, and reported recruitment rates similar to those observed during the previous 10 years. However, a recent Red Snapper stock assessment found evidence of relatively poor recruitment in the eastern Gulf of Mexico (including Alabama waters) based on trawl surveys conducted in 2010 and 2011 (Cass-Calay et al 2015). The discrepancy between these observations may be based on differences in data collection methods (visual observations versus bottom trawls) and spatial scales (small structure habitats versus larger swaths of trawlable bottom). Ultimately, it is possible that any increase in larval mortality that resulted from the relatively poor condition we observed in our study may have been masked by compensatory processes during later life stages. Red Snapper are long-lived, highly fecund reef fish, a life history strategy that relies on spreading reproductive output over many years to offset occasional poor recruitment events (Rose et al 2001). Further monitoring of these post-DWHOS cohorts will be needed to determine if these were average or weak year-classes, and whether recruitment was impacted by the DWHOS.
In conclusion, condition of Red Snapper larvae collected during 2007–2013 was negatively related to Mobile Bay discharge and positively related to distance from shore and later months during the spring-summer spawning season. Although river discharge and other environmental factors seem to heavily influence condition, larvae were still in relatively poorer condition during 2010, 2011, and 2013 as compared to the 2007–2009 period. The mechanisms driving these trends are yet unresolved, although the timing of the shift in larval condition implicates the negative impacts of some suite of factors that coincided with the DWHOS event. Moving forward, our observations naturally lead to a series of testable hypotheses that can be addressed using our current plankton collections (e.g., characterization of prey and predator assemblages), as well as the SEAMAP plankton collections (e.g., large-scale spatial and temporal analyses) to address variability in larval Red Snapper condition.
Acknowledgments
Ichthyoplankton surveys were supported by the Fisheries Oceanography of Coastal Alabama program at the Dauphin Island Sea Laboratory (DISL) during 2007–2011, and by the Gulf of Mexico Research Initiative (GoMRI) during 2013. We would like to thank field and laboratory personnel from the USM Fisheries Oceanography and Ecology lab, especially S Muffelman, J Herrmann, and C Culpepper; the captains of the R/V E O Wilson (R Collier, T Guoba, C Lollar, and R Wilson); the DISL technical support team (M Dardeau, A Gunter, and K Weiss); and L Hu (DISL) for database management support. We are grateful to M Konieczna and the scientific staff at the Plankton Sorting and Identification Center for larval fish identifications. Comments from R Leaf (USM) greatly improved earlier versions of this paper. We thank the NOAA Northern Gulf Institute for supporting undergraduate co-author J Fang through its Diversity Internship Program. This research was made possible by a grant from The Gulf of Mexico Research Initiative. Data used in this study are available through the Gulf of Mexico Research Initiative Information and Data Cooperative (GRIIDC), Harte Research Institute, Texas A&M University—Corpus Christi (doi: 10.7266/N7J964CB).