

Abstract
Charcoal production for urban energy consumption is a main driver of forest degradation in sub Saharan Africa. Urban growth projections for the continent suggest that the relevance of this process will increase in the coming decades. Forest degradation associated to charcoal production is difficult to monitor and commonly overlooked and underrepresented in forest cover change and carbon emission estimates. We use a multitemporal dataset of very high-resolution remote sensing images to map kiln locations in a representative study area of tropical woodlands in central Mozambique. The resulting maps provided a characterization of the spatial extent and temporal dynamics of charcoal production. Using an indirect approach we combine kiln maps and field information on charcoal making to describe the magnitude and intensity of forest degradation linked to charcoal production, including aboveground biomass and carbon emissions. Our findings reveal that forest degradation associated to charcoal production in the study area is largely independent from deforestation driven by agricultural expansion and that its impact on forest cover change is in the same order of magnitude as deforestation. Our work illustrates the feasibility of using estimates of urban charcoal consumption to establish a link between urban energy demands and forest degradation. This kind of approach has potential to reduce uncertainties in forest cover change and carbon emission assessments in sub-Saharan Africa.
Export citation and abstract BibTeX RIS

Original content from this work may be used under the terms of the Creative Commons Attribution 3.0 licence. Any further distribution of this work must maintain attribution to the author(s) and the title of the work, journal citation and DOI.
1. Introduction
Deforestation and forest degradation are the principal causes of forest cover change and account for a large proportion of global carbon emissions (Achard et al 2007, van der Werf et al 2009). Deforestation, defined as the long-term or permanent conversion of land from forest use to other non-forest uses (GOFC-GOLD 2009), represents an abrupt and rapid change in land cover. Many remote sensing studies have exploited the spectral signals of land surfaces to monitor deforestation at medium (250–1000 m) and high resolutions (20–30 m) (Hansen and DeFries 2004, Mayaux et al 2005, Achard et al 2007). As the volume of satellite data expands and computer-processing power increases, operational deforestation monitoring at high spatial resolution remote is becoming a reality (Hansen et al 2013). Forest degradation is a direct, human-induced, long-term loss or reduction in forest carbon stocks and forest values not qualifying as deforestation (GOFC-GOLD 2009). The partial removal of forest carbon stock often occurs at subpixel scale and is not detected by high-resolution satellites. Higher resolution sensors (0.5 cm–3 m) offer enhanced spatial detail but their use is often limited by non-systematic acquisition dates. As a consequence, remote sensing monitoring of forest degradation is more challenging and not as well established as monitoring deforestation (DeFries et al 2007, Herold and Johns 2007).
Based on radar imagery and field inventory, Ryan et al (2012) estimated that forest degradation could be responsible for roughly 67% of the aboveground biomass (AGB) total net losses in African woodlands. Fuelwood collection and charcoal production are the main components of this forest degradation (Hosonuma et al 2012, Chidumayo and Gumbo 2013). Charcoal is a key source of energy in African urban centers where nearly 80% percent of the population uses it as the main source of energy for cooking (Zulu and Richardson 2013). Population projections indicate an unprecedented increase in the urban population in African cities, increasing from 30% in 2000 to reach 60% by year 2050 (Boko et al 2007, Montgomery 2008, UN-HABITAT 2010). The energy needs of the growing urban population will pose an increasing pressure on forest resources of rural areas (Barnes et al 2004, Arnold et al 2006, Grimm et al 2008). There is incomplete understanding of the drivers behind this degradation process and its connection to urban energy demands. There is also limited quantitative information about some of its key elements, such as extent of degraded areas, intensity of the degradation, spatial and temporal dynamics of the process, AGB removals and carbon emissions (Bolognesi et al 2015).
This manuscript characterizes forest degradation associated to charcoal production in central Mozambique. We implement a multisource approach that combines information extracted from multitemporal very high-resolution (VHR) satellite images and information from field surveys to characterize forest degradation associated to charcoal production. Isolated from other major urban centers, this study area represents a closed system with few leakages in which most of the charcoal consumed in the city of Tete (hereafter Tete) is produced in the Province and only a small part of the charcoal produced in the Province is exported to outside markets (Kambewa et al 2007). This characteristic offers a unique opportunity to understand the links between forest degradation associated to charcoal production and urban growth in the tropical woodlands of southern Africa. This work aims to improve the current understanding of forest degradation in tropical dry forests of southern Africa as a first step to develop forest degradation monitoring system, contributing to a growing body of research that investigates the link between urban energy consumption and forest degradation.
2. Study area
The study was conducted in the Tete Province, in central Mozambique (figure 1). The Tete Province is crossed by the Zambezi River from northeast to southwest and is landlocked between Zambia, Zimbabwe, Malawi and the Mozambican provinces of Manica, Sofala and Zambezia. Its altitude ranges from 100 m above mean sea level in the lowlands along the Zambezi valley to 1500 m in the plateau and mountains to the East. The mean annual temperature 26.5 °C and the average annual precipitation is 627 mm with a well-defined dry winter from June to October. The Province lays in the ecotone of the miombo and mopane ecosystems and representations of both alternate depending of topographic and soil conditions. Miombo woodlands, characterized by tree species of the Brachystegia and Julbernardia genii, occupy areas of higher precipitation and altitude while mopane woodlands, dominated by trees of Colophospermum mopane (mopane), occupy lower elevations. These main charcoal production areas of the Province are dominated by mopane woodlands often intertwined with islands of miombo woodlands and acacia shrublands. Since 2008 the city of Tete has experienced a rapid growth associated to the discovery of large coking coal deposits. This growth has been followed by an increase in urban charcoal consumption.

Figure 1. Location map of the Tete province and Changara and Moatize production areas.
Download figure:
Standard image High-resolution image3. Data
We used a dataset of unclassified commercial satellite images with less than 20% cloud cover acquired for the study sites for the period 2008–2014, obtained from the NASA National Geospatial Intelligence Agency (NGA) archive (Neigh et al 2013). This dataset included images from QuickBird-2, GeoEye-1, WorldView1, WorldView2 and WorldView-3 (table 1). WorldView1 has a panchromatic band while the rest of the platforms have both panchromatic and multispectral bands. For all sensors, the panchromatic images have sub meter spatial resolution and the multispectral images range from 1.6 to 2.4 m. Because of data availability, the imagery was restricted to the main production areas of Tete, in the districts of Changara and Moatize. The dataset contained 49 images, from which 28 correspond to the Changara site and 21 to the Moatize site. The images provided full annual coverage of the study sites from 2011 to 2014 and partial coverage of the sites from 2008 to 2010 (table 2).
Table 1. Number of very high-resolution images and sensor included in the dataset.
| Satellite | Number of images |
|---|---|
| QuickBird-2 | 9 |
| GeoEye-1 | 9 |
| WorldView-1 | 21 |
| WorldView-2 | 9 |
| WorldView-3 | 1 |
Table 2. Annual percentage of area in charcoal production areas covered by very high-resolution images.
| 2008 | 2009 | 2010 | 2011 | 2012 | 2013 | 2014 | ||
|---|---|---|---|---|---|---|---|---|
| Changara | Dry months | 63.7 | 68.5 | 0 | 100 | 100 | 100 | 100 |
| Rainy months | 0 | 0 | 8.7 | 100 | 58.2 | 0 | 100 | |
| Moatize | Dry months | 0 | 0 | 45.5 | 20.8 | 78.9 | 100 | 100 |
| Rainy months | 0 | 0 | 0 | 100 | 100 | 0 | 0 |
4. Methods
4.1. Biophysical field survey
The field surveys collected data about basic components of the charcoal production process and the forest stands in the production areas. During July 2015, field crews visited 165 kilns in 18 charcoal production sites distributed in the districts of Changara (6), Moatize (6), Chiuta (4), Marara (2) and Cahora Bassa (2). These locations were selected, based on discussion with national experts, provincial Forest Services and local producers, to obtain a complete representation of charcoal production conditions in the Province. The visited kilns were dated and geocoded. For each kiln, the perimeter of the cutting area associated was measured with a hand held GPS unit and the number of stumps within the cutting perimeter, minimum cutting diameters, and main tree species were registered. The dimensions of each kiln were measured with a measuring tape and the number of sacks produced by each kiln was estimated with the assistance of local charcoal producers. When intact forest stands in the vicinity were still present, we measured average stand heights and basal areas with a wedge prism to serve as a baseline of the forest conditions in the site before charcoal production.
4.2. Remote sensing analysis
Charcoal production involves a selective removal of trees within a certain area that leaves a at least 10% of the canopy cover (Ribot 1993, Pereira et al 2001). The partial removal of trees does not necessarily result in significant variations of the spectral signal because the remaining vegetation and tree regeneration often maintain a vegetated surface. As a consequence VHR sensors cannot always detect the changes in crown cover (figure 2). We identified the presence of kilns as an indicator of forest degradation and the temporal and spatial evolution of kiln locations a proxy of forest degradation extent and intensity. To maintain a landscape level perspective of the forest degradation process, we estimated forest degradation at 500 × 500 m grid-cells, defining two levels: moderate forest degradation for areas with less than one kiln per hectare (grid cells with less than 25 kilns); and intense forest degradation for areas with at least one kiln per hectare (grid cells with at least 25 kilns).

Figure 2. Example of kiln identification in very high-resolution images: (A) landsat 8 false color composite (457) (June 2014); (B); close view of plate A box area; (C) multispectral very high-resolution of same area (December 2014). Blue polygons mark charcoal kiln locations.
Download figure:
Standard image High-resolution imageWe used visual interpretation to map the kilns in the VHR images and kilns mapped were labeled with the acquisition date of the image in which they were detected. A detailed description of the visual interpretation process is provided in the supplementary materials (S1). The full satellite data coverage for the period 2011–2014 in both study sites ensured the precise date was assigned to each kiln from 2012 to 2014. The kilns detected on 2011 imagery and labeled as such potentially included kilns that were constructed in 2010. The partial coverage of the study areas between 2008 and 2010 resulted in an incomplete detection of charcoal production activities and potentially incorrect kiln dating. Thus the kilns mapped in the satellite images of those years were not used to estimate the extent of the production area, AGB removals or carbon emissions resulting from charcoal production.
To evaluate the impact of deforestation and forest degradation we compared forest degradation estimates based on kiln density and deforestation from global forest change 2000–2014 product (Hansen et al 2013). To identify the main driver behind charcoal production we overlaid the kilns detected in the VHR images and the global forest change 2000–2014 product under the assumption that kilns located in deforested land were a byproduct of agricultural expansion and kilns in forested land had been built with the main purpose of making charcoal.
4.3. AGB removals and carbon emissions
We estimated AGB and carbon emissions from the charcoal making process in the production areas and, AGB, carbon emissions and extent of the forest degraded as a consequence of charcoal demand in the city of Tete. These variables were estimated using an indirect approach that combined information from the field survey, kilns mapped in the VHR dataset and parameters obtained from previous regional studies. Indirect approaches that combine information from various sources have been identified as a viable option to monitor forest degradation when canopy removals are low or little spectral evidence remains from the canopy gaps (Herold et al 2011). All the expressions are described in detail in the supplementary material (S1).
The AGB removal in the study sites was estimated as a product of the number of kilns mapped in the area, the average charcoal produced per kiln calculated from field measurements, and charcoal conversion efficiencies obtained from previous studies in Mozambique (Pereira et al 2001, Pereira 2002). The corresponding carbon emissions were estimated based on the amount of charcoal produced in the area and CO2 and CH4 emissions factors obtained from regional studies (Pennise et al 2001, Kammen and Lew 2005).
The annual AGB removal due to charcoal consumption in Tete was estimated as the product of the total urban population (National Institute of Statistics of Mozambique), the estimated rate of urban population using charcoal (SEI 2002, Mwampamba 2007, Zulu 2010, Gumbo et al 2013), per capita charcoal annual consumption (Silva unpublished) and charcoal conversion efficiencies. Similar approaches have been previously applied in southern Africa to estimate the impact of urban energy needs in forest resources (Mwampamba 2007). The annual carbon emissions from charcoal making for Tete was estimated as the product of the charcoal consumed annually in the city and the CO2 and CH4 emission factors. The potential area affected by forest degradation annually from charcoal consumption in Tete was estimated as the ratio of the urban charcoal consumption and the product of the average charcoal produced per kiln in the study areas and the average kiln density detected in the VHR images.
5. Results
5.1. Charcoal production
Fieldwork provided information to characterize key components of the charcoal production activities. While charcoal production can vary in response to local and specific situations, their main characteristics are shared throughout the study area. Charcoal producers in the visited sites normally apply a selective logging system based on tree species and tree size using trees above a minimum cutting diameter of 15 cm (STD 4 cm). Producers show a strong preference for mopane. Fifty-five of the visited kilns contained exclusively mopane timber, and 15% more complemented mopane with other tree species including Brachystegia spiciformis, Brachystegia boehmii, Cordyla africana, Combretum imberbe and several species of the Acacia genus. Mopane forms large monospecific stands. The average stand height measured in the field ranged from 7 to 17 m (mean = 13.6, STD = 3.0) and the average stand basal area from 8 to 34 m2 ha−1 (mean = 18.1, STD = 8.9). Its straight trunk charcoal making operations and its dense timber (1.02–1.14 g cm−3) produces charcoal with high caloric power (Bolza and Keating 1972). Trees used in the kiln are felled around the kiln location from an average cutting area of 0.31 ha (STD 0.28 ha), although the variation can be large depending on the density of suitable trees (figure 3). Based on this number, a hectare of woodlands could supply timber to build a maximum of three kilns. The kiln locations are usually selected based on the availability of suitable trees in the area and the access to trails and roads. There is strong linear relationship between the volume of the kiln and charcoal production. The average kiln produces 104 sacks of 15 kg (figure 4). The length of the visited kilns varies from 2 to 26 m, with an average length of 8.1 m (STD 4.6 m), and 39% and 8% of the kilns are larger than 10 and 15 m respectively. The average width of the kilns in the area is 2.2 m (STD 0.3 m) and the average height is 1.2 (STD 0.2).

Figure 3. Relationship between cutting area extent (ha) and number charcoal sacks produced in the kiln (average sack weights 15 kg).
Download figure:
Standard image High-resolution image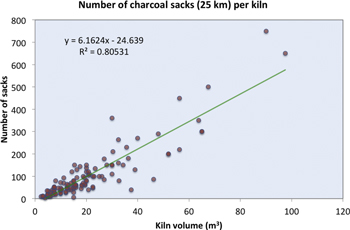
Figure 4. Relationship between kiln volume and number of charcoal sacks produced (average sack weights 15 kg).
Download figure:
Standard image High-resolution image5.2. Forest degradation
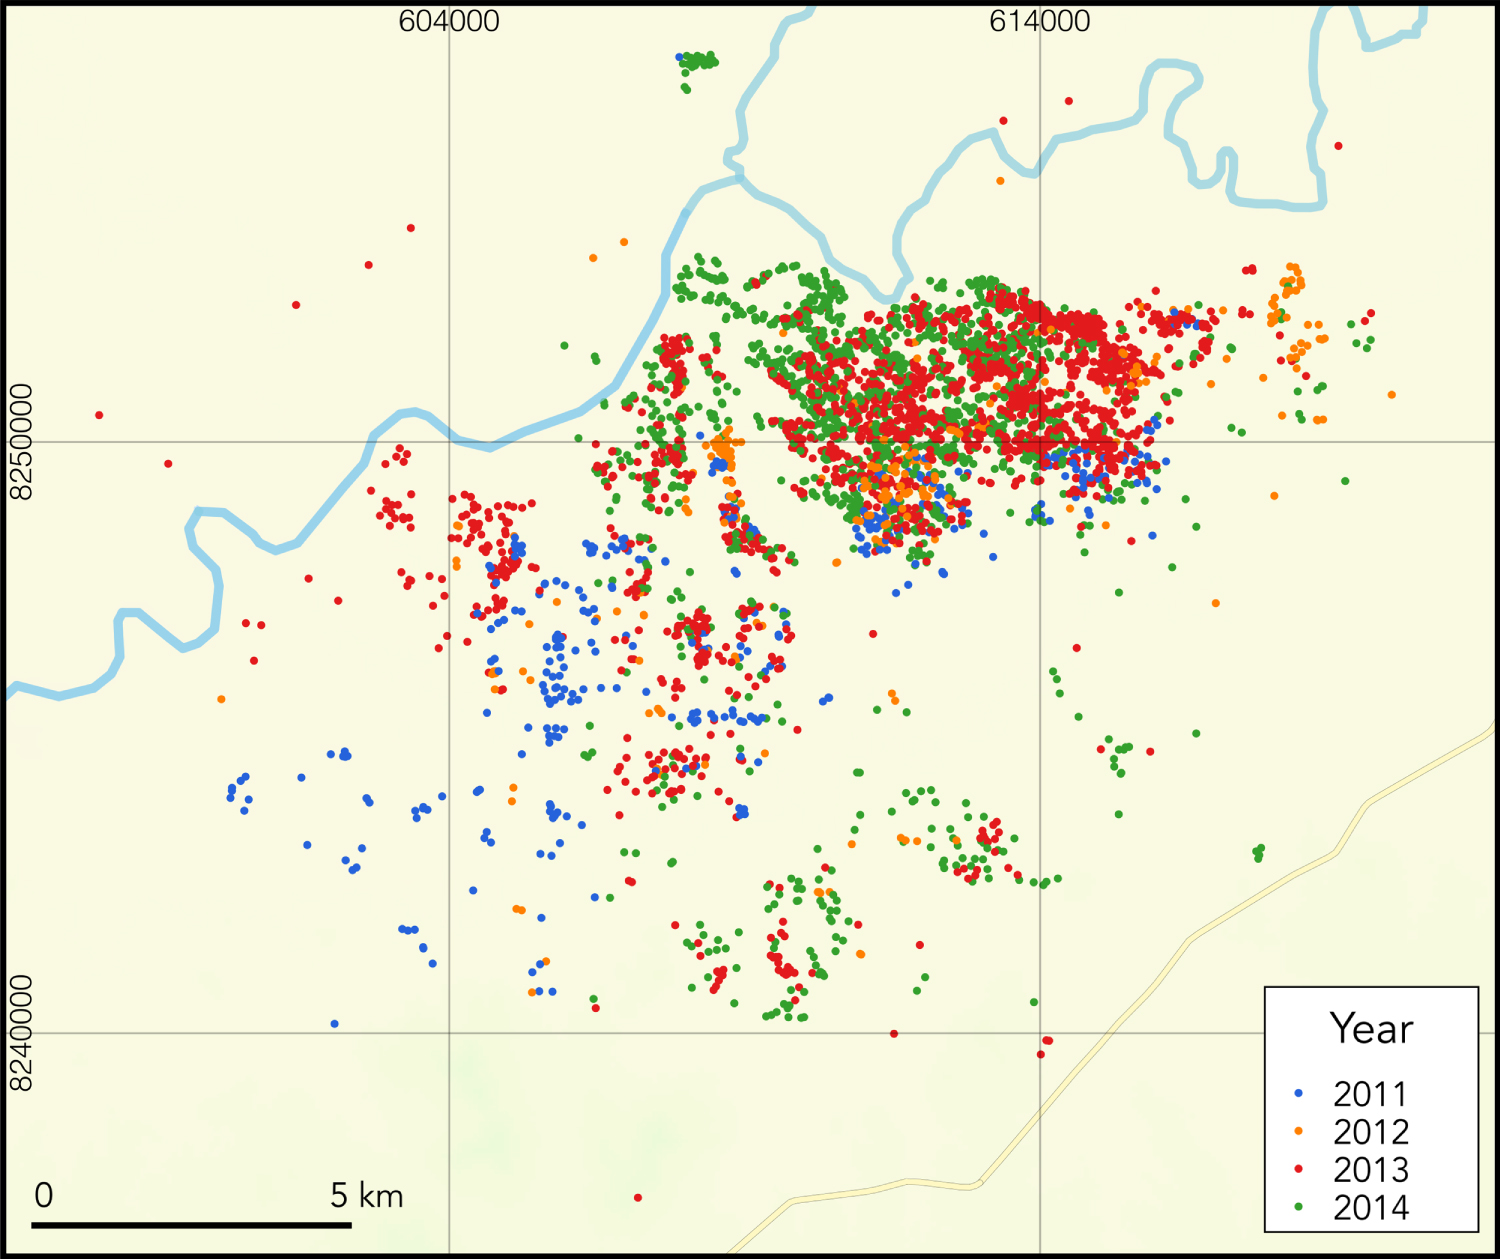
We identified 8561 kilns in the 49 VHR images for the period 2011–2014, from which 4650 and 3911 corresponded to Changara and Moatize study areas respectively (figures 5 and 6). In addition, 353 kilns were detected in Changara during the period 2008–2010. The number and location of the kilns detected in the VHR images from 2008 to 2014 explain the recent history of charcoal production in the Tete Province (table 3). The district of Changara was responsible for the largest share of charcoal production in the initial years while a significant part of the activities moved to the production areas of Moatize in the later years. A large proportion of the production areas remained active over the 4 year study period but the extent of this area gradually increased over time as additional forests were incorporated (table 4). In both study areas the centroid of the kilns built in a year, moved over time away from paved roads and Tete. This displacement pattern indicates that distance and access to urban markets is a main factor behind charcoal production and highlights the urban link of the forest degradation process.

Figure 5. Kilns mapped in the very high-resolution satellite images in the production area of the Changara district.
Download figure:
Standard image High-resolution imageTable 3. Number of kilns detected per year in each charcoal production area.
| Year | Total | |||||||
|---|---|---|---|---|---|---|---|---|
| 2008 | 2009 | 2010 | 2011 | 2012 | 2013 | 2014 | ||
| Changara | 223 | 129 | 1 | 1148 | 1840 | 1222 | 440 | 5003 |
| Moatize | 0 | 0 | 0 | 328 | 260 | 1834 | 1435 | 3911 |
Table 4. Extent of charcoal production areas (km2).
| Year | ||||
|---|---|---|---|---|
| 2011 | 2012 | 2013 | 2014 | |
| Changara | 328.86 | 423.31 | 445.24 | 451.96 |
| Moatize | 161.11 | 216.26 | 314.87 | 323.86 |
The density of kilns gradually increases over the years and reveals a heterogeneous distribution of the carbon stocks removals (figures 7 and 8). The maximum kiln density in the study areas is 2–2.4 kiln ha−1. This number is smaller than the theoretical maximum estimated from the average cutting area size measured in the field (3 kilns ha−1), and indicates that, over the years, up to 80% of the AGB can be extracted in areas of intense forest degradation.
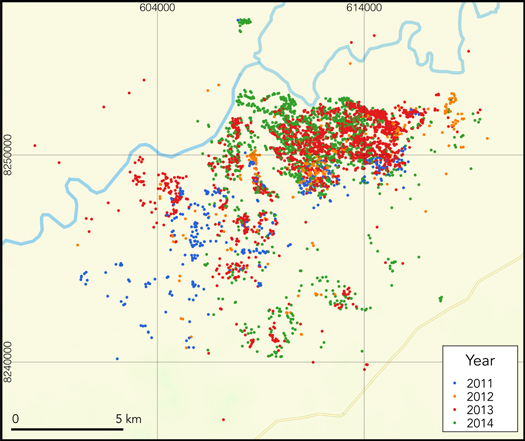
Figure 6. Kilns mapped in the very high-resolution satellite images in the production area of the Moatize district.
Download figure:
Standard image High-resolution image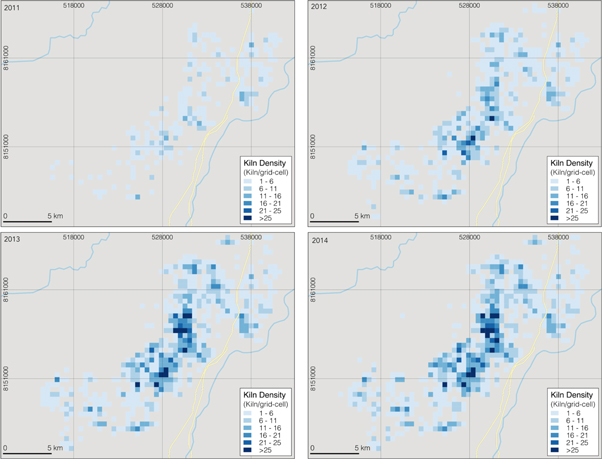
Figure 7. Cumulative kiln density (500 × 500 m grid-cell) in production area of Changara district from 2011 to 2014.
Download figure:
Standard image High-resolution imageCharcoal production is not closely related to agricultural expansion in the Tete Province. Comparison between kiln locations and the global forest change 2000–2014 product (Hansen et al 2013) shows that only 0.22% and 0.90% of the kilns built in Changara and Moatize respectively overlaid land deforested in the last 15 years. The rest of the kilns identified in the VHR images were built in forested locations not converted into agriculture.
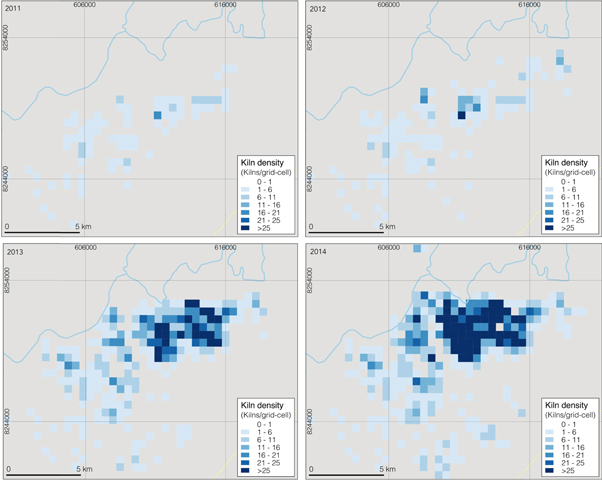
Figure 8. Cumulative kiln density (500 × 500 m grid-cell) in production area of Moatize district from 2011 to 2014.
Download figure:
Standard image High-resolution imageThe comparison of forest degradation area estimated from kiln locations with deforestation figures from Hansen et al (2013) showed that, in Changara, the area of degraded forest surpassed deforested area during 2012 and 2013, and only in 2014, when charcoal production moved to Moatize, the annual area of degraded forest was less than the deforested land (figure 9).

Figure 9. Comparison between annual deforestation and forest degradation area from charcoal production in the districts of Changara and Moatize (km2).
Download figure:
Standard image High-resolution imageThe reversed situation occurred in Moatize, where deforestation was higher in 2012, and as charcoal production grew in the district, degraded forest area nearly doubled the area of deforestation, with a significant proportion corresponding to intense forest degradation.
The estimated AGB removals accumulated in the study areas over the period 2011–2014 were 95 394 tonnes of biomass and 36 946 tonnes of CO2 of emissions. At provincial level, the estimated area of degraded forest due to charcoal demand in Tete was below the deforested area for the period 2011–2014. The charcoal demand of Tete in 2014 accounted for 65.3 km2 (±26.1 km2) of degraded forest. The estimated ABG removals associated with the charcoal demand of Tete in 2014 were estimated in 96 940 (±12 463) tonnes of biomass and the corresponding carbon emissions in 37 545 (±4826) tonnes of CO2. Assuming the current population projections and similar charcoal consumption patterns, the charcoal urban demand is expected to increase in the near future, as is the area of degraded forest due to charcoal production. In 2040, Tete would account for AGB removals of 216 951 (±27 892) tonnes and carbon emissions of 84 025 (±10 082) tonnes of CO2. Given population projections for Tete (Instituto Nacional de Estadística de Moçambique 2016) and provided that the spatial patterns of charcoal production remain similar to those identified in this study, the urban demand for charcoal in 2040, would require between 89 and 212 km2 of forestland (figure 10).

Figure 10. Annual deforestation in the Tete Province (Hansen et al 2013) and estimated forest degradation area (km2) as a consequence of charcoal consumption in the city of Tete. Upper and lower envelopes of annual forest degradation estimates based on per capita consumptions. Upper envelope assumes an annual per capita consumption of 6 sacks of charcoal (15 kg of charcoal) and intense forest degradation (kiln density = 2 kiln ha−1). Lower envelope assumes an annual per capita consumption of 5 sacks of charcoal and moderate forest degradation (kiln density = 1 kiln ha−1).
Download figure:
Standard image High-resolution image6. Discussion
6.1. Monitoring forest degradation with VHR satellite data
Our study illustrates the potential of VHR satellite images to monitor a main component of forest degradation in sub Saharan Africa. In this study we assembled annual full coverage of the study areas for every year from 2011 to 2014 and partial coverage for the period 2008–2010. Kiln identification benefited from large multitemporal stack of images. Analyses based on limited acquisition periods provide a snapshot of the charcoal production at a moment in time but offer limited insights about the spatial and temporal evolution of the process. Fewer observations are likely to result in more omission errors and inaccurate kiln dating.
Previous studies have identified the difficulties of mapping kilns in VHR with consistent accuracies using automatic and semi-automatic feature extraction methods (Rembold et al 2013, Bolognesi et al 2015, Dons et al 2015). Factors such as image acquisition date, viewing and illumination angles and changes in the kiln size, shape and color over time have an impact in the automatic identification of kilns in VHR images (figure 11). Using visual identification of kilns that maximizes the number of kiln detections in a large dataset of VHR images, this study improves our understanding of the spatial and temporal dynamics of charcoal production.

Figure 11. Kilns in several multispectral very high-resolution images over the study areas (red polygons). The appearance of the kiln varies depending on factors such as kiln production phase, soil contrast, image acquisition date, viewing and illumination angles and atmospheric conditions.
Download figure:
Standard image High-resolution image
6.2. Drivers of charcoal production
Understanding and quantifying the drivers behind different forest degradation process is a crucial first step to implement effective management practices and design successful interventions (Herold et al 2011). Fuelwood collection and charcoal production are commonly grouped together in forest degradation assessments. However they are associated with different drivers and impacts. While fuelwood collection is mainly consumed in rural areas, charcoal production is driven by urban demand. This mischaracterization has led to consistent underestimations of the impact of charcoal production in forested lands (Mwampamba et al 2013).
Our results suggest that charcoal production is the main driver of forest degradation in the study area. While agricultural expansion is the main contributor to forest cover change at provincial level, forest degradation from charcoal production accounted for nearly 30% of forest cover change in the Tete Province for 2014. In charcoal production regions, the extent of forest degradation from charcoal production exceeded deforestation due to agricultural expansion (figure 9). While in wet woodlands of the region, charcoal is considered as a secondary product of agricultural expansion, our results showed that in semiarid areas, where agriculture is not the main activity, charcoal production is a process largely independent from agricultural expansion.
Findings from rural producer surveys corroborate this idea and indicate that charcoal sales are the primary income source for 83% of respondents and that the activity is intensifying as households diversify agricultural income sources (Silva unpublished).
As urban population projections for Africa indicate unprecedented growth in the coming 40 years (Boko et al 2007, Montgomery 2008), the magnitude and relevance of this forest degradation process is likely to increase unless important shifts are made in energy consumption patterns (figure 10). While lower levels of charcoal production may be sustainable (SEI 2002), the tree growth rates in a region of limited precipitation cannot compensate the current pace of exploitation. This highlights the relevance of studying charcoal production as a separate process and developing specific monitoring systems and environmental strategies that take into account this key cause of forest cover change in the region.
6.3. Charcoal production and carbon emissions
Charcoal-based energy demand has been identified as a mechanism of forest cover change in Africa (Hosonuma et al 2012, Sitoe et al 2016). The emissions associated to this mechanism represent a key component of the large CO2 emissions and emission uncertainties at continental level (Ciais et al 2011). Despite its importance, emissions associated to forest degradation are still poorly quantified and few studies explicitly include them in carbon emissions assessments. Yevich and Logan (2003) and Chidumayo and Gumbo (2013) used survey data and national statistics to produce a first estimate of carbon emissions from charcoal in Africa. Yet, a large share of charcoal production is not registered in national statistics, which constrain the accuracy of these approaches (Mwampamba et al 2013). The combination of existing sources of information with field and satellite data has the potential to improve the quantification of forest degraded area and carbon emissions linked to urban charcoal demand.
7. Conclusions
We used a multitemporal dataset of VHR satellite images to map charcoal kilns in a study area of tropical woodlands of southern Africa. We implemented an indirect approach to estimate forest degradation area and intensity, AGB removals and carbon emissions based on the location of kilns and field information about the charcoal making process. The results improve our understanding of spatial and temporal dynamics of forest degradation associated to charcoal production. The findings of this work indicate that charcoal production is a main contributor of forest degradation. In the charcoal producing districts, charcoal production was largely independent from agricultural expansion. The area of forest degradation associated to charcoal production was larger than the area of deforestation and over larger geographical areas it was as high as 50% of the deforested area. Our study underlines the relevance of charcoal production to estimate total emissions from forest cover change in the African context. While this contribution is underestimated in current REDD+ assessments, our work shows the feasibility of combining VHR imagery and field data to characterize and quantify this forest degradation process. It also highlights the importance of incorporating charcoal specific monitoring strategies in the context of REDD+ monitoring, reporting and verification efforts as a first step to reduce carbon emissions uncertainties in sub Saharan Africa. Further work expanding the analysis to other locations will contribute to account for regional variability related to local environmental and socio-economic characteristics. This work also provides a proof of concept of the feasibility of using estimates of urban charcoal consumption to establish a link between urban energy demands and forest degradation. These approaches will benefit from more reliable demographic records and reliable population projections in the region. While charcoal is expected to remain the main component of the energy mix in African urban households (Arnold et al 2006, Zulu 2010), further efforts to understand urban energy consumption behavior in response to social, economic and environmental factors will contribute to reduce the uncertainties of future carbon emissions estimates associated to charcoal consumption.
Acknowledgments
This research is part of the 'CNH-Ex: Investigating the Dynamic Intersections Among Economic Development, Urbanization, and Forest Degradation' project, funded under the National Science Foundation—Dynamics of Coupled Natural and Human Systems program (Award number 1413999). The authors express their gratitude to students and representatives of the Universidade Eduardo Mondlane, Universidade Pegagogica—Tete branch and the personnel of the provincial Forest Services of Tete whose contribution and support made possible field data collection.