

Abstract
Global consumption of farming commodities is an important driver of water demand in regions of production. This is the case in Brazil, which has emerged as one of the main producers of globally traded farming commodities. Traditional methods to assess environmental implications of this demand rely on international trade material flows at country resolution; we argue for the need of finer scales that capture spatial heterogeneity in environmental variables in the regions of production, and that account for differential sourcing within the borders of a country of production. To illustrate this, we obtain virtual water flows from Brazilian municipalities to countries of consumption, by allocating high-resolution water footprints of sugarcane and soy production to spatially-explicit material trade flows. We found that this approach results in differences of virtual water use estimations of over 20% when compared to approaches that disregard spatial heterogeneity in sourcing patterns, for three of the main consumers of the analysed crops. This discrepancy against methods using national resolution in trade flows is determined by national heterogeneity in water resources, and differential sourcing. To illustrate the practical implications of this approach, we relate virtual water flows to water stress, identifying where global demand for water coincides with high levels of water stress. For instance, the virtual water flows for Brazilian sugarcane sourced by China were disproportionally less associated to areas with higher water stress when compared to those of the EU, due to EU's much higher reliance on sugarcane from water scarce areas in Northeast Brazil. Our findings indicate that the policy relevance of current assessments of virtual water flows that rely on trade data aggregated at the national level may be hampered, as they do not capture the spatial heterogeneity in water resources, water use and water management options.
Export citation and abstract BibTeX RIS

Original content from this work may be used under the terms of the Creative Commons Attribution 3.0 licence. Any further distribution of this work must maintain attribution to the author(s) and the title of the work, journal citation and DOI.
Introduction
Freshwater resources are becoming scarcer globally (Falkenmark 2013). Conflicts around freshwater use are rising and already create strong tensions between countries, regions and sectors (industry, agriculture, urban demand and conservation). Agriculture production today requires about 70% of global fresh water resources, compared with only 10% for households and the industrial sector respectively (Molden et al 2007). As such, global trade of agricultural commodities is one of the main drivers of impacts on water availability and land use change (Hoff 2009, Rockström et al 2014). A growing population and changing diets associated to rising incomes and urbanisation are set to increase pressure on water resources even further (WWAP 2012).
Although basin-scale analyses and governance still shape most of the water research and development agenda, there is a need for better understanding of scale interdependencies, linkages and teleconnections in the global water system (Vörösmarty et al 2013, Rockström et al 2014). Moreover, there is an expressed demand for indicators of water use in supply chains that are policy relevant and contribute to ensure sustainable resource use, linking consumers to producers (Hoekstra et al 2012, Hoekstra and Wiedmann 2014).
The concept of water footprints, i.e. the amount of water consumed per unit of produced item (Hoekstra et al 2011), aims primarily at measuring the human appropriation of global water resources (Ercin and Hoekstra 2014). It also strives to increase awareness about global water resource use for consumption by under-pinning assessments of virtual water flow, i.e. the volume of virtual water that is being transferred from one area to another as a result of trade of goods and services (Hoekstra et al 2011). A large number of studies link water footprint accounts to trade aiming to assess international dependency on external resources (e.g. Hoekstra and Hung 2005, Chapagain and Hoekstra 2008, Hanasaki et al 2010, Ercin et al 2013), opportunities of sparing resources in a location through trading of goods and services from elsewhere (e.g. Chapagain et al 2006, Fader et al 2011, Konar et al 2013, Biewald et al 2014), or to assess pressures to local water resources (e.g. Dong et al 2014).
There is a mismatch, however, between the national scale at which trade analyses are traditionally assessed, and the sub-national scales at which consumptive water use, impacts on water resources and water governance occur (Ridoutt and Pfister 2010, Biewald et al 2014). Both the accuracy and spatial resolution of water footprint and water use accounts have steadily improved over time (e.g. Liu et al 2007, Rost et al 2008, Siebert and Döll 2008, Mekonnen and Hoekstra 2011). However, this high resolution is lost in virtual water flow assessments which aggregate the original detail of the water footprint accounts with trade data at the national scale, both for when trade is estimated by physical accounting of traded material flows (e.g. Hanasaki et al 2010, Fader et al 2011, Ercin et al 2013, Zhang et al 2016) as well as by input–output analyses (e.g. Lenzen et al 2013, Kastner et al 2014, Lutter et al 2016).
The aggregation of trade data to the national scale is a result of basing calculations on nationally reported global trade data with national resolution (e.g. COMTRADE or FAOSTAT) or other datasets instead of subnational trade data (Godar et al 2015, Godar et al 2016, Jiang et al 2015). Therefore, all consumer countries account for the same amount of virtual water from the producer country per consumed unit, regardless of if they are sourcing from different regions within the production country and/or rely on production systems with different water resource endowments and water use management. Aggregation at the national scale result in that key sub-national parameters, such as local water scarcity issues, or precipitation differences between regions within a country, are not captured in virtual water trade accounts. Consequently, identifying key actors along a supply chain that may have a large impact on water consumption in the specific region of production, and thus may be important stakeholders to consider in water management decisions, is currently difficult. This study is part of recent seek to consider sub-national scales in virtual water trade assessments (Biewald et al 2014, Dong et al 2014, Jiang et al 2015).
In addition, concerns about the capacity of consumptive water accounts (e.g. virtual water estimates and water footprints) to provide policy relevant information on local pressures, or to help establish a direct causality between demand drivers and pressures on the ground, have been raised previously (e.g. Ridoutt and Huang 2012, Perry 2014, Wichelns 2015). Water footprint analyses do not provide information about the impact of the consumed water for ecosystem functions or other competing water users, or alternative uses (Ridoutt and Huang 2012, Wichelns 2015, Ran et al 2016). The focus on 'total water removal' in a country scale hampers an informed decision on sustainable sourcing for cost-efficient production and consumption, and ignores the complexity of water resource use and allocation. To address such criticism several studies attempt to estimate the sustainability of water footprints at local (Gleeson et al 2012, Wada and Bierkens 2014) and global scales (Hoekstra and Wiedmann 2014), and comparing global water use with the planetary boundaries for freshwater use (Steffen et al 2007, Gerten et al 2013). Along with a meaningful progress in conceptualizing and estimating water scarcity as a local and global issue (Falkenmark 1989, Smakhtin et al 2004, Pfister et al 2009, Hoekstra et al 2012), water scarcity assessments have recently received increased attention in several water footprint studies (Hoekstra et al 2012, Biewald et al 2014, Mekonnen and Hoekstra 2016).
This study aims to bridge the existing knowledge gap in virtual water assessments related to trade by improving spatial explicitness in trade flows and relates this to virtual water accounts and local water scarcity. We use the global supply chains of Brazilian soy and sugarcane to conceptualize the developed method and illustrate how improved spatial explicitness and accounting for local conditions of water scarcity enables an identification of major water users along the supply chain (in this case exemplified by the EU and China) in critical areas of water scarcity. Based on these findings, we elaborate on a new approach to assess pressures of water use related to traded commodities, allowing for more policy relevant and actionable information on the ground to support improved sustainability measures along water-demanding international supply chains.
Method
The method developed in this paper is based on linking detailed assessments of traded material flows to water footprint and water scarcity estimates for two main Brazilian crop commodities, sugarcane and soy. The method consists of a step-wise process; first, the spatial explicit water footprints of sugarcane and soy are estimated. Second, the production of sugar and soy, and their associated water use are linked to trade flows at a high spatial resolution. Finally, the trade-flow related water footprints are coupled to data on local water scarcity at the municipality level.
Water footprint accounting
This study assesses the consumptive water use of internationally traded products, thus, an abstracted water volume with no return flow to the same basin. We focused on surface and groundwater withdrawal, i.e. blue water, rather than rainwater or soil moisture, i.e. green water (Rockström et al 2009), since the use of blue water resources can be directly related to water scarcity. The results from the global model by Mekonnen and Hoekstra (2011) were used. The water footprint model quantifies the water footprint of global crop production for the period 1996–2005, estimating the water footprints of 126 crops. It takes into account the daily soil water balance and climatic conditions for each grid cell. The data was first regionalized to the municipality level and then extrapolated to each year within the period 2001–2011, accounting for changes in the distribution of crop production, harvested area and yields at the municipal scale (IBGE 2015), as described in table 1 of the SI.
Trade flow modelling
The SEI-PCS model6 (Godar et al 2015, 2016) allows for tracing global consumption of farming products to the sub-national regions of production (e.g. municipalities in Brazil), thereby enabling an assessment of associated pressures of international consumption on sourcing regions. The tool uses a combination of sub-national production, domestic allocation, custom declarations and international trade data to estimate the physical amounts of goods exported from each production area to all countries of consumption (further described in SI). Using the traded products defined by the Harmonized Commodity Description and Coding System from the World Customs Organization, including soybeans, soy cake, soy oil and soy sauce for the soybean crop, and sugar and ethanol for the sugarcane crop (see SI), this tool was applied for all identified consumer countries of Brazilian production. For the sake of clarity, soybean and sugarcane equivalents are used throughout this paper (Godar et al 2015).
Water stress
In order to assess the implications of global consumption of traded commodities on local water stress in regions of production, a use-to-availability indicator was calculated. The indicator was estimated by dividing the total water demand at the micro-basin level (166 843 sampled micro-basins covering the vast majority of the Brazilian territory) by the available water flow in the same area, as estimated by the Brazilian Water Agency (ANA 2013). The thresholds for each class of water stress, i.e. high, intermediate and low, were based on the classes of Raskin et al (1996), and are described in the SI. The water availability is defined as the Q95%, i.e. the flow in cubic metres per second which was equalled or exceeded for 95% of the flow record, summed to the regularised flow in case of existence of upstream dams, and the total water demand comprises industrial, domestic, agriculture and rural demands (ANA 2013).
Results
Virtual water use of Brazilian soy and sugar cane
The analysis of sub-national differences in virtual water flow for various consumer countries reveals marked differences. We focus on the main consumers, China and the EU, for the sake of clarity. Figure 1 illustrates the virtual water flow of soy and sugarcane, distributed by Brazilian municipalities related to consumption in China and the EU in year 2011. For soybeans, the total virtual water flow amounted to 67 Mm3 of blue water, predominantly originating from Southern Brazil7 . This water was consumed in order to produce 75 Mton of soy, with an average associated water footprint of 0.89 m3 ton−1, ranging from an average of 0.22 m3 ton−1 in Northern Brazil to 16 m3 ton−1 in the South.
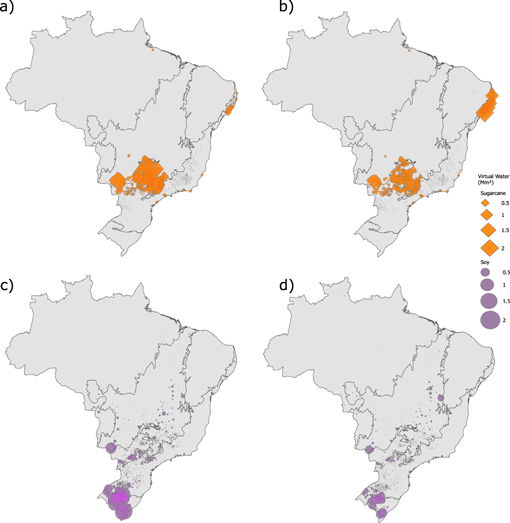
Figure 1. Blue virtual water flow in 2011 at the municipal level, for (a) Brazilian sugarcane consumed in China, (b) Brazilian sugarcane consumed in the EU, (c) Brazilian soy consumed in China, and (d) Brazilian soy consumed in the EU, in Mm3of water.
Download figure:
Standard image High-resolution imageVirtual water flow for sugarcane production was substantially higher than for soybeans and amounted to approximately 3350 Mm3 of blue water. About 75% of the virtual water flow for sugarcane consumption occurred in the Central-West region, but some also originated from the coastal regions in the East and Northeast regions. In total, 734 Mton of sugarcane were produced, with an average associated water footprint of 4.5 m3 ton−1, ranging from an average of 0.25 m3 ton−1 in the South to 27 m3 ton−1 in the Northeast region.
Figure 1 also illustrates the large spatial variation of Brazilian sourcing between the consumer countries. The aggregated virtual water flow for Chinese consumption of soybeans was almost three times larger than that of the EU in 2011 (34 Mm3 and 12 Mm3, respectively). This is partly explained by the fact that China consumed almost twice as much Brazilian soybeans as the EU (24 Mton compared to 13 Mton). However, the virtual water flow related to Chinese consumption of soy was also strongly linked to its relative preferential sourcing of soybeans from municipalities in the South region (ANA 2013), resulting in comparatively high associated water footprints (1.4 m3 ton−1 on average). In comparison, the EU consumed more soy from municipalities in other areas with relatively small associated water footprints (0.9 m3 ton−1 on average).
Regarding sugarcane, the virtual water flow of China was higher than that of the EU (60 Mm3 and 47 Mm3, respectively) (figure 1). Although China consumed considerably more sugarcane than the EU in 2011 (16 Mton and 11 Mton, for China and the EU respectively), the virtual water flow of China is proportionally lower than for the EU. This is explained by the fact that China is primarily sourcing from municipalities in the Southeast region with comparatively low associated water footprints (3.7 m3 ton−1 on average), while the EU consumes comparatively much more sugarcane from municipalities situated in the dry areas of the Northeast region (4.1 m3 ton−1 on average).
Discrepancies of spatially-explicit versus nationally aggregated virtual water accounts
Accounting for sub-national high-resolution sourcing of crops for different consumer countries enables considering differences in water footprints between regions where consumer countries source traded goods. Figures 2(a) and (b) shows the observed discrepancies between municipal-scale and nationally aggregated virtual water accounts, which range between overestimations of up to 188 Mm3 or 7.4% (Brazil) and underestimations of 13 Mm3 or 38% (United Arab Emirates) of virtual water use for sugarcane between different consumer countries. Underestimations are especially relevant for the two major consumer regions, China and the EU, with 21% and 10% respectively. Overall, a large part of the underestimations for global consumers was masked by an overestimation for the main overall consumer of Brazilian soy and sugar cane, which is Brazil itself8 .
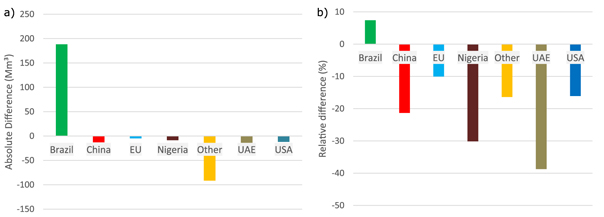
Figure 2. Difference between traditional virtual water assessments (country resolution) and spatially explicit (municipal resolution) virtual water assessments per country for sugarcane, year 2011, in (a) total amount of water (Mm3), and (b) relative difference between the two approaches (%). Positive values indicate an overestimation with respect to traditional country-to-country approaches.
Download figure:
Standard image High-resolution imageGlobal sourcing from high water scarcity regions
In Brazil, water scarcity levels vary greatly in space, as illustrated in figure 3. In particular, there are three critical areas: (1) the Southern region, with high irrigation demand, such as water-intensive rice crops (ANA 2013), (2) large metropolitan areas like Sao Paulo with high pressure on water resources due to high demographic, urban and industrial use, and (3) the Northeast region, which presents climate-related water scarcity resulting from a semi-arid climate and occurrence of drought periods.
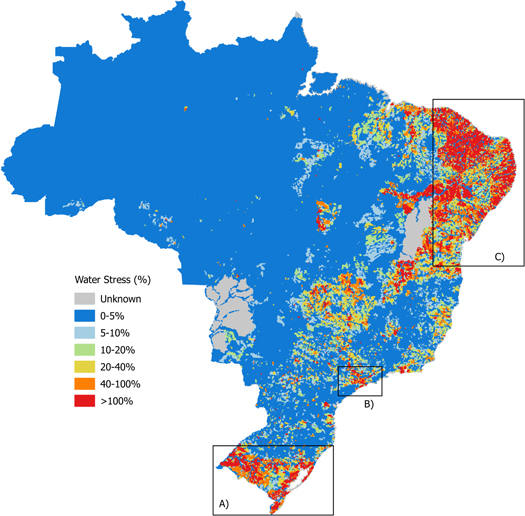
Figure 3. Water stress (%) per micro-basin. The rectangles highlight three critical regions for water stress: (A) the intensive rice irrigated areas in the South, (B) the highly populated metropolis of Sao Paolo in the Southeast, and (C) the semi-arid and water scarce Northeast. Based on data from 166843 micro-basins (ANA 2013).
Download figure:
Standard image High-resolution imageBy spatially linking water scarcity and virtual water flows, we observe that the risk for undesirable impacts on water resources caused by global consumption of Brazilian soy and sugarcane varies considerably between crops. For instance 17% of the total virtual water flow related to Brazilian sugarcane consumption occurs in regions with medium and high water stress, while this figure drops to just 8% for soybean consumption. Thus, the aggregated virtual water flow for sugarcane is not only larger in quantity, but also is associated to higher pressures on water stress areas, in comparison to soy.
Similarly, because different countries source their crops from different regions, their virtual water flow also may have different local impacts on water resources. For instance, as illustrated in figures 4(a) and (b), 36% of the virtual water flow for the EU consumption of sugarcane originates from municipalities with high levels of high stress, predominantly in the coastal regions of the Northeast, while the corresponding share for China is only 4%, mostly related to sourcing from municipalities in the Southeast region. On the other hand, the pressures of their soy consumption on water-stressed areas appears to be rather similar for both regions; 7.8% and 8.3% of the virtual water flow was sourced from municipalities with intermediate water stress levels, for EU and China respectively (figures 4(c) and (d).

Figure 4. Virtual water use at the municipal level in 2011 in low (green), intermediate (yellow) and high (red) water stressed areas for (a) Brazilian sugarcane consumed in China, (b) Brazilian sugarcane consumed in the EU, (c) Brazilian soy consumed in China, and (d) Brazilian soy consumed in the EU.
Download figure:
Standard image High-resolution imageUnderstanding global virtual water use dynamics and their impact in production regions
It is possible to link varying dynamics of consumption and trade of specific countries, to the dynamics of virtual water flow mediated by global trade in production regions of interest. For instance, the virtual water flow of Brazilian soybeans consumed in China has increased considerably (1100%) since 2008, mainly due to increased consumption (figure 5). Conversely, it is possible to analyse the opposite, i.e. how distortions in local conditions affect virtual water flows. This was the case during the infamous drought in 2005 that had an effect on crop yields in some regions of the country (USDA 2006). While the overall virtual water flow of soybeans clearly increased with time (+197% from 2001 to 2011, as opposed to a 70% increase in production), the drought resulted in an increase in the virtual water flow by 89% only in 2005 when compared to the average of the studied period. However, a closer look at the data reveals that while most countries increased their virtual water flow in 2005, the water flow for domestic soy consumption in Brazil actually decreased, which was related to a significant decrease in the consumption of domestically produced soy (Godar et al 2015), probably caused by drought driven poor yields. Consequently, the virtual water flow of countries traditionally sourcing from drought-affected areas increased considerably.

Figure 5. Global consumption of Brazilian soy and sugarcane, and associated virtual water trade, in the period 2001–2011: (a) soy consumption (b) sugarcane consumption, (c) annual virtual water trade per consumer country for Brazilian soy (Mm3), and (d) annual virtual water trade per consumer country for Brazilian sugarcane (Mm3).
Download figure:
Standard image High-resolution image
Discussion
Due to its availability of arable land and water resources, Brazil is becoming an increasingly important player supporting food security for a growing world population (Lathuillière et al 2014, Flachsbarth et al 2015). At the same time, this role brings about trade-related concerns such as trade-offs of resource use between various actors (including food security among smallholder producers), or the local impacts and risks that need to be considered by policy-makers and all stakeholders involved in global supply chains. A spatially explicit and high-resolution linkage between all actors in a supply chain and the regions of production from which they depend is a key entry point to address these issues (Godar et al 2016). This is particularly important for water resource use given its criticality and local relevance (as opposed to for example GHG emissions whose impacts are shared globally) (Wichelns 2015).
The water footprint estimates used in this study for estimating virtual water footprints (Mekonnen and Hoekstra 2011), fall well within the range of other global water footprint accounts (e.g. Hanasaki et al 2010, Liu and Yang 2010), although other studies that used a bottom-up approach to water footprint accounting in Brazil found diverging values (da Silva 2015, Lathuillière et al 2014). However, the aim of this study is not to present absolute numbers of virtual water use of crops, but to illustrate the importance of considering trade flows at a sub-national spatial scale to obtain accurate virtual water footprints and water scarcity linkages.
Our results highlight two key aspects to be considered in virtual water flow assessments of farming commodities. First, increased transparency in product value chains enables an identification of actors directly linked to virtual water use at the local level, by connecting them to sourcing regions and impacts at sub-national scales. We found that virtual water footprints for Brazilian soy and sugarcane were clearly distinct, and varied significantly between regions, countries of consumption and over time. For instance, the aggregated virtual water flow for sugarcane sourced by China was found to be disproportionally low when compared to that of EU consumption. This is explained by the fact that China imported sugarcane from municipalities with lower crop water footprints per consumed unit compared to the EU. Unless virtual water assessments are linked with trade analysis at relevant sub-national scales, it is not possible to identify key actors along the supply chain with the highest associated water use. While for the sake of clarity we have focused only on linking country consumers with regions of production, it is possible to identify the companies (exporters, importers) that are linked to those regions of production as well (see https://ttp.sei-international.org/ and Godar et al 2016).
Second, potential impacts of virtual water flows vary between regions of production. There is a growing concern that global consumption may exacerbate water stress in the regions of production of farming commodities. For instance, our results indicated that more than a third of the virtual water flows associated with sugarcane consumption in the EU originate from highly water-stressed areas predominantly in the coastal regions in the northeast of the country, in comparison to just 4% for Chinese consumption. Moreover, our results indicate that the aggregated virtual water flow for sugarcane is not only larger in quantity, but also has a higher pressure related to water stress, in comparison to soy. The different sourcing regions for both consumer regions (EU and China) vary in hydroclimate and water demands, therefore giving rise to different allocation of water resources and associated socio-economic impacts. Linking virtual water use to water scarcity data and other information relevant to social and environmental issues is thus essential for the detection of critical hotspots to focus interventions, zoning and other types of spatial planning and water management.
To enable relevant attribution of virtual water flows to imports and exports, and inform traders and retailers of the water demand of a product at the site of production, spatial-explicitness is imperative. Our approach enables an identification of actors along the supply chain sourcing farming commodities with high virtual water content from critical hotspots of water stress that may be exacerbated by global consumption, revealing potential needs to prioritize between alternative water uses. Underlying our specific findings, this paper thus argues for the use of spatial-explicit trade information that links subnational regions of production at a scale that is relevant to understand national heterogeneity in water resources and water management. Compared with an approach that does not account for differential sourcing within the country of production, our approach generated results that differed by over 20% for three of the main consuming countries of Brazilian sugarcane. These results indicate that ignoring sub-national variation in sourcing of produce may (i) generate significant errors in estimations of virtual water flows because of large variations in water footprints at the sub-national level, and (ii) considerably reduce the policy relevance of virtual water accounting, because without sub-national granularity leverage points for practical interventions by decision makers are strongly limited. Given the urgent need to embed the water dimensions in global and national sustainability agendas more efficiently (e.g. Agenda 2030) there is a strong demand for tools that address local impacts on water resources of global trade.
Spatially explicit information on the impacts of water use is especially relevant to support decision makers at local and regional levels to prioritize and implement cost-effective management practices, and in assessments of socio-environmental trade-offs between alternative water uses. For instance, the information generated by our proposed approach could support a better understanding of the role of global agricultural demand in the ongoing water scarcity in the region of Sao Paulo (ABC 2014). Moreover the methodology contributes to increased understanding about to which extent local food security and basic access to water may be compromised by water use for commercial plantations in the Northeast of Brazil. For actors along the supply chain, such as traders and the finance sector, our approach illustrates risks associated to sourcing from high water stress areas, i.e. potential disruptions in production, and reputational risks. The increased supply chain transparency can also contribute to design contingency plans ahead of periods of extreme water stress to guarantee their supply, for example by delineating a more diversified sourcing portfolio. This is progressively important in view of ongoing climate change.
Increased transparency, however, does not inform consumers and producers about how they should make their decisions. There are a number of reasons for why producers grow a certain crop in a given location, regardless if this is the most optimal way to use water, or other resources (Wichelns 2015). Thus, changing consumer behaviour to choose goods and services with low virtual water does not necessarily solve local water management issues. Increased transparency, however, enables an identification of critical hotspots of water stress that are linked to specific supply chain actors and traded commodities. This kind of transparency reveals potential needs to prioritize investments and policy focus between alternative water uses. Furthermore, it also scans the existence of hidden hotspots in remote areas that are far from the consumer's and government's concerns.
The approach presented in this study can improve the understanding of linkages between dynamics of consumption, trade and production systems in the context of water use demands. However, we have focused on conceptualizing and illustrating this approach instead of analysing in-depth the concrete implications for a set of crops, municipalities and even policies in Brazil. Beyond that possibility, this approach could be successfully applied to other countries of production with large spatial heterogeneity in water resources, to other crops for which very different water management practices occur even in the same region of production, or to other environmental dimensions that show a large spatial dependency and heterogeneity. The latter is the case of, for example, linking sub-national material flows with local biodiversity impacts, for which global demand that leads to tropical deforestation may result in several times more embedded biodiversity loss than if consumption is linked to non-forested areas with poor biodiversity values. Green water assessments were not included in this study as green water use cannot be directly related to the water scarcity indicator applied, but moreover because of current methodological and data limitations for accurately assessing green water scarcity (Schyns et al 2015). In any case, the application of this type of approach to water resources and scarcity should preferably rely on locally adapted water modelling, as well as to include green water assessment and linkages to local environmental impacts of water partitioning and soil moisture availability.
Conclusion
In this paper we illustrate how improved spatial explicitness and accounting for local conditions of water stress enables an identification of major water users along the supply chain, exemplified by the EU and China, in critical areas of water stress. These estimates were obtained by linking material trade-flows from municipal scale sourcing regions, a water footprint model of blue water use and a high-resolution mapping of blue water stress in Brazil.
We argue that by accounting for subnational heterogeneity in virtual water use and water scarcity, it is possible to identify potential trade-offs and regions of concern, linking local pressures to various actors along global supply chains and therefore facilitating multi-stakeholder dialogue to find solutions to water resource management conflicts. Overall, this paper makes a strong case for a more holistic and joint consideration of methods and data allowing to obtain detailed water scarcity and virtual water footprint assessments. This allows for increasing the policy relevance of water assessments and to better support improved sustainability along water-demanding global supply chains. Our proposed approach is well suited to capture spatial heterogeneity in water resources and management in the regions of production; to account for differential sourcing within the borders of a country of production to different regions of consumption; and to relate virtual water flows and local conditions of water stress and demand.
Acknowledgments
We thank the two anonymous reviewers for their constructive comments. We also thank Gerd Sparovek from the University of Sao Paulo for his invaluable guidance on existing water scarcity databases. RF acknowledges support from the Swedish Institute through the Scholarship Grant 09208/2013; YR thanks the Commonwealth Scientific and Industrial Research Organisation and Stockholm Environment Institute for support; JG and CS acknowledge support from the Swedish Research Council Formas (grant 2012-1401) and SIDA for funding support to SEI's Producer to Consumer Sustainability Initiative to which this work is a contribution; JG acknowledges support from the Swedish EPA Naturvårdsverket within the PRINCE project.
Footnotes
- 6
- 7
The Brazilian Institute for Geography and Statistics divides Brazil into five macroregions: North, Northeast, Central-West, Southeast and South. See more at https://en.wikipedia.org/wiki/Regions_of_Brazil.
- 8
Here we included exclusively the soy consumed or traded as soybeans or one of its primary processed products (soy oil, soy meal and soy sauce), as well as the sugar cane consumed or traded as sugar or ethanol. The inclusion of embedded soy and sugar cane in third products that are heavily exported (Kastner et al 2014) would certainly decrease total Brazilian consumption and therefore its virtual water flow, because Brazil is a major exporter of products such as poultry, processed food and a large diversity of other commodities in which soy and sugar cane are embedded (Godar et al 2015).