

Abstract
Land is under pressure from a number of demands, including the need for increased supplies of bioenergy. While bioenergy is an important ingredient in many pathways compatible with reaching the 2 °C target, areas where cultivation of the biomass feedstock would be most productive appear to co-host other important ecosystems services. We categorize global geo-data on land availability into productivity deciles, and provide a geographically explicit assessment of potentials that are concurrent with EU sustainability criteria. The deciles unambiguously classify the global productivity range of potential land currently not in agricultural production for biomass cultivation. Results show that 53 exajoule (EJ) sustainable biomass potential are available from 167 million hectares (Mha) with a productivity above 10 tons of dry matter per hectare and year (tD Mha−1 a−1), while additional 33 EJ are available on 264 Mha with yields between 4 and 10 tD M ha−1 a−1: some regions lose less of their highly productive potentials to sustainability concerns than others and regional contributions to bioenergy potentials shift when less productive land is considered. Challenges to limit developments to the exploitation of sustainable potentials arise in Latin America, Africa and Developing Asia, while new opportunities emerge for Transition Economies and OECD countries to cultivate marginal land.
Export citation and abstract BibTeX RIS

Original content from this work may be used under the terms of the Creative Commons Attribution 3.0 licence. Any further distribution of this work must maintain attribution to the author(s) and the title of the work, journal citation and DOI.
1. Introduction
Global biomass production for energetic use has increased dramatically in recent years, mainly driven by increased demand for low-carbon energy [1–3]. Looking at future projections and, in particular, ambitious climate change mitigation pathways, this trend will likely continue and biomass will play an increasingly important role in the future energy mix [4].
Today, global biomass production is estimated to be slightly above 50 exajoule (EJ) yr−1 [3, 5]. It is widely agreed that this number will need to be increased significantly in order to achieve ambitious climate stabilization targets [6–8]. More precisely, estimating the technical potential of biomass production as a range over the transition pathways of the IPCC's AR5 leads to 10 to 245 EJ yr−1 primary energy from biomass by 2050 [4]. Those variations can mainly be explained by available studies treating various categories of land differently, for example, whether areas currently covered by forest are taken into account for potential biomass production [6, 9, 10] and regarding assumptions on future land productivity [6, 11].
Increased biomass cultivation can lead to negative effects from a broader sustainability perspective. This is a major concern, especially in highly productive areas [9]. For example, biodiversity loss in highly ambitious mitigation scenarios have been found to be nearly as high as in scenarios with the least ambitions due to the high degree of land use change for mitigation [13]. Furthermore, even if sustainability criteria are enforced in one region or one sector, land use changes including deforestation can be triggered elsewhere [14–16] or food prices may rise when biomass is used increasingly for energy purposes [7, 17, 18]. In this respect, the literature has identified a trade-off between sustainability goals, like avoiding deforestation, and high biomass production potentials for climate change mitigation [1, 6], though others identify ways to realize both goals to a certain extent when taking into account systems dynamics [19]. These add to social, technological, economic and livelihood dimensions of sustainability and can further aggravate them [49].
Clearly, when applying sustainability criteria, the available biomass potential decreases relative to the range of technically available potentials between 50 and 500 EJ yr−1 by mid-century as discussed in the current literature [20–26]. Applying the EU Renewable Energy Directive's sustainability criteria (RED) to technical potentials, Schueler et al [12] find that only 10% of the available technical potential, that is 98.5 EJ, can be used sustainably. In line with these findings, scientists now converge to an estimate of sustainably available biomass of about 100 EJ [3, 27]. Yet, such aggregated numbers often conceal where most of the potentials are lost to sustainability concerns and how productive they are.
This paper aims to contribute to closing this research gap by investigating the productivity distribution of land based on historic land availability and productivity of biomass cultivation. Following Schueler et al [12], sustainably available land is defined by applying the RED criteria in a geographically explicit way. Hence, we differentiate between sustainable, RED-compliant and unsustainable, non-compliant potential. We describe the full productivity spectrum as simulated by the process-based biosphere model LPJmL by looking at different deciles within all grid cells in which biomass yields occur and thus establish a simple, transparent statistical description of potentials in terms of areas and energy. Our main contribution is to offer a cross-disciplinary approach, identified as a future key research field regarding bioenergy and land use developments [27], that allows to compare globally aggregated biomass potential numbers cited above, very disaggregated land productivity maps [24] and bottom-up studies on land availability [25].
By building on a relatively simple data post-processing approach we can formulate some robust hypotheses e.g., concerning marginal areas, which could be sustainably cultivated, but which do not enter optimal pathways without further incentives or policy. We hence address current challenges to identify and increase effectiveness of land-related policy options for climate change mitigation [17] and adaptation [50], in a situation where land use change modeling and sector-specific resource estimates remain uncertain and modeling choices hamper tractability of results ex post and cross-disciplinary learning [28]. In addition, assessments in this area are driven by varying objectives and have often been dominated by climate change mitigation prioritization, which is many times not tractable for end users.
2. Methods and data
The analysis is based on geographically explicit data for the global land reserve at a spatial resolution of 0.5°. The area (in million hectares [Mha]) and productivity (in tons of dry matter [tDM]) are based on the biophysical crop model LPJmL [12, 28, 29] for the year 2000. It is straightforward to replicate the analysis for yield data from other vegetation models, where model intercomparison exercises show that LPJmL lies within the range of other models' estimates for at least the first half of the century in terms of net primary productivity and vegetation carbon [30]. Note that we are also using data from a period that has been extensively validated [29]. The analysis could easily be replicated for similar products from other models. In order to derive the land available for sustainable biomass production we exclude land currently used for agricultural purposes (cropland and pasture based on HYDE [31]) from land available for biomass production. The LPJmL model considers plant growth, carbon exchange and water limitations for managed and natural ecosystems. It includes biogeochemical yield potentials for biomass plantations under spatially varying conditions [29], which we use to analyze productivity. Plantations are modeled with highly productive cellulosic energy crops, defined by three crop functional types: two tree species (poplar and eucalyptus growth type) for temperate and tropical regions and one fast growing grass (switchgrass C4 growth type) (please see [29] for parameters. e.g. management assumptions, and further references on the model validation). The biomass plantation yield results were validated with present observations from test plantations, as well as with yield predictions for 2050 [32–38]5 . We abstract from management changes (irrigation, fertilization). There are no large-scale plantations of lignocellulosic crops in areas with unfavorable climate, soil and management conditions, yet. The transferability of results to these areas is thus debatable. Every grid cell with available land on which plantations' productivity is above zero is included in the potential to demonstrate the full productivity spectrum.
In order to identify biomass that can be used sustainably we apply the RED criteria, capturing a broad array of sustainability concerns, i.e. not only biodiversity protection, but also conservation of other ecosystems services, such as carbon storage, as described along with the individual steps of the analysis in appendix 1 of the supplementary information. Note, however, that our approach could easily be replicated with other criteria sets, depending on the decision-making context [29].
All grid cells in the land and productivity grid holding a potential >0 (34 142 in total) are sorted according to their productivity [tDM ha−1 a−1]. Their total amount is divided into deciles (each containing 3424 cells). This method provides a quantitative description of potentials independent of area size and productivity in a specific location. Note that deciles are thus fixed and do not vary across regions, which allows an unambiguous comparison of potentials across the globe. Within each decile we analyze the productivity of the potential biomass plantations [tDM ha−1 a−1] (figure 1), the respective land reserves [Mha] (figure 2(A)), and the energetic potentials in (EJ) (figure 2(B))—resulting from the combination of the previous two. We differentiate RED-compliant (figures 2(A) and (B), green areas) and non-compliant (gray areas in figure 2) shares and examine aggregated results and their distribution across ten world regions6 .

Figure 1. Productivity range within deciles. Length of bars is determined by maximum and minimum productivity, average productivity as marked by red dots and given in [tDM ha−1 a−1]. Background colors: green gradients comprise 'attractive' potentials (D1, 2, 3), orange shows 'marginal' potentials (D4, 5, 6) and yellow indicates 'low' potentials – same colors are used in figure 3.
Download figure:
Standard image High-resolution image
Figure 2. (A) Distribution of potential area [Mha] in deciles: square area represents the potential, shares of RED-compliant (green) and non-compliant (gray) potential on the vertical axis, shares of deciles in total area are on horizontal axis; (B) distribution of potential energy [EJ] in deciles: vertical axis same as in A, shares of deciles in total bioenergy are on horizontal axis.
Download figure:
Standard image High-resolution imageLand productivity in our dataset can be as high as 37.6 tD Mha−1 a−1 (figure 1). The first three deciles (colored green in figure 1 and the map in figure 3) contain biomass potentials from land with a productivity above 9.7 tD Mha−1 a−1, which in the following we refer to as 'attractive potential'. Deciles 4, 5 and 6 are less productive and are called 'marginal potential' (colored orange). Deciles 7–10 refer to 'low potential'. The productivity distribution shows a steep decline within the attractive share, leveling off in a slow linear proportional decline over the marginal and lowest shares.

Figure 3. Geographical distribution of global energy potential (i) for 10 different world regions (bar plots, see figure 2(B) for detailed description) and (ii) on global map. The first three deciles (D1, 2, 3, attractive potential) are colored in green (three gradients), marginal potentials (D4, 5, 6) in orange and lowest potentials (D7, 8, 9, 10) in yellow. Non-RED-compliant, sustainable potential is colored in gray.
Download figure:
Standard image High-resolution imageOnly 20% of total available land (5442 Mha) are RED-compliant, where the first, second and tenth deciles comprise larger areas than the remaining deciles (figure 2, horizontal axis). The attractive potential is distributed on an area of 1907 Mha, of which 1740 Mha are not RED-compliant. The share of RED-compliant areas increases from 4% to over 50% (figure 2(A), vertical axis) from D1 to D10. This indicates a higher risk of trade-offs between sustainability criteria in the attractive potential areas compared to the marginal ones. In terms of energy, the attractive deciles bear nearly 80% of the total energetic potential (690 EJ), which contain 53 EJ RED-compliant potentials.
3. Results
The data show that a doubling of today's bioenergy generation of approximately 50 EJ is possible at the global level, with feedstocks from RED-compliant energy crop plantations, located on 167 Mha with a productivity above 10 tD M ha−1 a−1. Another 36 EJ are added when including marginal potentials (i.e. D4–6) summing up to a RED-compliant potential of 86 EJ, with a remaining 12 EJ being located in low potentials.
Figure 3 shows the regional distribution of productivity deciles in bar charts, while the accompanying map displays the geographical distribution of sustainable potentials. Attractive potentials (in terms of productivity) are colored in green (three gradients), marginal potentials in orange and low potentials in yellow. Further grid cells bearing non-RED-compliant, unsustainable potential are colored in gray. Panels grouped around the map display the regional productivity spectrum of bioenergy potentials (horizontal axis) and RED compliance (vertical axis). The regional comparison offers insights into the RED compliance of bioenergy potentials, and the location of attractive, marginal and low potentials to achieve bioenergy policy targets.
Nearly half of the RED-compliant potentials worldwide are located in the attractive potential in four regions: Latin America (8.2 EJ), Africa (8.4 EJ), Developing (Dev.) Asia (12.6 EJ) and OECD North America (11.3 EJ). The other half of the sustainable potentials worldwide is based on contributions from marginal potentials of the Transition Economies (10.2 EJ), attractive potentials in China (8.2 EJ), and attractive and marginal potentials in the OECD Pacific (5.3 EJ) and in Europe (3 EJ).
In line with our expectations and anecdotal evidence, we observe a positive correlation between high-potential areas and sustainability concerns in most regions.
Figure 4 shows how the results translate into changes of land area by displaying a decomposition of regional changes of available areas [in Mha] in the ten world regions. RED-compliant areas are displayed as positive, non-compliant areas are in the negative range. RED-compliance would suggest that 1740 Mha in the highest productivity range (i.e. above 10 tD M ha−1 a−1, columns 1–3 in figure 4) would need to remain undeveloped, while only 167 Mha would be available for biomass production. The largest RED-compliant areas are found in OECD North America (36 Mha), Dev. Asia (34 Mha), Africa (28 Mha) and Latin America (27 Mha).
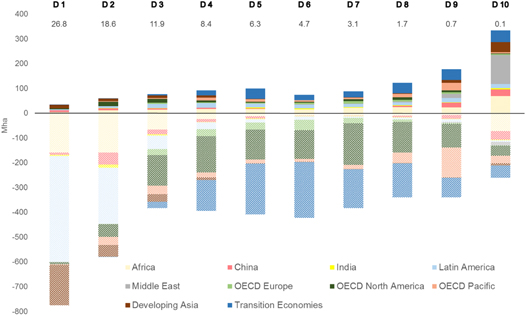
Figure 4. Distribution of RED-compliant and non-RED-compliant land by decile and region. Vertical axis shows potential areas in Mha; RED-compliant areas are described by positive, and non-compliant areas by negative numbers. Horizontal axis shows deciles (bold number), with respective average productivity [tD Mha−1 a−1] (second row, below D-labels, see also figure 1).
Download figure:
Standard image High-resolution imageWe illustrate this further by conducting a thought experiment. Figure 5 shows regional supply shares for two different options how to realize an additional 86 EJ (the potential that would be sustainably available from attractive and marginal potentials, D1–D6) of bioenergy from plantations, (A) by supplying the bioenergy from the most productive areas and (B) under RED-type sustainability criteria. For A, most bioenergy would be supplied by developing Asia, Latin America, and to a lesser extent, Africa. Only 5% of the total area would be RED-compliant. Given that it would be harvested from high-productivity areas, the bioenergy could be supplied from 194 Mha. In contrast, a global enforcement of RED-type sustainability criteria (B) would drastically change the picture: large marginal potential areas in the Transition Economies and OECD regions would need to be developed to substitute the necessary amounts of energy. As a consequence, more land (432 Mha) would be needed to provide the same amount of energy. As can be seen in panel B of figure 5, where the hatched areas correspond to D4–D6, the vast majority of the potentials is exploited from these less productive areas, however, showing severe regional differences. This points to a need for region-specific policy to incentivize exploitation of these marginal areas in order to reduce risks to sustainability from large-scale biomass cultivation in the more productive deciles.

Figure 5. Regional distribution of 86 EJ bioenergy supply that can be derived from attractive (D1–D3) and marginal (D4–D6) potentials. (A) Based on most productive areas (all in D1). The percentage share of RED-compliant areas is indicated in brackets. (B) Based on attractive (D1–D3) and marginal (D4–D6, dotted) RED-compliant potentials.
Download figure:
Standard image High-resolution image
4. Discussion
This study examines the range and distribution of regional bioenergy potentials, including both full technical potentials as well as limited potentials constrained by sustainability criteria, here exemplarily taken from the EU's RED. We are aware that we make a strong normative assumption by modeling the implementation of RED criteria globally. Their effectiveness in preventing biodiversity losses and ensuring GHG savings is disputable [17] even within the bioenergy market, and the directive does not apply to other agricultural sectors beyond bioenergy. Existing regional sustainability regulations only address specific sectors; their effectiveness on the global level remains questionable [40]. Still, the contribution of bioenergy policies to reach climate mitigation targets are explicitly regulated by the RED GHG-saving criteria and are thus a useful starting point.
Arguably, our approach relies on relatively aggregated data. Yet, it is a first step towards identifying hot spot areas for policy and future research, which can then zoom further in and take appropriate constraints and opportunities into account in a more detailed analysis. It can further be complementary to other analyses that base their insights on the full spectrum of productivity, but that have a focus on the categories of risk entailed in tapping into different regions of high productivity [41]. Temporal variations of land reserves and their productivity have been modeled dynamically taking climate and land use change into account [29]. In contrast to this branch of the literature, our analysis is static. Clearly, cropland expansion has been taking place since 2000 and will continue to do so in the future. These developments will increase challenges or open new opportunities to cultivate biomass sustainably. Changes in yields, agricultural practices, diets and market conditions will have a great influence on land availability, but future trends remain uncertain. The added value of our study is to offer an approach combining the productivity spectrum with geographically explicit analysis in order to provide information prior to these discipline- and policy-specific assumptions. For example, further analysis can be targeted on those regions where policy could help to take those areas into production that are currently not attractive. Thus our approach complements dynamic agro-economic models [8] by providing an improved ex-ante understanding of the productivity spectrum. By focusing on the comparative situation in ten different regions, quantifying and describing their options to develop RED-compliant, sustainable potential based on the status quo our study can help agro-economic modeling exercises to develop new scenarios for novel studies. It contributes to the literature by (i) offering new insights into the ranges of productivity and location of land reserves, quantitatively comparable across world regions, (ii) facilitating the current policy debate and (iii) fostering cross-disciplinary learning.
We find that much of the technical potential in the top productivity deciles falls prey to the RED criteria at the global scale. Large areas in Latin America and Developing Asia—that would be worthy of protection according to the RED definition—would be at risk of conversion without protection, as they occupy the most productive deciles. This is in particular true as those areas are typically located in regions with low institutional quality (see [51] for the case of forest governance).
However, some regions in South East Asia, Latin America and Africa feature substantial areas in highest productivity deciles that could be cultivated in a RED-compliant way. By locating the part of the mid-productivity deciles our results can help to target policy support (for yield increases, improved management systems or access to infrastructure) to marginal areas in the absence of globally consistent sustainability criteria and a governance mechanism that could enforce them. This could tweak the potential distributions to alleviate pressure on high productivity land, which is very much constrained by sustainability concerns.
If policy objectives related to climate change mitigation made exploitation of marginal potentials necessary for goals normally not priced into land use decisions, the mid-productivity deciles would become attractive. Degraded land assessments, with various definitions and data sources have looked at these potentials [42–44, 47]. Our quantitative results in terms of areas and productivity contextualize the degraded land potential discourse and shed new light on the relation between land reserves of different productivity around the globe.
Our results show that enforcing sustainability criteria would lead to a geographically more diversified bioenergy pathway. In the absence of global institutions or cooperation ensuring this, our results also help to identify tradeoffs and development opportunities to policymakers and private stakeholders who are interested in fostering sustainability, e.g. due to CSR considerations. Especially when it comes to claims of bioenergy contributions from low-productivity areas, our results show that these are not likely to be developed without effective regulations. This is an important step to substantiate and contextualize political targets for accessing marginal or restoring degraded lands and the re-utilization of abandoned cropland.
A possibly more effective way to enhance the sustainability of such bioenergy policies in the absence of a global top-down approach would be to encourage the development of marginal lands in suitable locations or encourage multiple uses of land (i.e. land sharing) [45]. Alternatively, sustainable intensification [46] can take pressure off the productive deciles with high sustainability concerns. Here, our approach can identify areas where such policies would be most promising. Such bottom-up policies can decrease the probability of developing areas subject to sustainability criteria (i.e. the share of RED-compliant, sustainable areas increases in our framework), while increasing carbon stocks and fostering other ecosystem services. This finding is supported by other studies, which focus on productivity increase and improvement of ecological-agricultural techniques in low productive grasslands, and abandoned or underused croplands [25, 48] as alternatives to land clearing. Further research is necessary in this field to identify region-specific opportunities, costs, political incentives and regulation to foster investments.
Acknowledgments
We thank Felix Creutzig for helpful comments and discussions.
Footnotes
- 5
Note that first observations of large-scale plantations indicate that sometimes only 50% of the maximal potentials can be achieved under unchanged environmental conditions [39]. This could reduce our sustainable potential down to 50 EJ, close to the biomass currently used energetically already.
- 6
See appendix 2 of the supplementary information for details.