

Abstract
The area covered by boreal forests accounts for ∼16% of the global and 22% of the Northern Hemisphere landmass. Changes in the productivity and functioning of this circumpolar biome not only have strong effects on species composition and diversity at regional to larger scales, but also on the Earth's carbon cycle. Although temporal inconsistency in the response of tree growth to temperature has been reported from some locations at the higher northern latitudes, a systematic dendroecological network assessment is still missing for most of the boreal zone. Here, we analyze the geographical patterns of changes in summer temperature and precipitation across northern Eurasia >60 °N since 1951 AD, as well as the growth trends and climate responses of 445 Pinus, Larix and Picea ring width chronologies in the same area and period. In contrast to widespread summer warming, fluctuations in precipitation and tree growth are spatially more diverse and overall less distinct. Although the influence of summer temperature on ring formation is increasing with latitude and distinct moisture effects are restricted to a few southern locations, growth sensitivity to June–July temperature variability is only significant at 16.6% of all sites (p ≤ 0.01). By revealing complex climate constraints on the productivity of Eurasia's northern forests, our results question the a priori suitability of boreal tree-ring width chronologies for reconstructing summer temperatures. This study further emphasizes regional climate differences and their role on the dynamics of boreal ecosystems, and also underlines the importance of free data access to facilitate the compilation and evaluation of massively replicated and updated dendroecological networks.
Export citation and abstract BibTeX RIS

Original content from this work may be used under the terms of the Creative Commons Attribution 3.0 licence. Any further distribution of this work must maintain attribution to the author(s) and the title of the work, journal citation and DOI.
1. Introduction
The circumpolar boreal forest primarily consists of a limited number of conifer species that are well adapted to an overall cool climate and relatively short growing seasons (Bonan and Shugart 1989). The huge biome covers approximately 16% of the global landmass with 11.6 × 10⁶ km2 in sub-Arctic environments (Bonan et al 1992, ACIA 2005). Boreal forests account for nearly 22% of the Northern Hemisphere landmass and 50% of the area >60 °N (Potapov et al 2008). The largest part of this biogeographic unit is located in Eurasia. Together with the Arctic tundra, the boreal zone stores an estimated ∼272 Pg of carbon (Pan et al 2013), which accumulates to around 14% of the Earth's terrestrial vegetation biomass (Bonan 2008, Malhi et al 2008). The boreal carbon pool is structured into 20% biomass and 60% soil (Pan et al 2011).
Recent warming across most of the high-northern latitudes has been reported to already shift the position of treeline ecotones (D'Arrigo et al 1987, Payette et al 2001, Esper and Schweingruber 2004, Holtmeier and Broll 2007), to affect species migration rates (Hickling et al 2006), and to prolong the length of growing seasons (Soja et al 2007, Zhang et al 2008). Sparse confidence regarding the causes and consequences of the observed environmental changes (Price et al 2013), however, bias any estimate of regional to large-scale carbon cycle dynamics (Bonan 2008, McGuire et al 2009, Pan et al 2011, 2013, Kurz et al 2013). Additional uncertainty emerges from the occurrence of irregular wild fires and massive insect outbreaks (Kurz et al 2008). Moreover, empirical evidence suggests both recent increases (Girardin et al 2011) and decreases in the radial growth of boreal forest trees (Wilmking et al 2004, 2005, D'Arrigo et al 2008, Girardin et al 2014), with further complexity originating from ecosystem models (Pan et al 2011, 2013).
Tree growth within the boreal forest, which is often characterized by low temperatures from autumn to spring, is hence mainly constrained by rather short vegetation periods between early-June and late-August (Shiyatov 1986, Seo et al 2011, Bryukhanova et al 2013, Jyske et al 2014). During the limited number of warm summer days, small variations in temperature means and/or extremes can already trigger substantial fluctuations in tree-ring width (TRW) (Esper et al 2010, Duchesne et al 2012), and more general in the production rate of entire forest ecosystems (Babst et al 2013, Kauppi et al 2014). Growing season lengths within Eurasia's boreal forest are known to vary by latitude and continentality from relatively long intervals including influences of May and September in the southwest (Linderholm 2001, Zhang et al 2016), such as Scandinavia, to extremely short vegetation periods starting not before July and often already ending in August in the northern coastal areas of eastern Siberia (Sidorova and Naurzbaev 2002, Piao et al 2007), for instance. Temperature limited forest growth generally enables sensitive TRW chronologies to be developed (i.e. time-series with a high degree of inter-annual variation), which have frequently been utilized for reconstructing summer temperatures at regional (Briffa et al 1995, Luckman et al 1997, Naurzbaev and Vaganov 2000, Kirchhefer 2001, Naurzbaev et al 2002, Briffa et al 2008, Esper et al 2012) and larger scales (D'Arrigo et al 2006, Mann et al 2009, Christiansen and Ljungqvist 2012, PAGES2k Consortium 2013 Wilson et al 2016). Composite TRW chronologies of living and relict material from Fennoscandia (Linderholm et al 2010), the Polar Urals (Shiyatov 1995, Briffa et al 2013), eastern Taimyr (Naurzbaev et al 2002), the Yamal Peninsula (Hantemirov and Shiyatov 2002, Briffa et al 2013), and northeastern Yakutia (Hughes et al 1999, Sidorova and Naurzbaev 2002), so far represent an important backbone for high-resolution paleoclimatology in Eurasia and during the common era (Briffa et al 2013, PAGES2k Consortium 2013, Büntgen et al 2014).
More dendroecological-oriented studies, however, indicate some sort of reduced summer temperature sensitivity at a few boreal forest sites (Jacoby and D'Arrigo 1995, Briffa et al 1998, Barber et al 2000, Lloyd and Fastie 2002, Wilmking et al 2005, Zhang et al 2008, Stine and Huybers 2014). This alleged phenomenon has been described as the inability of formerly temperature sensitive TRW and maximum latewood density chronologies to track instrumental-based warming since around the second half of the 20th century (Briffa et al 1998, 2004). In addition to this low-frequency trend offset between warmer measured and cooler reconstructed temperatures (Büntgen et al 2008), the potential failure of TRW following high-frequency climate signals has been reported for some individual boreal and alpine sites. Summarized as the 'divergence problem' (DP; for a discussion see D'Arrigo et al 2008), these two observations would not only have substantial implications on our ability of estimating changes in biomass production and carbon sequestration (Büntgen et al 2008, 2009, Esper and Frank 2009, Esper et al 2010), but would also question the reliability of tree ring-based temperature reconstructions, as well as our capability to model the productivity and functioning of forest ecosystems in a warmer world (Bonan 2008). Quantifying regional differences in the response of boreal forests to climatic changes and the subsequent effects on large-scale dynamics of the carbon cycle thus remains a pending, interdisciplinary scientific challenge (Frank et al 2010).
The ambiguity in determining spatial and temporal explicit patterns of boreal tree growth (Hellmann et al 2016) is occasionally exacerbated by inadequate observational programs and the geographical bias of most studies towards climate sensitive forest margins (Lloyd and Bunn 2007, Beck et al 2011). Currently available field assessments and remote sensing observations are often limited in the discrimination of natural ecosystem fluctuations from anthropogenically forced environmental changes (Bonan 2008). Network approaches of temperature and precipitation variability, as well as the analysis of site and species-specific growth trends and responses are generally restricted in space and time. An exception though describes the recent work by St. George (2014) and St. George and Ault (2014), in which the seasonal climate sensitivity of TRW chronologies from around the Northern Hemisphere has been evaluated. Superimposed on possible caveats that may arise from the uniform generalization of large-scale network approaches (St. George 2014, Hellmann et al 2016) are potential sources of meteorological station error (Frank et al 2007, Esper et al 2010), which can range from the initial measurement-level to the later girding process (Cowtan et al 2015, Jones 2016). Non-systematic error that is particularly difficult to detect (Frank et al 2007), exists in many of the overall short and often even incomplete station records from Eurasia's northern latitudes (Esper et al 2010). Associated homogeneity issues of instrumental measurements have been further recognized to complicate any straightforward proxy-target calibration exercise and subsequent climate reconstruction development (Frank et al 2007, Büntgen et al 2015), for instance.
A poor understanding of the combined abiotic and mechanistic drivers, and thereby dynamic behavior, of the boreal ecosystem emphasizes the urgent need for a thorough collection and systematic assessment of highly resolved and spatially extensive tree-ring proxy and meteorological target data that continuously cover at least several decades (Esper et al 2010, St. George 2014, Hellmann et al 2016).
In seeking to overcome the above mentioned limitations, we compiled the so far best-replicated dendroecological network of Eurasia's boreal forest >60 °N. Together with a careful assessment of regional temperature and precipitation variability, we analyzed growth trends and climate responses of 445 TRW site chronologies over the last six decades. The resulting patterns allowed us to see if spatiotemporal differences in climate variability have affected the climate sensitivity of pine (Pinus sp.), larch (Larix sp.) and spruce (Picea sp.) on inter-annual to decadal time-scales during the second half of the 20th century. Critical discussion has been devoted to challenge the a priori assumption that boreal TRW chronologies are suitable for reconstructing summer temperatures. Some emphasis was then given to novel directions in tree-ring research that consider the role of regional differences in the climate system itself, and ultimately aim at the development of large-scale networks to overcome logistical restrictions in the distribution of sampling sites, and thus help to better fulfill ecological and climatological criteria.
2. Material and methods
Our newly developed Eurasian TRW network covers the boreal forest between 0–180 °E and >60 °N. This unique compilation consists of 285 annually resolved and absolutely dated TRW measurement files from the International Tree Ring Data Bank (ITRDB; http://ncdc.noaa.gov/data-access/paleoclimatology-data/datasets/tree-ring) (Grissino-Mayer and Fritts 1997), as well as a total of 160 newly developed and mostly unpublished TRW chronologies from Russia (figure 1).
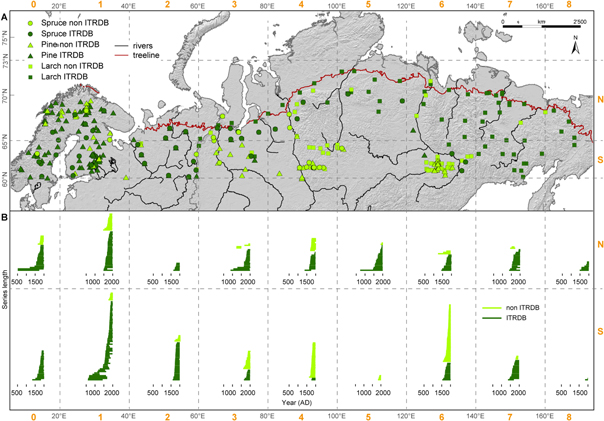
Figure 1. (A) Distribution of 445 TRW chronologies across the Eurasian boreal forest zone from >60 °N and 0–180 °E. Data are separated between northern (N, 66–73 °N) and southern (S, 60–65 °N) regions and from west to east from 0–20 °E (0), 21–40 °E (1), 41–60 °E (2), 61–80 °E (3), 81–100 °E (4), 101–120 °E (5), 121–140 °E (6), 141–160 °E (7), 161–180 °E (8). Symbols indicate the three main boreal forest species spruce (Picea sp.), pine (Pinus sp.), and larch (Larix sp.) and colors refer to the source (dark green: ITRDB, light green: not ITRDB). The red line represents the northern timberline and shows that the network is spatially well covering the boreal forest zone. (B) Length of all site chronologies separated by the grid cells N0-N8 and S0-S8 and colors referring to the source as in (A).
Download figure:
Standard image High-resolution imageThe entire TRW network contains 186 pine (Pinus sp.; 126/60, ITRDB/non-ITRDB), 187 larch (Larix sp.; 112/75) and 72 spruce (Picea sp.; 47/25) sites. This dataset was further separated into a southern belt from 60–65 °N (labeled as S) and a northern belt from 66–73 °N (labeled as N). A simple geographical grouping was applied to best represent nine west-east grid cells within two latitudinal bends, which resulted in 18 spatial subsets: 0–20 °E (labeled as S0/N0), 21–40 °E (S1/N1), 41–60 °E (S2/N2), 61–80 °E (S3/N3), 81–100 °E (S4/N4), 101–120 °E (S5/N5), 121–140 °E (S6/N6), 141–160 °E (S7/N7), and 161–180 °E (S8/N8). For an overview on the distribution of sites per species and grid see table 1.
Table 1. For each grid, N0-N8 and S0-S8, the number of sites and their trend behavior is shown for all species and separated for pine, larch and spruce. Trends and temperature/precipitation average values were calculated for each region, i.e. grid. Additionally, mean, maximum and minimum correlation coefficients of the tree-ring sites with temperature and precipitation are presented per region. Significant trend values are indicated by bold numbers. TRW: tree-ring width, JJ: June–July, T: temperature, P: precipitation, Max: maximum, Min: minimum.
| N0 | N1 | N2 | N3 | N4 | N5 | N6 | N7 | N8 | |
|---|---|---|---|---|---|---|---|---|---|
| Sites | 26 | 42 | 6 | 20 | 25 | 22 | 15 | 18 | 7 |
| Pinus sites | 25 | 36 | 2 | 0 | 0 | 0 | 1 | 0 | 0 |
| Larix sites | 0 | 0 | 1 | 14 | 18 | 19 | 14 | 18 | 7 |
| Picea sites | 1 | 6 | 3 | 6 | 7 | 3 | 0 | 0 | 0 |
| TRW trend | 0.03 | −0.01 | −0.38 | 0.20 | −0.10 | −0.30 | 0.16 | −0.27 | −0.17 |
| TRW trend Pinus | 0.03 | −0.07 | −0.49 | — | — | — | 0.13 | — | — |
| TRW trend Larix | — | — | −0.10 | 0.23 | −0.02 | −0.30 | 0.15 | −0.27 | −0.17 |
| TRW trend Picea | 0.46 | 0.03 | −0.25 | 0.10 | −0.19 | −0.33 | — | — | — |
| T trend | 0.20 | 0.16 | 0.15 | 0.21 | 0.17 | 0.19 | 0.25 | 0.20 | 0.35 |
| P trend | 0.01 | 0.17 | −0.03 | −0.19 | −0.14 | −0.06 | 0.08 | −0.01 | −0.12 |
| mean JJ T (°C) | 9.72 | 11.65 | 11.30 | 9.34 | 9.13 | 11.29 | 11.38 | 9.94 | 6.72 |
| mean JJ P (mm) | 78.60 | 58.29 | 48.49 | 44.50 | 51.14 | 44.24 | 44.70 | 35.62 | 33.62 |
| Mean TRW-JJT correlation | 0.30 | 0.32 | 0.28 | 0.45 | 0.49 | 0.41 | 0.22 | 0.51 | 0.18 |
| Max TRW-JJT correlation | 0.59 | 0.66 | 0.49 | 0.79 | 0.78 | 0.54 | 0.53 | 0.77 | 0.31 |
| Min TRW-JJT correlation | −0.18 | 0.01 | 0.07 | −0.17 | 0.20 | 0.21 | −0.04 | 0.07 | 0.11 |
| Mean TRW-JJP correlation | −0.11 | −0.07 | 0.13 | 0.00 | −0.10 | −0.11 | 0.14 | −0.05 | −0.28 |
| Max TRW-JJP correlation | 0.26 | 0.24 | 0.29 | 0.32 | 0.25 | 0.17 | 0.43 | 0.24 | −0.15 |
| Min TRW-JJP correlation | −0.36 | −0.49 | −0.07 | −0.43 | −0.44 | −0.36 | −0.09 | −0.23 | −0.40 |
| S0 | S1 | S2 | S3 | S4 | S5 | S6 | S7 | S8 | |
| Sites | 23 | 64 | 33 | 22 | 39 | 3 | 60 | 18 | 2 |
| Pinus sites | 16 | 58 | 11 | 11 | 9 | 1 | 13 | 3 | 0 |
| Larix sites | 0 | 1 | 11 | 5 | 18 | 0 | 44 | 15 | 2 |
| Picea sites | 7 | 5 | 11 | 6 | 12 | 2 | 3 | 0 | 0 |
| TRW trend | −0.15 | 0.08 | −0.13 | 0.16 | 0.04 | −0.32 | −0.33 | −0.45 | 0.28 |
| TRW trend Pinus | −0.39 | 0.10 | −0.10 | 0.13 | −0.06 | −0.11 | −0.30 | −0.48 | — |
| TRW trend Larix | — | −0.13 | −0.16 | 0.28 | 0.14 | — | −0.30 | −0.19 | 0.28 |
| TRW trend Picea | −0.03 | −0.19 | −0.06 | −0.49 | 0.05 | −0.35 | 0.25 | — | — |
| T trend | 0.23 | 0.23 | 0.17 | 0.17 | 0.18 | 0.28 | 0.37 | 0.37 | 0.30 |
| P trend | 0.02 | 0.10 | −0.01 | −0.15 | −0.10 | 0.10 | 0.01 | −0.04 | −0.03 |
| mean JJ T (°C) | 11.84 | 14.93 | 14.86 | 14.50 | 14.18 | 14.47 | 13.86 | 8.10 | 8.80 |
| mean JJ P (mm) | 77.13 | 62.49 | 68.15 | 66.44 | 62.73 | 53.33 | 52.38 | 55.88 | 41.39 |
| Mean TRW-JJT correlation | 0.05 | 0.09 | 0.28 | 0.17 | 0.25 | 0.02 | 0.03 | 0.19 | 0.45 |
| Max TRW-JJT correlation | 0.60 | 0.41 | 0.77 | 0.48 | 0.60 | 0.08 | 0.48 | 0.50 | 0.54 |
| Min TRW-JJT correlation | −0.50 | −0.23 | −0.13 | −0.21 | −0.19 | 0.08 | −0.22 | −0.21 | 0.36 |
| Mean TRW-JJP correlation | −0.01 | 0.16 | 0.00 | 0.00 | 0.08 | −0.03 | 0.10 | −0.05 | −0.19 |
| Max TRW-JJP correlation | 0.35 | 0.60 | 0.30 | 0.28 | 0.35 | 0.00 | 0.47 | 0.17 | −0.08 |
| Min TRW-JJP correlation | −0.34 | −0.18 | −0.47 | −0.29 | −0.28 | −0.06 | −0.22 | −0.34 | −0.30 |
The individual TRW sites are relatively well distributed across northern Eurasia (figure 1). The dendroecological/-climatological sampling sites are not limited to higher elevations—a feature that especially accounts for many temperate and warmer areas, such as the Mediterranean basin (figure S1, Galván et al 2014), for instance. However, the distribution of sampling sites often reflects the infrastructural background of a region. Remote regions tend to contain only very few data, particularly around the Vilyuy River in Yakutia (S5 with two sites), as well as large parts of continental southeastern Siberia (S8 with two sites). Regions that are characterized by better infrastructural settings, such as Scandinavia (S1 and N1 with 64 and 42 sites, respectively), and areas nearby Russian university cities like Krasnoyarsk (S4 with 38 sites) and Yakutsk (S6 with 60 sites), exhibit dense networks of regional tree-ring research. Due to the unprecedented Schweingruber sampling campaign in the 1990s, the northern timberline is well represented by numerous TRW sites (Schweingruber and Briffa 1996, Esper and Schweingruber 2004).
Larix presents the shortest (1976–1998 AD) but also the longest (−764 to 2005 AD) TRW site chronology. Nearly 60% of all chronologies from the three species have recent end dates before 1996 (i.e. those from the ITRDB). Originating from Fennoscandia, the Russian Polar Urals, eastern Taimyr, Yamal and northeastern Yakutia, only ten chronologies continuously cover the last millennium. The average growth rate (AGR) per geographical grid in the northern belt ranges from 0.33–1.34 mm and is on average 0.75 mm for larch, 1.05 mm for pine and 0.80 mm for spruce (table S1). With a minimum AGR of 0.50 mm and a maximum of 1.85 mm, the AGR is generally higher in the southern belt with 1.03 mm for larch, 1.07 mm for pine and 1.12 mm for spruce. Averages for the three species of maximum and minimum mean segment lengths (MSLs) for each grid are similar between the northern (132 and 48 years) and southern (141 and 49 years) grid cells. MSL per species averaged over all northern and southern grids, respectively, reveals differences between north and south. Larch, pine and spruce reveal a MSL of 106, 100 and 84 years in the north compared to a MSL of 93, 88 and 80 years in the south (table S2).
Age trends in the raw TRW measurements were removed with the ARSTAN software (ARSTAN_41d for Windows) (Cook and Krusic 2007) by applying negative exponential functions (Fritts 1976) after power-transformation (PT; Cook and Peters 1997), where residuals were used to compute dimensionless TRW indices. Variance changes in the resulting index chronologies from the ARSTAN standard routine were further stabilized (VS; Osborn et al 1997), and truncated at a minimum replication of five series before any further calculations were performed with the program R (R Core Team 2014).
A recent version of ArcGIS (10.1 SP1 for Desktop by Esri) was used for all mapping purposes. Monthly resolved temperature means and precipitation totals were extracted from the gridded 0.5° × 0.5° CRU dataset (CRU TS3.22; Harris and Jones 2014) over the period 1901–2013. A total of 18 regional climate subsets was developed to best match the geographical distribution of the corresponding TRW divisions (S0-S8 and N0-N8). The Mann-Kendall test adapted to autocorrelation (Hamed and Rao 1998) was applied to assess and quantify trends and their significance levels in the climatological target (temperature and precipitation) and dendrochronological proxy (TRW) time-series back to 1951 AD. Trends in the TRW chronologies from 1951 to their individual recent end years were calculated per grid cell and conifer species (see also supplementary material for details), as well as for the mean of all chronologies per grid. Temperature means and precipitation totals from June–July (JJ), as derived from the nearest meteorological grid, were used for growth-climate response analyses over the 1951–1990 common period. The interval from 1951–1990 was chosen as a compromise between a reliable time span (40 years) and the intention to include as many TRW site chronologies as possible. Correlation coefficients were calculated for different monthly and seasonal means, i.e. June, July, JJ, as well as June–August (JJA). Only small variations between the different temperature means, together with the overall highest temperature associations, as well as the methodological restriction of a uniform network analysis in general, i.e. the impracticality of showing individual best results for each site (St. George 2014), justified utilization of the JJ meteorological target season for most of our investigations (see supplementary material for other seasonal windows).
The significance of each Pearson's correlation coefficient was determined after reducing the degrees of freedom according to the temporal autocorrelation characteristics within both, the proxy and target data (Fritts 1976). A simple classification scheme of values <0.3, 0.3–0.39 and ≥0.4 was additionally considered to illustrate different levels of the obtained growth-climate relationships. Results were visualized on an interpolated, high-resolution background map showing JJ temperature means and precipitation totals of 1951–2000 (Hijmans et al 2005). Site-specific correlation coefficients between summer temperature means and precipitation totals were further plotted against latitude. Linear trend lines were computed to visualize possible dependencies.
3. Results
3.1. Climate patterns
Temperature and precipitation across the boreal forest zone vary depending on latitude, continentality as well as the location and orientation of mountain ridges (table 1, figures 3 and S3). Cool summer temperatures characterized much of the coastal areas within the two most western grid cells (S0 and N0). Mean JJ temperatures in the Fennoscandian part of the network were 11.8 °C and 9.7 °C (1951–2013), respectively. JJ temperatures north of 65 °N declined eastwards to central Siberia from N1 up to N4 (from 11.6 °C to 9.1 °C). Even further east, mean JJ temperatures from 1951–2013 were generally higher (11.3 °C and 11.4 °C for N5 and N6, respectively), but with 9.9 °C and only 6.7 °C again lower in N7 and N8. This drop was even more pronounced in the south, where mean JJ temperatures did not vary much from S1 to S6 (14.9 °C in S1 to 13.9 °C in S6), but declined to 8.1 °C and 8.8 °C in S7 and S8, respectively. Average temperatures for each grid were constantly declining from the south to the north from 20 °E to ∼110 °E (figure 3). From 110 °E to ∼135 °E, the continental climate caused overall warm summer temperatures as far north as 66 °N (12.5 °C–15 °C), whereas further east colder JJ temperatures (5 °C–10 °C) were prevailing that went up to 15 °C in the central Kolyma region of eastern Siberia (figure 3). Precipitation was declining eastwards in the north from 78.6 mm (N0) to 33.6 mm (N8) and in the south from 77.1 mm (S0) to 41.4 mm (S8).
Trends in JJ temperature means over 1951–2013 AD were all positive and in S0, S1, S5, S6, S7 and S8 and N0, N6 and N8, summer temperature increased significantly (p ≤ 0.01) (figure 2). N8 was the only sub-region that exhibited a statistically significant (p ≤ 0.01) negative precipitation trend.

Figure 2. (A) Trends for temperature and precipitation (both JJ), as well as TRW data over the period 1951–2013 for climate data and from 1951 AD to the most recent year for TRW data. High-resolution (0.5 × 0.5) gridded climate data from the CRU dataset were used (CRU TS3.22, land only). Data are separated between northern (N, 66–73 °N) and southern (S, 60–65 °N) regions and from west to east from 0–20 °E (0), 21–40 °E (1), 41–60 °E (2), 61–80 °E (3), 81–100 °E (4), 101–120 °E (5), 121–140 °E (6), 141–160 °E (7), 161–180 °E (8). TRW data include all sites per region, independently of the species. Trend lines are linear regression models and the significance (p ≤ 0.01) of the trends was tested with the Mann-Kendall trend test for autocorrelated data (Hamed and Rao 1998). Trends in TRW were calculated for chronologies after power transformation and removed age trend by applying modified negative exponential curves. (B) TRW trends for the same period classified in positive (pink) and negative (brown) trends separated by significance (full dots or circles, p ≤ 0.01).
Download figure:
Standard image High-resolution image3.2. Growth variability and climate sensitivity
TRW trend analyses did not reveal a consistent picture across regions and species with only a few statistically significant positive growth trends (table 1, figure 2). A significant TRW increase was found in grid S8, which was, however, only sparsely represented by two larch chronologies. Significant TRW decreases were found in the northern subsets N2, N5 and N7, as well as the southern grid cells S6 and S7. TRW trends were, however, considerably different between the three conifer species (figure S2). Site-specific calculations revealed significant negative TRW trend for 103 (23.1%) chronologies, whereas only 30 (6.7%) sites exhibited a significant increase in TRW (figure 2). Long-term reductions in TRW were most pronounced in eastern Siberia.
Temperature sensitive sites were mostly found in the north with best results for JJ but signals depended on the season and precipitation sensitivity was barely found. For 35 (7.9%) TRW site chronologies no climate correlation could be calculated as the measurements did not cover the necessary interval 1951–1990. A total of 74 (16.6%) out of 445 TRW sites correlated significantly positive (p ≤ 0.01) with JJ temperatures (figure 3). Forty chronologies of the significant JJ sites and hence more than half (54%) consisted of larch, 22 (30%) of spruce and twelve (16%) of pine trees. A total of 80.0% of the significant temperature sites were located north of 65 °N, where the JJ temperature mean for 1951–2013 was almost three degrees lower compared to the south (10.1 °C and 12.8 °C, respectively) and most were located in zones with mean JJ temperature between 5 °C and 10 °C (figure 3). Only some temperature sensitive sites were located in regions with mean JJ temperatures around 10 °C–12.5 °C and few sites are close to regions with mean temperatures ranging from 2.5 °C–5 °C and 12.5 °C–15 °C, respectively. The low temperatures of 2.5 °C–5 °C that barely allowed tree growth were caused by cold June temperatures for these regions, whereby July favored tree growth with much warmer temperatures (>10 °C; figure S3). Mean JJA temperatures were rarely below 7.5 °C (figure S3). Warm JJ temperatures from 12.5 °C–20 °C around the middle and lower part of the Lena River—the region with the warmest summers in the entire boreal Eurasia—explained missing temperature signals in this area.
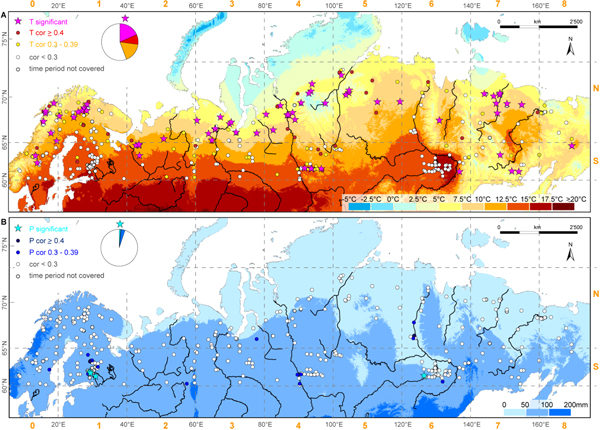
Figure 3. Pearson's correlation coefficients between TRW sites of pine, spruce, and larch and June–July (JJ) temperature (A) and JJ precipitation (B). Colors indicate the correlation coefficients classified into values <0.3, 0.3–0.39 and ≥0.4, and the pie charts show the proportions of the different classes for temperature (A) and precipitation (B). Stars highlight significant (p ≤ 0.01) correlation coefficients. Correlations were calculated over the period 1951-1990 against high-resolution (0.5° × 0.5°) gridded mean JJ temperature (A) and precipitation (B) data, respectively, from the CRU dataset (CRU TS3.22; land only). TRW chronologies were power transformed and age trend was removed by applying a negative exponential detrending. Background shading indicates mean JJ temperature (A), and mean JJ precipitation (B) for 1950–2000 AD (Hijmans et al 2005).
Download figure:
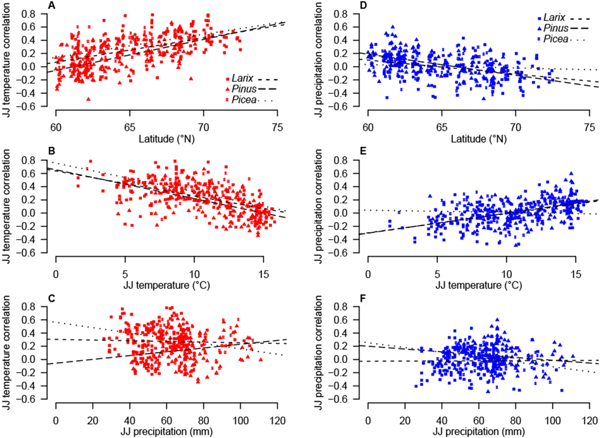
Standard image High-resolution imageThe majority of TRW sites with significant positive temperature correlations (73.4%) showed a negative precipitation signal and the highest positive precipitation correlations did not exceed r = 0.32–0.49. Most of the significant temperature sites (65.4%) had a JJ correlation higher than r = 0.5 and the lowest significant JJ correlation coefficient was r = 0.45. Only five sites had a significant positive correlation with precipitation (p ≤ 0.01). Besides one larch site in Yakutia, these stands were pine sites in southeastern Fennoscandia, located at 61 °N. Of all sites, 111 (24.9%) had a correlation higher than r = 0.39 with JJ temperature, and seven (1.6%) with precipitation. More than half of the TRW sites (51.3%) revealed correlations with temperature below r = 0.3, and even 87.2% with precipitation. The correlation between TRW and temperature increased with latitude (figure 4), whereas the precipitation sensitivity decreased northwards. Accordingly, the temperature (precipitation) signal decreased (increased) with rising temperatures. Neither temperature nor precipitation sensitivity exhibited a clear relationship with increasing or decreasing precipitation totals. The mean correlation between temperature and TRW was in general higher in the north than in the south (0.35 versus 0.17) while the correlation of TRW with precipitation was on average negative and did not vary between north and south. Temperature means and precipitation totals were mostly negatively correlated.
Figure 4. Pearson correlation coefficients against temperature (red, (A)–(C)) and precipitation ((D)–(F), blue), as a function of latitude (A) and (D), JJ temperature mean (B) and (E), and JJ precipitation (C) and (F). Species are indicated by symbols. Dashed lines show linear trends per species.
Download figure:
Standard image High-resolution image
4. Discussion
The division of our boreal TRW network into northern and southern subsets implied that some grid cells were fully covered by landmass, whereas others, mainly the northern grid boxes, also included sea surface. The sites in these grid cells were generally closer to each other as the area over which they spread is smaller and hence the mean correlation between sites (Rbar) was higher in the north (figure S7). N5 and N6 for example, almost fully covered by land and sites widespread from north to south showed Rbar values ∼0.4 similar to the southern grid cells (figure S7). The Rbar was highest (0.8) in N2, where only a few spruce and pine sites were distributed across a small area.
The inter-series correlation (Rbar) calculated for all sites per grid cell did not vary remarkably between species and regions. The correlation was, however, higher within most of the northern subsets compared to the southern grid boxes (0.55 versus 0.35). Mean values were calculated by averaging the inter-series correlation coefficients from each site.
The length of individual TRW chronologies considerably differed. Fennoscandia contained most of the millennial-long records and also showed the highest spatial coverage and density, whereas data availability in many of the remote parts of Russia was limited (figure 1). The development of millennial-long composite chronologies requires intense sampling campaigns of living, dry-dead and subfossil wood, ideally together with an integration of several site chronologies that show the same growth signal. Remote regions, such as the far northeast of Siberia, where sampling is exceptionally costly, thus lack well-replicated composite chronologies that extend back into medieval or even earlier times (Büntgen et al 2014).
Average temperature means and precipitation totals for the northern and southern grid boxes implied that different elevations and topography can influence the climate sensitivity of TRW chronologies in some grid cells (table 1). In fact, much of the mountainous regions in eastern Siberia were colder than the western Siberian lowland or eastern Fennoscandia. Micro-site conditions such as the distance to lakes and rivers, as well as soil conditions and moisture content were also important factors in determining tree growth responses (Düthorn et al 2013, Kirdyanov et al 2013, Linderholm et al 2014). Small-scale analyses that accurately consider local climate conditions were, however, not achievable within systematic large-scale network approaches, such as herein presented.
The early ending of many TRW chronologies before the mid-1990s affected their trend behavior, and likely accounted for the low number of positive growth trends that was in disagreement with the significant temperature increase. Overall, the different end years in combination with the partly short time periods covered influenced the trend behavior. It should be noted that the calculation of temperature trends only until 1990 also resulted in less significant and less positive trends.
The fact that most of the significant temperature sensitive sites were larch and spruce was due to the natural distribution of forest types (Bartalev et al 2004). Larch dominated forests were mainly found in the northern-central and northeastern part of Russia. Spruce and pine forests were prevalent in the southern-central and western part of Russia, as well as in Scandinavia. Despite of different treeline species in Scandinavia (pine) and Siberia (larch), summer temperatures did not differ much along the entire boreal treeline (figure S3). However, winters were much colder in Siberia than in Fennoscandia.
Results from network approaches for both, smaller areas in western Russia as well as the entire Northern Hemisphere (St. George 2014, St. George and Ault 2014, Matskovsky 2016), revealed similar results, i.e. heterogeneous climate responses with overall increasing temperature sensitivity at higher latitudes. In comparison to St. George (2014) and St. George and Ault (2014), we updated the ITRDB data by additional chronologies. In this way we improved the spatial replication, particularly towards southern areas and further considered additional summer monthly and seasonal means, as well as a suite of slightly different tree-ring standardization and chronology development techniques. Although our study generally confirmed stronger TRW responses to summer temperatures at higher latitudes, it was spatially limited to reproduce the often reported response shift towards increased moisture sensitivity at around 60 °N (Babst et al 2013, St. George 2014, Seftigen et al 2015, Matskovsky 2016).
Based on one detrending and standardization method only, the TRW network did not reflect a homogeneous climate signal for the entire boreal forest zone. Several sites would most probably show higher and significant correlations if specific methods were applied for each site. We tested 30 and 300-year cubic smoothing splines with 50% variance cutoff (Cook and Peters 1981), as well as negative exponential functions (Fritts 1976), and have chosen the latter method due to best average results. For several sites, other detrending methods, such as RCS detrending (Esper et al 2012), which is mainly applied for composite chronologies and the preservation of lower frequency variability (Cook et al 1995, D'Arrigo et al 2006), may have possibly resulted in higher correlations. We also restricted the main figures to one season (JJ) only, which overall revealed the best results, even though for some sites higher correlation values were obtained with other monthly or seasonal temperature summer means (figure S3). A total of 74 significantly positive correlations were found with the seasonal JJ window, compared to 68 with JJA, 51 with June and 67 with July temperature means (table S3). A total of 51 sites showed significant positive correlations against both, JJ and JJA temperature, whereas 35 (36) chronologies correlated significantly positive with JJ, as well as the monthly temperature means of June (July). Ten site chronologies had a significant temperature signal against all seasons for which we calculated correlations, that is JJ, JJA, June, and July monthly means. Correlations with precipitation would likely have been higher for some sites when calculating against earlier summer totals at the onset of the growing period (Helama and Lindholm 2003, Helama et al 2005, Hellmann et al 2015). Calculations using mean March–May precipitation totals, however, did not reveal better results. Our aim was though to realize a network analysis that systematically tested for different parameters and the season was also chosen based on best average results. The northern TRW sites were in general more sensitive to summer temperature and therefore more suitable for temperature reconstructions. However, our study strengthened the importance of specific analytical methods for each site and denied the implicit suitability of boreal tree-ring data for temperature reconstructions. Taking into account the duration of the vegetation period based on summer temperatures, continentality, latitude and longitude, specific tests need be applied to prove the temperature sensitivity of a tree-ring site. To facilitate similar network approaches in the future, data exchange and free data access are indispensable. An update of many chronologies, mainly from the Schweingruber sampling campaign in the 1990s, is needed and highly relevant as it would allow better understanding of reactions of boreal trees to recently increasing temperatures.
5. Conclusions
The so far best-replicated TRW network for Eurasia >60 °N, together with a careful assessment of spatially explicit temperature and precipitation variability, allowed for the first systematic evaluation of growth trends and climate responses of 445 Pinus, Larix and Picea TRW chronologies since 1951 AD. While summer warming was significant (p ≤ 0.01) over most of Eurasia's boreal zone, fluctuations in precipitation and forest growth were spatially more diverse and overall less important. Significant TRW sensitivity to JJ temperature variability was generally restricted to higher latitude sites >65 °N, whereas precipitation was most influential at a few southern sites. Only 16.6% of all TRW sites responded significantly (p ≤ 0.01) to JJ temperatures. The surprisingly high level of heterogeneity in the climatic response of boreal forest growth questioned the a priori suitability of northern Eurasian TRW chronologies for summer temperature reconstructions. At the same time, our results stressed the need of refined analyses that consider the role of regional differences in the climate system itself, as well as ecological conditions that may vary from site-to-site.
Acknowledgments
This study is part of the ongoing 'Arctic Driftwood' project that receives support from the Eva Mayr-Stihl Foundation and the Swiss Federal Research Institute WSL. Novel tree-ring data from Siberia were partly assembled under the Russian Science Foundation project 14-14-00295. We are particularly thankful to all ITRDB contributors. U Büntgen received funding from the Ministry of Education, Youth and Sports of CR within the National Sustainability Program I (NPU I), grant number LO1415. This study was partly motivated by the interdisciplinary and international framework of the PAGES initiative (Euro-Med 2k), which in turn received support from the US and Swiss National Science Foundations, US National Oceanographic and Atmospheric Administration and by the International Geosphere-Biosphere Programme.
Author contributions
UB and LH conceived and developed the study. UB and LH wrote the paper together with input from JE and FCL. All authors carefully edited previous versions of the manuscript and vitally contributed to discussion. All authors provided data and/or performed analyses.
Competing financial interests
The authors declare no competing financial interests.