


Abstract
The interannual relationship between North American (NA) winter temperature and large-scale atmospheric circulation anomalies and its decadal variation are analyzed. NA temperature anomalies are dominated by two leading maximum covariance analysis (MCA) modes of NA surface temperature and Northern Hemisphere 500 hPa geopotential anomalies. A new teleconnection index, termed the Asian-Bering-North American (ABNA) pattern, is constructed from the normalized geopotential field after linearly removing the contribution of the Pacific-North American (PNA) pattern. The ABNA pattern is sustained by synoptic eddy forcing. The first MCA mode of NA surface temperature is highly correlated with the PNA and ABNA teleconnections, and the second mode with the North Atlantic Oscillation (NAO). This indicates that NA temperature is largely controlled by these three large-scale atmospheric patterns, i.e., the PNA, ABNA and NAO. These temperature-circulation relationships appear stationary in the 20th century.
Export citation and abstract BibTeX RIS

Original content from this work may be used under the terms of the Creative Commons Attribution 3.0 licence. Any further distribution of this work must maintain attribution to the author(s) and the title of the work, journal citation and DOI.
1. Introduction
The tropical sea surface temperature (SST) anomaly, in particular the El Niño—Southern Oscillation (ENSO), has a significant influence on the large-scale atmospheric circulation (e.g., Trenberth et al 1998). For instance, the Pacific-North American pattern (PNA, Wallace and Gutzler 1981), one of the most pronounced teleconnections in the northern winter, tends to be positive during El Niño events (e.g., Renwick and Wallace 1996). Thus understanding of the tropical SST variability has important implications for North American (NA) climate prediction. The tropical SST variability and predictability, and their impacts on NA climate and climate prediction have been extensively investigated (e.g., Trenberth et al 1998, Liu and Alexander 2007 and references therein; Sheffield et al 2013). Besides the well-known tropical SST impact, recent studies suggest that NA climate is also related to extratropical circulation patterns and anomalies in snow cover and SST (e.g., Cohen et al 2007, 2014, Ding et al 2011, Lin and Wu 2011, 2012, Francis and Vavrus 2012, Wang et al 2014, Kug et al 2015). For example, the severe 2013/2014 NA cold winter is associated with a pronounced anticyclonic anomaly over the Gulf of Alaska-Bering Sea and a cyclonic anomaly downstream over NA, as well as remarkable SST anomalies over the northeast Pacific, whereas it is weakly related to the tropical SST (Bond et al 2015, Hartmann 2015, Yu and Zhang 2015). An improved understanding of NA climate variability and its association with atmospheric patterns is crucial for improving its climate prediction.
In this study, the interannual relationship between NA winter temperature and large-scale atmospheric circulation anomalies is revisited. Besides the PNA and NAO (North Atlantic Oscillation, e.g., Hurrell et al 2003) patterns, the NA temperature variability is found to be closely related to a new atmospheric teleconnection, termed the Asian-Bering-North American (ABNA) pattern, which is an extratropical intercontinental wave train. The stationarity of the temperature-circulation relationship in the 20th century is also assessed.
2. Data and methodology
The December–February (DJF) mean atmospheric temperature and circulation data are obtained from both the National Centers for Environmental Prediction (NCEP)/National Center for Atmospheric Research reanalysis (Kistler et al 2001) from 1980 to 2015 and the 20th Century Reanalysis (referred to as 20CR, Compo et al 2011) from 1872 to 2010. Years refer to the January dates. Unlike NCEP, 20CR was generated by assimilating only surface pressures and using monthly SST and sea ice distributions as boundary conditions within an ensemble Kalman filter. We use the 56 member ensemble mean data for the 20CR reanalysis. The agreement of the climatology and interannual-interdecadal variability in temperature and geopotential fields between the two datasets has been demonstrated in previous studies, although 20CR results are generally smoother than the NCEP counterparts as would be expected owing to the 56-member ensemble mean used in the 20CR (e.g., Compo et al 2011, Yu et al 2014). The daily wind data from the NCEP reanalysis is also used to compute the synoptic scale eddy forcing.
The PNA, NAO, TNH (Tropical-Northern Hemisphere, Mo and Livezey 1986), WP (West Pacific, Wallace and Gutzler 1981), and Niño 3.4 (the SST anomaly in the region 5 °S–5 °N, 120–70 °W) indices from 1980 to 2015 are obtained from the Climate Prediction Center website (http://www.cpc.ncep.noaa.gov/data/indices). The North Pacific index (NP, Trenberth and Hurrell 1994) for the same period is retrieved from the Climate Analysis section, National Center for Atmospheric Research, website (https://climatedataguide.ucar.edu/sites/default/files/cas_data_files).
To assess the interannual circulation and temperature variability, the linear trend over the 36 (139) winters is subtracted from the original data for the timeseries from 1980 to 2015 (1872–2010). Anomalies are computed relative to the 30 yr climatology over 1981–2010. Maximum covariance analysis (MCA, Bretherton et al 1992) is employed to characterize the spatio-temporal mode of maximum covariance between circulation and temperature anomalies. MCA can isolate important coupled modes of variability between two fields. It is generally superior to empirical orthogonal function (EOF) analysis of one single field, followed by correlation of its component amplitudes with the second field. In particular, for small signal-to-noise ratios the latter may identify a coupled signal that is similar to a dominant EOF of one of the fields but is completely orthogonal to the true coupled signal within that field (Bretherton et al 1992, Wallace et al 1992). The relation between a timeseries of interest and its associated circulation anomaly is quantified by linear regression/correlation.
3. Relation between NA temperature and large-scale circulation
3.1. Temperature and circulation covariability
Figure 1 shows the two leading MCA patterns of NA 2 m temperature (T2m) and large scale 500 hPa geopotential (Φ500) anomalies for the NCEP's 36 DJFs over 1980–2015. The two leading modes explain 90.8% of the total squared covariance (table 1), and explain comparable fractions of total Φ500 variance (22.2% versus 21.3%) and T2m variance (31.6% versus 21.2%, table 1). The two leading modes also correspond closely to the two principal modes of NA T2m variability as determined by an EOF analysis.
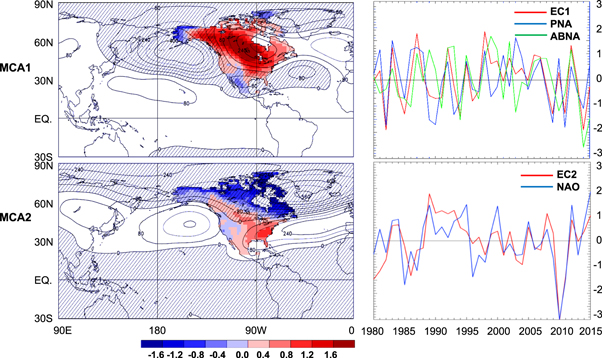
Figure 1. (left) First two modes of MCA of NA T2m (shading, in K) and tropical and Pacific-North American Φ500 anomalies (contour interval 80 m2 s−2) for the NCEP's 36 DJFs from 1980 to 2015. (right) MCA expansion coefficients (red) for the two modes, and the PNA (blue), ABNA (green), and NAO (blue) indices.
Download figure:
Standard image High-resolution imageTable 1. The squared covariance fraction (SCF, %) for the leading modes of the MCA expansion, the temporal correlation coefficient between the expansion coefficients of the T2m and Φ500 anomalies, and the explained fraction (%) to the total variance by the leading modes for individual fields.
| Mode | SCF | Corr. | Var-ECT | Var-ECΦ |
|---|---|---|---|---|
| 1 | 56.6 | 0.80 | 31.6 | 22.2 |
| 2 | 34.2 | 0.77 | 21.2 | 21.3 |
The leading MCA pattern (MCA1, figure 1, top left) is characterized by a warm anomaly over NA with exceptions over Mexico, western Alaska and Queen Elizabeth Islands. Anomalies in Φ500 correspond to an anomalous cyclone over the Gulf of Alaska-Bering Sea and an anticyclone over NA, as well as a weak anticyclonic center over central Asia. The polar and midlatitude air exchange following the anomalous circulation, with accompanying thermal advection, supports the temperature anomalies. The second MCA pattern (MCA2, figure 1, bottom left) is dominated by cold anomalies over northeast Canada and warm anomalies over the southeast US. Anomalies in Φ500 have a zonally symmetric character with some zonal asymmetries in mid-high latitudes, having prominent centers over the North Atlantic sector. The consistency of temperature and circulation anomalies is also clearly evident. The MCA result remains virtually unchanged with a reasonable variation of the domain employed, and is similar to the EOF result of NA surface temperature and its associated circulation anomalies shown in Lin and Wu (2011) using 53 DJFs from 1958 to 2010 and in Yu and Zhang (2015) using 55 DJFs from 1960 to 2014, indicating the robustness of the leading patterns.
The expansion coefficients (ECs) of T2m and Φ500 anomalies are highly correlated (table 1). Hence the mean of temperature and circulation related coefficients, termed EC1 and EC2 for the two modes (red, figure 1, right), is used as the EC indices in this analysis. Table 2 lists the correlations among EC1, EC2 and several atmospheric and oceanic indices. EC1 highly correlates with the PNA index (correlation r = 0.72, significant over the 1% level, table 2 and figure 1, top right), indicating that EC1 and PNA series have about 52% variance in common and suggesting a prominent projection of MCA1 on the PNA pattern. This is clearly evident in the Φ500 anomalies regressed upon the EC1 index (figure 2, top), which reveal the centers of action of PNA as defined in Wallace and Gutzler (1981). EC1 is also negatively correlated with the TNH and NP indices, because of the negative relationships between these two patterns and the PNA pattern (table 2). The correlation between EC1 and the Niño3.4 index is 0.40, which is attributed to the correlation between the EC of Φ500 anomalies and the Niño3.4 index (r = 0.50), while the correlation between the EC of T2m anomalies and the Niño3.4 index is low (r = 0.25), consistent with Yu and Zhang (2015). EC1 is also correlated marginally with the WP index at the 5% level.
Table 2. Correlation coefficients among the leading MCA expansion coefficients and several atmospheric and oceanic indices, as detailed in the text, over the 36 DJFs from 1980 to 2015. Numbers in bold indicates a correlation significant at the 5% level determined by a Student's t-test, assuming one degree of freedom per DJF.
| EC1 | EC2 | PNA | TNH | NAO | NP | WP | Niño3.4 | ABNA | |
|---|---|---|---|---|---|---|---|---|---|
| EC1 | 1.0 | −0.07 | 0.72 | −0.59 | 0.06 | −0.56 | 0.33 | 0.40 | 0.61 |
| EC2 | 1.0 | −0.34 | 0.42 | 0.74 | 0.46 | 0.14 | −0.19 | 0.31 | |
| PNA | 1.0 | −0.47 | −0.04 | −0.88 | 0.08 | 0.58 | 0.00 | ||
| TNH | 1.0 | 0.22 | 0.64 | 0.13 | −0.54 | −0.28 | |||
| NAO | 1.0 | 0.19 | −0.06 | −0.12 | 0.18 | ||||
| NP | 1.0 | 0.20 | −0.62 | 0.15 | |||||
| WP | 1.0 | 0.18 | 0.42 | ||||||
| Niño3.4 | 1.0 | −0.03 | |||||||
| ABNA | 1.0 |
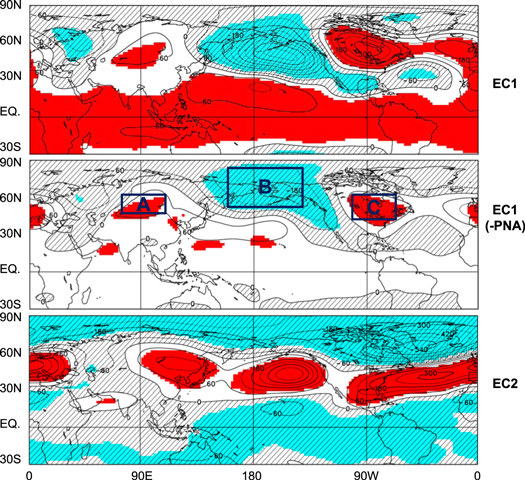
Figure 2. Anomalies of Φ500 (contours 60 m2 s−2) regressed upon the EC1 (top) and EC2 (bottom) indices. (middle) As in (top), but for Φ500 anomalies after linearly removing the PNA contribution. Negative values are cross-hatched. The positive (negative) anomalies that are significantly correlated with the corresponding index at the 5% level are red (blue) shaded. The three blue boxes indicate the areas A (45–60 °N, 80–110 °E), B (50–80 °N, 160E–150 °W), and C (40–60 °N, 100–70 °W) used for constructing the ABNA index.
Download figure:
Standard image High-resolution imageEC2 is highly correlated with the NAO index (r = 0.74, table 2). Accordingly, the EC2 associated circulation (figure 2, bottom) bears close resemblance to the NAO counterpart (figure 4 of Yu and Lin 2016). The anomalous action centers over the Arabian Sea, Lake Baikal, northeast Pacific, and a band extending from the southeastern US across the mid-latitude North Atlantic to Europe are well organized by the northern circumglobal teleconnection pattern (Branstator 2002).
3.2. A new teleconnection
Besides the PNA-like structure, the EC1 associated circulation also shows significant anomalies over Eurasia (figure 2, top). In view of the significant relationship between EC1 and those circulation anomalies, the residual Φ500 anomalies  are obtained with the PNA signal being removed from the Φ500 field by means of linear regressions. The middle panel of figure 2 illustrates
  anomalies regressed upon EC1. Intriguingly, significant tropical anomalies mostly diminish as well as some anomalies being reduced over the PNA sector, while anomalies over Asia and Bering Sea and Strait are only modestly affected. Thus the anomalies over North Asia, Bering Sea and Strait, and the NA middle-eastern portion stand out, indicating that the EC1 associated circulation is confined outside the tropics when PNA is removed. The presence of the three-cell pattern in this regression/correlation map (figure 2, middle) suggests that a teleconnection index could be constructed for the NA temperature variability. We normalized the
  anomaly at each grid point by its standard deviation (indicated by braces below) and then averaged the anomalies over three regions A (45–60 °N, 80–110 °E), B (50–80 °N, 160E–150 °W), and C (40–60 °N, 100–70 °W). The teleconnection index, termed the ABNA pattern, is constructed from the regionally averaged normalized
  anomalies:

The ABNA index depends very weakly on a reasonable variation of the three regions chosen. The correlation between ABNA and EC1 is 0.61, significant over the 1% level, suggesting the close relationship between the ABNA pattern and the winter NA temperature variability. ABNA is weakly correlated with those atmospheric and oceanic indices discussed above (table 2), except the WP pattern (r = 0.42). The ABNA and WP associated circulations share some similarities over the Kamchatka Peninsula, a dominant center of action of WP. Note that PNA and ABNA are both highly correlated with EC1, even though they are uncorrelated with each other by construction. PNA explains 52% of EC1 variance, while ABNA explains 37%. Together they explain about 89% of the EC1 variance.
3.3. Wave activity and transient eddy feedback in association with ABNA
Similar circulation anomalies are seen at 250 and 500 hPa in association with the ABNA pattern (see the middle panel of figure 2 with the top of figure 3), implying an equivalent barotropic structure in the troposphere. Diagnosis of the stationary wave activity flux (Fs), following Plumb (1985), illustrates that large wave activity fluxes originate from eastern Asia and flow downstream toward Bering Sea and Strait and then NA (figure 3, top), following the ABNA wavetrain. This confirms that the MCA1 pattern receives significant impact from Asia. Nevertheless, large wave activity fluxes are also apparent over the northeastern Pacific. This is likely related to the enhanced geopotential anomaly in the northeastern Pacific by synoptic-scale transients as discussed below. Also the PNA signal may not be completely removed by the linear regression method, which may be reflected by the northeastward wave activity fluxes there.

Figure 3. (top) Φ250 anomalies (contours 100 m2 s−2, values greater (less) than 100 [−100] m2 s−2 are red (blue) shaded) regressed upon the ABNA index and corresponding Fs (arrows in m2 s−2 with a scale shown at the lower right) poleward of 20 °N. (bottom) 250 hPa Fv anomalies (contours 2.0 × 10⁻⁴ m2 s−3) regressed upon the ABNA index. Negative values are cross-hatched. The positive (negative) anomalies that are significantly correlated with the index at the 5% level are red (blue) shaded.
Download figure:
Standard image High-resolution imageThe synoptic vorticity forcing reinforces circulation anomalies (e.g., Lau 1988, Kug and Jin 2009). The bottom panel of figure 3 shows the ABNA associated anomalies of 250 hPa synoptic-eddy vorticity forcing (Fv), following Kug and Jin (2009). Fv reveals an anomalous cyclonic forcing over Bering Sea and Strait and the northeast Pacific as well as anticyclonic forcings located over NA and North Asia. The synoptic-eddy forcing anomalies resemble the circulation anomalies (figure 3, top), though the anomalous forcing centers are displayed southward somewhat compared to the corresponding geopotential centers, indicating that synoptic eddies play an important role in reinforcing and maintaining the ABNA related circulation anomalies.
MCA1 is highly correlated with the PNA and ABNA patterns, and MCA2 with NAO. Hence, besides the ABNA associated features, the wave activity flux and eddy forcing also reveal the PNA-like anomalies as demonstrated in previous studies (e.g., Lau 1988, Karoly et al 1989, Yu and Zwiers 2007) for MCA1 and the NAO-like anomalies (e.g., Hurrell and van Loon 1997, Kug and Jin 2009, Lin et al 2009) for MCA2 (not shown), as would be expected.
4. Stationarity of the temperature-circulation relationship
The left panels of figure 4 show the timeseries of T2m (ProjT) and Φ500 (ProjΦ) anomalies over 1872–2010 for 20CR projected on the corresponding MCA spatial patterns (figure 1), superimposed on the EC series over 1980–2010. The correlation between the mean of ProjT and ProjΦ series and the corresponding EC1 (EC2) series is 0.93 (0.80) over the overlapping 31 winters from 1980 to 2010, implying a good agreement between the two datasets. The relationship between interannual variations of ProjT and ProjΦ appears steady in the 20th century, which is clearly evident in the projected timeseries (figure 4, left) and from the 31 yr running correlation between the projected T2m and Φ500 series (figure 4, right, green curve). The running correlation, ranging from 0.68 to 0.89 with a mean of 0.80, is statistically significant over the 1% level for the first mode. This indicates that the two projected timeseries have about 60% variance in common and suggests that a rather stable relationship between the leading NA temperature mode and the corresponding atmospheric circulation anomaly exists over the last century. The running correlations for the second mode range from 0.26 (around 1916) to 0.77, with a mean of 0.55, indicating a generally steady temperature-circulation relationship (about 30% variance in common between the two projected series) but with decadal variations. The correlations depend only weakly on the width of the running window (e.g., using 25 yr or 35 yr). Similar results are also obtained by projecting 20CR data on the 20CR's corresponding MCA spatial patterns calculated over 1980–2010 (not shown).

Figure 4. (left) Time series of T2m (blue) and Φ500 (red) anomalies from 1872 to 2010 for 20CR projected on the corresponding MCA spatial patterns (figure 1) and the EC series from 1980 to 2010 (green) for the first (top) and second (bottom) modes. (right) The 31 yr running correlation (green) between the projected T2m and Φ500 series, and the 31 yr running standard deviation of the projected T2m (blue) and Φ500 (red) series. The gray line indicates the 95% confidence level of correlation. Years are labeled based on the central year of the 31 yr window.
Download figure:
Standard image High-resolution image
The temperature-circulation relationship tends to be more consistent with the variance of ProjΦ series (figure 4, red) than with that of the ProjT series (figure 4, blue), especially for the second mode. For the MCA2 associated variables, the correlation between the temperature-circulation relationship series (green) and the ProjΦ variance series is 0.70 over 1887–1995, which is higher than that between the temperature-circulation relation series and the ProjT variance series (r = 0.35). This suggests that the atmospheric circulation variance may be partly responsible for the decadal variation of the temperature-circulation relationship for MCA2.
5. Summary and discussion
In this study, the NCEP reanalysis data is used to characterize and examine the dominant modes of wintertime NA temperature anomalies. The anomalies are dominated by two leading MCA modes of NA surface air temperature and 500 hPa large-scale circulation anomalies. MCA1 is characterized by warm anomalies over NA and MCA2 by cold anomalies over northeast Canada and warm anomalies over the southeast US. A new teleconnection index, termed the ABNA pattern, is constructed from the normalized geopotential field after linearly removing the PNA contribution. The ABNA pattern is sustained by the synoptic eddy feedback. MCA1 is highly correlated with both the PNA and ABNA teleconnections, and MCA2 with the NAO. The temperature-circulation relationship appears steady in the 20th century for MCA1 based on the 20CR reanalysis data. The decadal variation of the temperature-circulation relationship for MCA2 is partially attributed to the corresponding circulation variance. In addition, the decadal variation of the temperature-circulation relationship for MCA2 has little in common with the Atlantic Multidecadal Oscillation (AMO, Enfield et al 2001) and the Interdecadal Pacific Oscillation (IPO, Henley et al 2015) over 1900–2010 (not shown).
In this analysis, the linear trend is subtracted from the original data to assess the interannual circulation and temperature variability. This is intended to partially remove the long-term variation and focus on the interannual climate variability. Recently, Swain et al (2016) observed that long-term changes in geopotential heights are spatially non-uniform, with both dynamic and thermal dilation contributions. It is also noted that circulation-related dynamical changes are arguably less certain than temperature-related thermodynamical changes with long-term warming (Shepherd 2014). We have not considered dynamical and thermodynamical contributions in the long-term geopotential change. Nevertheless, the results reported here are very weakly affected by the secular trend (not shown) since we focus on the interannual climate variability.
The atmospheric circulation anomalies associated the ABNA teleconnection could be forced by influences in various extratropical regions, such as the variation of snow cover over Eurasia and the Tibetan Plateau and sea ice cover in the Arctic (e.g., Cohen et al 2007, 2014, Lin and Wu 2011, Francis and Vavrus 2012), which remains to be explored. In addition, the important role of stationary Rossby waves on subseasonal and interannual timescales in the teleconnections that span from Eurasia to NA has also been found in summer (e.g., Ding et al 2011, Schubert et al 2011, Wu et al 2012). Thus it will be interesting to explore if the ABNA teleconnection is apparent and important in the summer season.
Acknowledgments
Data used in this analysis are described in Sect. 2. We thank two anonymous reviewers for helpful suggestions and comments on this study.