

Abstract
Mangrove soils have been recognized as sources of greenhouse gases, but the atmospheric fluxes are poorly characterized, and their adverse warming effect has rarely been considered with respect to the potential contribution of mangrove wetlands to climate change mitigation. The current study balanced the warming effect of soil greenhouse gas emissions with the plant carbon dioxide (CO2) sequestration rate derived from the plants' net primary production in a productive mangrove wetland in South China to assess the role of mangrove wetlands in reducing the atmospheric warming effect. Soil characteristics were also studied in the summer to examine their relationships with gas fluxes. The soil to atmosphere fluxes of nitrous oxide (N2O), methane (CH4) and CO2 ranged from −1.6 to 50.0 μg m−2 h−1, from −1.4 to 5360.1 μg m−2 h−1 and from −31 to 512 mg m−2 h−1, respectively, which indicated that the mangrove soils act as sources of greenhouse gases in this area. The gas fluxes were higher in summer than in the cold seasons and were variable across mangrove sites. Gas fluxes in summer were positively correlated with the soil organic carbon, total nitrogen, and ammonia contents. The mangrove plants sequestered a considerable amount of atmospheric CO2 at rates varying from 3652 to 7420 g CO2 m−2 yr−1. The ecosystem acted as a source of CH4 and N2O gases but was a more intense CO2 sink. However, the warming effect of soil gas emissions accounted for 9.3–32.7% of the plant CO2 sequestration rate, partially reducing the benefit of mangrove plants, and the two trace gases comprised 9.7–33.2% of the total warming effect. We therefore propose that an assessment of the reduction of atmospheric warming effects by a mangrove ecosystem should consider both soil greenhouse gas emissions and plant CO2 sequestration.
Export citation and abstract BibTeX RIS

Original content from this work may be used under the terms of the Creative Commons Attribution 3.0 licence. Any further distribution of this work must maintain attribution to the author(s) and the title of the work, journal citation and DOI.
1. Introduction
Despite the limited area occupied by mangrove wetlands compared to terrestrial forests (Mcleod et al 2011), these highly productive ecosystems are suggested to be globally important in exporting carbon to adjacent coastal areas (Dittmar et al 2006, Alongi 2014) and in carbon (C) sequestration in the world's oceans (Chmura et al 2003, Mcleod et al 2011, Duarte et al 2013). Mangroves assimilate atmospheric carbon dioxide (CO2) into biomass and as detritus in soils; they also trap allochthonous organic carbon during flooded periods, which is then stored in the mangrove soils (Duarte et al 2013, Alongi 2014). Mangrove plants sequestrate atmospheric carbon at a global mean rate of 1110–1363 g C m−2 yr−1, and ∼70% of the carbon captured is accumulated in biomass (Bouillon et al 2008, Alongi 2009). Recent studies also estimated the global mean rate for soil carbon burial as 163–226 g C m−2 yr−1 in mangrove wetlands (Breithaupt et al 2012, Mcleod et al 2011, Alongi 2014). The reduction of the carbon loss in mangrove wetlands and the increasing the existing carbon pools for carbon sequestration are considered important for climate change mitigation (Duarte et al 2013).
Numerous studies have recognized mangrove soil as sources of atmospheric greenhouse gases, such as CO2, methane (CH4) and nitrous oxide (N2O), and proved that these gas emissions can be further enhanced by anthropogenic nutrient inputs (Muñoz-Hincapié et al 2002, Kreuzwieser et al 2003, Allen et al 2007, Chen et al 2011, Purvaja and Ramesh 2001). Therefore, the direct effect of mangrove wetlands on atmospheric warming is reflected by the exchange of greenhouse gases between the mangrove ecosystem and the atmosphere as it relates to the ecosystem's reduction or contribution to atmospheric radiative forcing (Chmura et al 2011).
According to the carbon budget presented by Bouillon et al (2008), the mean soil CO2-C flux of global mangrove represents ∼20% of the mangrove net primary production (NPP), which indicates that the soil CO2 emissions offset 20% of the plant CO2 sequestration on the global scale. Although the fluxes of CH4 and N2O are generally two or three orders of magnitude lower than the CO2 flux in mangrove wetlands (Chen et al 2010), their contributions to global warming could also be substantial and are worthy of attention because they are more stable and exhibit considerably higher radiative forcing than CO2 (Myhre et al 2013). However, the greenhouse gas emissions from the mangrove soils remain poorly characterized, and the extent to which the gas emissions could offset the benefit of plant carbon sequestration is still unclear.
In this study, soil greenhouse gas fluxes were investigated in mangrove wetlands in the Jiulong River Estuary (JRE) in South China, which have been reported to be productive (Lin et al 1985, Lu et al 1988) and to have rapid mineralization rates of soil carbon and nitrogen owing to the impact of human activities (Alongi et al 2005). The warming effect of gas emissions was then balanced with the plant CO2 sequestration rate to estimate the atmospheric cooling effect of mangrove wetlands based on the exchange of greenhouse gases between the mangrove ecosystem and the atmosphere. We also evaluated the effects of soil characteristics on greenhouse gas emissions. We hypothesize that (1) the greenhouse gas emissions from mangrove soils offset the benefits of mangrove plants in reducing atmospheric radiative forcing and (2) the warming potentials of the trace N2O and CH4 may be non-negligible and should be considered in the evaluation of the warming effect of soil gas emissions.
2. Methods
2.1. Study area
The subtropical JRE has a mean annual temperature of 20.9 °C. The tides in this area are semi-diurnal, with an average range of 4 m, and the mangrove soils are primarily composed of silt and clay (Alongi et al 2005). Most of the primary mangrove forests in this region were destroyed for aquaculture activity and sea-wall construction. The plantation of Kandelia obovata was established in the 1960s and 1980s near Caoputou Village (CPT), located on the south bank to protect the shoreline. Most mangrove forests in the estuary now appear as narrow fringing forests because of destruction.
Because some mangrove-dominated shores were subjected to erosion, Spartina alterniflora invasion or garbage accumulation, the current study chose sites that displayed good conditions to eliminate such exogenous impacts. Sampling was performed at three mangrove sites (figure 1, table 1) located at CPT, Xiaguo Village (XG) and on Haimen Island (HMI). The CPT site was a rehabilitated, and now mature, K. obovata forest that was planted in 1962 at the high intertidal zone with a high canopy height. The natural XG site was located in the mid-intertidal zone based on its intertidal elevations and the intertidal zonation scheme in the JRE as described by Chen et al (2006). The lowest vegetation density and canopy height occurred at the mid-low natural HMI mangrove site.
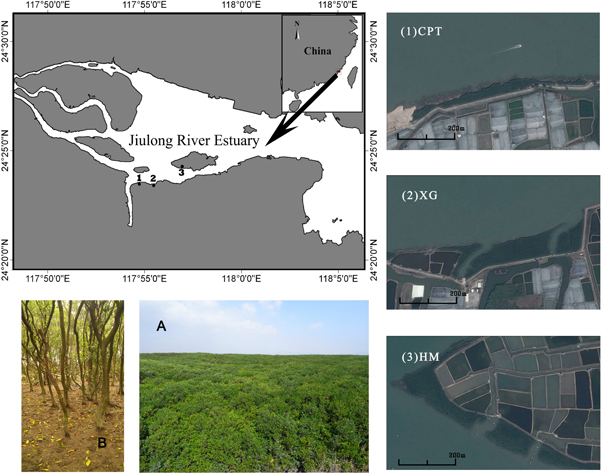
Figure 1. Map of the Jiulong River Estuary, China and a typical scene from the mangrove forest (A and B). Numbers 1–3 indicate the positions of the three sampling sites in this study: 1: Caoputou; 2: Xiaguo; 3: Haimen Island.
Download figure:
Standard image High-resolution imageTable 1. Vegetation characteristics of the three sampling sites.
| Mangrove sites | |||
|---|---|---|---|
| Parameters | Caoputou | Xiaguo | Haimen Island |
| Location | 24.3946N, 117.9119E | 24.3934''N, 117.9221''E | 24.4067''N, 117.9413E |
| Canopy height (m) | 7.8 | 6.2 | 4.2 |
| Tree density (stem m−2) | 1.0 | 1.7 | 0.7 |
| Forest width (m) | ∼40 | ∼90 | ∼90 |
2.2. Soil-to-atmosphere greenhouse gas fluxes
The soil to atmosphere fluxes of greenhouse gases were sampled in winter, spring, summer and autumn, in the three mangrove sites. All sampling was conducted two hours before the lowest ebb tide during the daytime, and the tidal range and exposure duration were comparable among the sampling days and the three sites.
The gas flux in this study was sampled using the static chamber technique (Chen et al 2010). Nine transparent static chambers were placed at each site and inserted 3 cm into the soil between trees in locations without mangrove seedlings, aboveground roots or litter fall. The chambers had a basal area of 0.025 m2 and a headspace volume over the soil of 1.25 l, with a volume/basal area ratio that is sufficiently small for rapid increases in gas concentrations (Corredor et al 1999, Bauza et al 2002). The deployment time was set to 30 min, with sampling at 10 min intervals. Gas concentrations were analysed in parallel with a gas chromatography system (7890A, Agilent Technologies, Santa Clara, CA, USA) by comparing their peak areas against an Agilent Greenhouse Gas Checkout Sample, with 600 parts per million (ppm) CO2, 5 ppm CH4 and 1 ppm N2O in nitrogen. The N2O and CH4 concentrations were determined with a 63Ni electron capture detector and a flame ionization detector (FID), respectively. The CO2 concentration was analysed using FID after methanization. During the measurement, the standard was analysed every 15–20 samples. The standard deviations of replicate standard measurements were less than 4% for the three gases.
2.3. Sampling and analysis of soil
Soil parameters were also measured at these sites during the summer to examine their relationship with gas fluxes because the fluxes have been found to be higher during the summer in subtropical mangroves (Chen et al 2012). The soil redox potential (Eh) under the chamber was measured using a pH/Eh meter (WP-81, TPS, Australia) after gas sampling at a depth of 5 cm from the surface. Soils, to a depth of 5 cm, were collected using a steel tube (inner diameter 1.75 cm) with a sharpened open end to estimate the bulk density. Independent soil cores (6 cores for each mangrove site) were collected to a depth of 15 cm using hand-held PVC corers. Soil organic carbon (OC) concentration was analysed using the rapid dichromate oxidation procedure. Total Kjeldahl nitrogen (TKN), after Kjeldahl digestion, ammonia ( -N) and nitrate (
 -N), in a potassium chloride (2 M) extract, were measured using a Continuous Flow Analyzer (Futura II, Alliance Instruments, France). All soil analyses were based on the soil analysis methods described by Page et al (1982), and the data were expressed in terms of the 105 °C oven-dried weight.
Soil porewater salinity was measured using a pocket refractometer (Atago PAL-06 S, Japan) at the seaward fringe of each site with triplicates because porewater samples were not available for all sample plots. Such measurements do not reveal the salinities within the wetlands but reflect the salinity gradient among the three sites.
2.4. Plant CO2 sequestration rate
The plant CO2 sequestration rate was calculated from the NPP using the following formula:

where  is the plant CO2 sequestration rate (g CO2 m−2 yr−1), NPP is the net primary production (g m−2 yr−1), Cmangrove is the carbon content of mangrove plants (%), and 44/12 is the formula weight ratio of CO2 to C.
The mangrove NPP was estimated using the litter fall technique (Teas 1979), which postulates that 1/3 of mangrove NPP is returned as litter fall. This rapid and direct method was also applied in other studies (Lee 1990, Alongi 2009), but its accuracy depends on the availability of a good conversion factor of litter production to NPP (Odum et al 1982). In this study, we applied a conversion factor 2.75 derived from previously reported NPP data and the concurrent litter fall production of K. obovata in the JRE (Lin et al 1985). The mean plant carbon content was 47% for K. obovata in the JRE (Zheng et al 1995).
Litter-fall samples were collected using metal-framed litter traps (Φ = 70 cm, 30 cm in depth). Nine traps were placed randomly under canopies at similar heights above the maximum tide level at each site. The trap contents were collected monthly and sorted as leaf, wood and reproduction (flowers and propagules) components and dried at 60 °C to a constant weight. The litter fall production was expressed as the total dry weight of these components.
2.5. Atmospheric cooling effect of a mangrove ecosystem
The gas fluxes were converted to CO2-equivalent fluxes to indicate their respective warming effect using the global warming potential (GWP) of each gas. The GWPs were 1, 34 and 298 for CO2, CH4 and N2O, respectively, over a 100-year timeframe according to Myhre et al (2013). The annualized warming effect of gas emissions at each site was compared to the CO2 sequestration rate of plants to estimate the ecosystem effect. Net ecosystem production (NEP) of the three mangrove sites was also estimated by subtracting the soil respiration rate from NPP, and the soil respiration rate was calculated as the sum of the CO2-C and CH4-C fluxes.
2.6. Statistical analysis
The normality of variables was assessed using the Kolmogorov-Smirnov test, and gas fluxes that did not follow a normal distribution were transformed to improve normality and homoscedasticity prior to analysis. A two-way ANOVA was used to test the differences in greenhouse gas fluxes among the four seasons and the three sites. If the difference was significant (p < 0.05), a post-hoc Tukey test was used to determine the difference. Differences in the litter fall production and soil characteristics were compared using one-way ANOVA. Pearson correlation coefficients were calculated to determine the relationships between soil properties and gas fluxes in the summer. All statistical analyses were performed using PASW Statistics for Windows, Version 18.0 (SPSS Inc., Chicago, IL, USA).
3. Results and discussion
The present study further demonstrates that mangrove soils can be sources of greenhouse gases (figure 2). The soil gas fluxes at these three sites were −1.6 to 50.0 μg m−2 h−1, −1.4 to 5360.1 μg m−2 h−1 and −31 to 512 mg m−2 h−1, for N2O, CH4 and CO2, respectively, which fell within the ranges from −19.8 to 1179.2 μg N2O m−2 h−1, from −96.8 to 82697.6 μg CH4 m−2 h−1 and from less than −190 to 442 mg CO2 m−2 h−1 that were previously reported for other mangrove forests (Bouillon et al 2008, Chauhan et al 2008, Chen et al 2010 2014, Murray et al 2015). Similar to previous studies (Allen et al 2011, Chen et al 2010, 2012), gas fluxes in this study varied spatially and seasonally (figure 2). The XG site had a higher soil N2O flux than the other two sites (F = 10.63, p = 0.000), both of which had similar fluxes. The highest N2O flux was measured during the summer, and the lowest was measured during the winter and autumn (F = 17.21, p < 0.001). CH4 flux also showed significant spatial (F = 15.36, p < 0.001) and seasonal (F = 26.03, p < 0.001) variations, and significant interactions were also found between these factors (F = 3.83, p < 0.001), which indicated that their variation was site- or season-specific (figure 2). For CO2, the flux significantly varied among the mangrove sites (F = 10.24, p < 0.001) and the four seasons (F = 73.25, p < 0.001), and their interaction was significant (F = 4.42, p < 0.01). Sinks of CO2 were measured in the winter at the three sites, but the soils in the warmer seasons acted as significant CO2 sources.
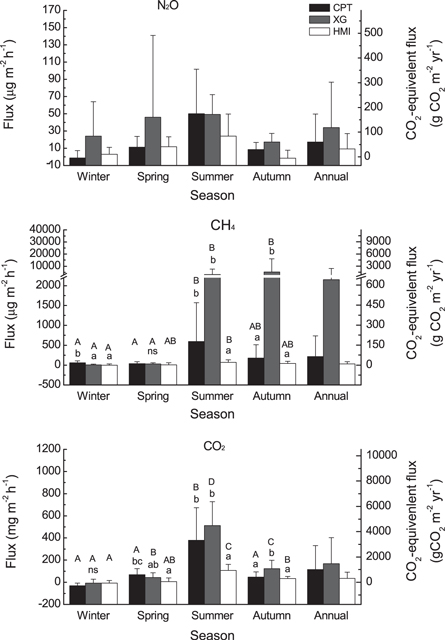
Figure 2. Soil to atmosphere greenhouse gas flux (mean ± SE, n = 9 for the seasonal fluxes and 36 for the annual mean fluxes) at the mangrove sites in the Jiulong River Estuary. Figure 2 uses the same abbreviations as figure 1. In each season, different letters (lower case letters) indicate significant differences among the three mangrove sites according to the ANOVA test. For each mangrove site, different letters (capital letters) indicate significant differences among the four seasons.
Download figure:
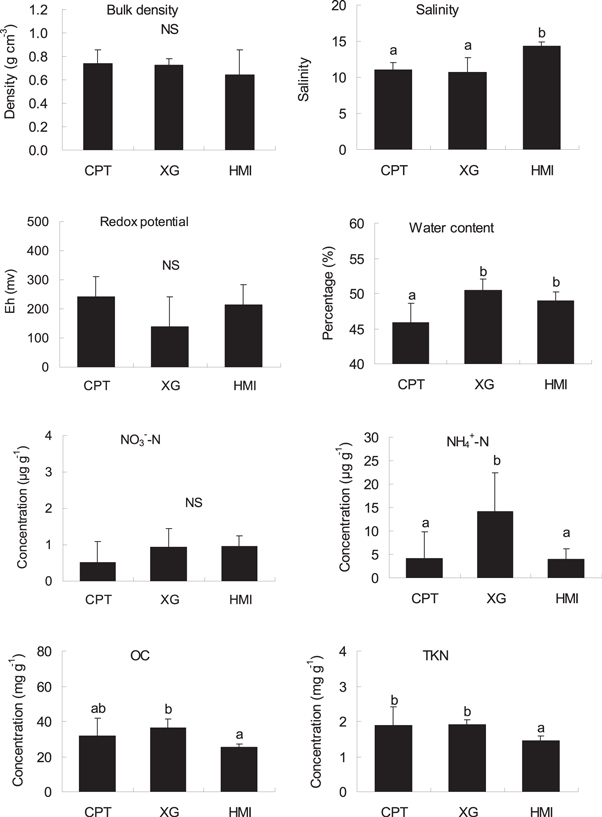
Standard image High-resolution imageThe spatial variations in greenhouse gas fluxes from mangrove soils could be partially attributed to the spatial differences of the soil characteristics because the fluxes are related to soil properties, including OC and nitrogen concentrations, bulk density, salinity and redox potential (Allen et al 2007, Chen et al 2010, 2012, Purvaja and Ramesh 2011). In our summer investigation, the higher fluxes of the three gases were attributed to higher soil OC, TKN and  -N concentrations in the mangrove soils (figure 3 and table 2). Positive soil Eh in the mangrove soil and a significant correlation between N2O flux and soil
  -N concentration indicated the importance of soil nitrification that is responsible for the variability of N2O flux. Like other studies (Allen et al 2007, Chen et al 2010), high soil
  -N concentrations enhanced CH4 emissions in this study, probably because of the inhibitory effect of soil
  -N on CH4 oxidation under high
  -N concentrations (Bosse et al 1993). The lower soil CH4 flux and higher porewater salinity at HMI (figure 3) were consistent with the inhibitory effect of salinity on CH4 emission from coastal soils because the presence of high sulfate allowed sulfate-reducing bacteria to outcompete methanogens for energy resources (Biswas et al 2007, Poffenbarger et al 2011, IPCC 2014).
Figure 3. Soil characteristics (mean ± SE, n = 6) at the mangrove sites in the Jiulong River Estuary. Figure 3 uses the same abbreviations as figures 1 and 2. Different letters indicate significant differences among the three mangrove sites according to the ANOVA test.
Download figure:
Standard image High-resolution image
Tablee 2. Pearson correlation coefficient values (r) between soil properties and summer fluxes of greenhouse gases in the Jiulong River Estuary.
| Fluxes of gases | ||||
|---|---|---|---|---|
| Soil parameter | N2O | CH4 | CO2 | Total CO2-equivalent flux |
| Redox potential | −0.323 | −0.126 | −0.130 | −0.157 |
| Bulk density | 0.406 | 0.311 | 0.152 | 0.160 |
| Water content | 0.424 | 0.329 | 0.175 | 0.359 |
 -N -N |
0.575* | 0.730** | 0.618* | 0.720** |
 -N -N |
−0.199 | 0.008 | −0.205 | −0.175 |
| OC | 0.756*** | 0.838*** | 0.713** | 0.831*** |
| TKN | 0.812*** | 0.541* | 0.724** | 0.789*** |
 -N: ammonia,
  -N: nitrate, OC: organic carbon, TKN: total Kjeldahl nitrogen. *, ** and *** indicate significant r-value at p < 0.05, 0.01 and 0.001, respectively (n = 18). No correlation was calculated between porewater salinity and gas flux because the porewater samples were collected outside of the sampling areas.
The subtropical K. obovata mangrove forest in the Jiulong River Estuary had litter fall production ranging from 771 g m−2 yr−1 to 1565 g m−2 yr−1 (table 3), and the leaf fall and reproduction components accounted for 44% and 41% of the total production, respectively. Owing to its lower leaf and twig production, the litter fall production and NPP at HMI were lower than those of the other two sites. NPP estimated from litter fall production was 2119–4306 g m−2 in the three sites, close to the quantities reported in tropical regions and higher than the global mean production (Bouillon et al 2008). This is consistent with the summary presented by the IPCC (2014), which showed that certain subtropical mangroves have higher growth rates than those of the tropical regions. The high NPP and low carbon gas emissions from soil in the current study indicated that the mangrove wetlands have strong sequestration capacity for atmospheric CO2 at the ecosystem scale. The three mangrove sites in the JRE had NEP varying from 912 to 1746 g C m−2 yr−1, which is comparable to the NEP of the western Florida Everglades mangrove forest (1170 gC m−2 yr−1, Barr et al 2010) and higher than the Rhizophora mangle forest (561 g C m−2 yr−1) in Puerto Rico (Golley et al 1962). The mean NEP of the three sites in the JRE, 1358 g C m−2 yr−1, was higher than the global mean value of 1100 g C m−2 yr−1 (Bouillon et al 2008).
Table 3. Litter fall production and net primary production (g m−2 yr−1) at the three mangrove sites in the Jiulong River Estuary.
| Mangrove sites | Leaf | Twig | Reproduction | Total | NPP |
|---|---|---|---|---|---|
| CPT | 683 ± 101a | 241 ± 105 a | 641 ± 234a | 1565 ± 246a | 4306 ± 676a |
| XG | 692 ± 86a | 267 ± 164a | 458 ± 177a | 1417 ± 189a | 3899 ± 519a |
| HMI | 275 ± 121b | 52 ± 72b | 444 ± 160a | 771 ± 143b | 2119 ± 393b |
| Mean | 550 ± 222 | 187 ± 151 | 514 ± 207 | 1251 ± 355 | 3441 ± 1098 |
CPT: Caoputou; XG: Xiaguo; HMI: Haimen Island; JRE: Jiulong River Estuary; NPP: Net primary production. Different superscript letters present in a column indicate a significant difference among the three mangrove sites. Data are given as the mean ± SE of each site or the three sites (n = 9 for each site and n = 36 for JRE, as in table 3).
When both plant CO2 sequestration and soil gas emissions were considered, mangrove wetlands were small sources of CH4 and N2O and significant CO2 sinks in this study (figure 2, table 4). Although CH4 emissions were significant in the estuarine mangrove wetlands, they accounted for a small proportion (0.2–3.4%) of the soil gaseous carbon emissions (figure 2, table 4). If considering their warming effect, soil gas emissions had total CO2-equivalent fluxes ranging from 340 to 2200 g CO2 m−2 yr−1 for the three sites, accounting for 9.3%–32.7% of the plant CO2 sequestration rate in this study (table 4). The higher total CO2-equivalent flux at the XG site was attributed to the higher fluxes of CO2 and CH4 in this site than the other two sites. The spatial variation of the total CO2-equivalent flux was related to the soil  -N, OC and TKN concentrations (table 2). The mean reduction effect of the JRE mangrove sites on atmospheric warming was estimated as 4708 g CO2 m−2 yr−1, suggesting that mangrove wetlands in this region are important sinks of atmospheric CO2 in terms of radiative forcing.
Table 4. Net ecosystem production and the mitigating effects of wetlands on global warming in the Jiulong River Estuary.
| Mangrove sites | Soil C-gas flux (g C m−2 yr−1) | Net primary production (g C m−2 yr−1) | Net ecosystem production (g C m−2 yr−1) | Plant CO2 sequestration rate (g CO2 m−2 yr−1) | CO2 equivalent fluxa (g CO2 m−2 yr−1) | Ecosystem cooling effectb (g CO2 m−2 yr−1) |
|---|---|---|---|---|---|---|
| CPT | 278 ± 515 | 2024 ± 317 | 1746 | 7420 ± 1165 | 1125 ± 2050 (9.8%) | 6295 (15.2%) |
| XG | 415 ± 572 | 1832 ± 244 | 1417 | 6719 ± 894 | 2200 ± 3032 (33.2%) | 4519 (32.7%) |
| HMI | 84 ± 133 | 996 ± 185 | 912 | 3652 ± 677 | 340 ± 513 (9.7%) | 3312 (9.3%) |
| Mean | 259 ± 468 | 1617 ± 516 | 1358 | 5930 ± 1893 | 1222 ± 2249(23.8%) | 4708 (20.6%) |
CPT: Caoputou; XG: Xiaguo; HMI: Haimen Island; JRE: Jiulong River Estuary. Data are given as the mean ± SD for each site or for the JRE (for gas flux, n = 36 for each site and n = 108 for JRE).Net primary production was derived from litter fall production (table 2) and the carbon content in mangrove plants (47%, Zheng et al 1995) in the JRE. Net ecosystem production was estimated using the difference between NPP and the soil respiration rate, i.e., soil C-gas flux (the sum of CO2-C and CH4-C fluxes). The ecosystem cooling effect was estimated by comparing the annualized warming effect of gas emissions against the CO2 sequestration rate of plants. aValues in the brackets represent the proportion of N2O and CH4 gases to the total CO2-equivalent flux. bValues in the brackets represent the proportion of the warming effect associated with gas emissions relative to the plant CO2 sequestration rate.
Previous studies have reported the diurnal fluctuations of gas fluxes from mangrove soils (Chang and Yang 2003, Allen et al 2007). In this study, the annual fluxes were estimated by extrapolating the seasonal fluxes of 9 sampling points at each site without consideration of the diurnal variations in the gas fluxes. Some other studies also used this extrapolation method for gas emission rates in mangrove wetlands (Chauhan et al 2008, Krithika et al 2008, Lovelock 2008, Bulmer et al 2015). Although such extrapolations lead to an error in annual gas emission rates, we consider that this error did not alter the overall conclusion the warming effect of soil gas emissions would substantially reduce the plant CO2 sequestration in this study. This is because the diurnal fluctuation patterns of the gas fluxes are variable across different months and sampling stands (Chang and Yang 2003, Allen et al 2007), and these variabilities are likely to reduce the errors in our annual emission rates. However, the errors for such estimations and the diurnal variation patterns of gas fluxes warrant further study. In the present study, the CO2 fluxes measured in the chambers placed over a clear mangrove floor (without pneumatophore, seedlings or litter fall) were more likely to represent microbial metabolisms (Komiyama et al 2008, Chen et al 2012). If the CO2 emissions from other sources were considered, i.e. decomposition of litter fall and dead wood as important carbon pools in the mangroves (IPCC 2014), the warming effect of the gas emissions from the mangrove floor would be more substantial.
We measured lower primary production at HMI (table 3) accompanied by lower gas emission rates than the other two mangrove sites in this study. Similarly, the soil respiration rate was found to be correlated with litter fall production over a large range of latitudes extending from 27°N to 37°S (Lovelock 2008). This pattern suggests that the greater amount of CO2 sequestrated by mangroves, the more substantial the warming effect of soil greenhouse gas emissions might be. Globally, the mangrove NPP decreases with increasing latitude, and the highest litter fall rates occur in the tropical areas (Bouillon et al 2008, Alongi 2009). Other studies reported low greenhouse gas emissions from soils in tropical mangrove wetlands (Chen et al 2014, Nóbrega et al 2016). These results suggest that tropical mangrove wetlands, which represent most global mangroves (Giri et al 2011), could be more relevant to reducing atmospheric radiative forcing and their role deserves detailed studies.
Despite their low fluxes compared with CO2, the contributions of CH4 and N2O gases is non-negligible (9.7%–33.2%) to the total warming effect of soil gas emissions in the mangrove wetlands (figure 2). The emissions of these two gases could be largely enhanced from mangrove soils subjected to anthropogenic nutrient inputs (Muñoz-Hincapié et al 2002, Chen et al 2011). Higher emission rates of N2O and CH4 than those in this study have been reported from mangrove soils in the Futian mangrove in South China, which receives anthropogenic nutrient inputs, and these two gases contribute twice the global warming potential of CO2 (Chen et al 2010). Because the soil fluxes of CH4 and N2O are still poorly quantified from mangrove soils (Chen et al 2010, Murray et al 2015), they should receive additional attention and be documented, in addition to CO2 fluxes, to quantify the global warming potential of soil gas emissions from mangrove wetlands, especially for mangroves receiving exogenous nutrients.
Other studies in salt Marshes also quantified the potential global warming feedback based on the soil carbon burial rate and non-CO2 gas emission rates (e.g., Chmura et al 2011, Yuan et al 2015). In salt marshes, the carbon accumulation in the biomass through plant growth is roughly balanced by losses through grazing, decomposition and fire (IPCC 2006, 2014). Unlike the salt marshes, the majority of carbon captured by mangrove plants is stored in biomass. Here, we further estimated the potential global warming feedback of the JRE mangrove wetland using the CO2-equivalent flux of non-CO2 gases in this study (290 g CO2 m−2 yr−1) and the soil burial rate (404.4 g C m−2 yr−1) reported by Alongi et al (2005) for the JRE mangrove wetland, with a mangrove biomass accumulation rate (1.75 times litter fall production in this study) taken into account as well. The potential global warming feedback of the JRE mangrove wetland, ∼4850 g CO2 m−2 yr−1, was higher than those in northern and north-western Atlantic salt Marshes estimated in the growing season (574–1000 g CO2 m−2 yr−1, Chmura et al 2011) and in the marshes of eastern China (114–1130 g CO2 m−2 yr−1, Yuan et al 2015), indicating that the mangrove wetland plays a substantial role in global warming feedback.
4. Conclusions
The current study showed that mangrove soils are sources of greenhouse gases, and their warming effect partially offset the benefit of plant CO2 sequestration in reducing the atmospheric warming effect. Therefore, we propose that any assessment of the reduction effect that mangrove wetlands have on atmospheric warming should consider soil greenhouse gas emissions. The contributions of soil CH4 and N2O emissions to the warming effect should not be ignored, and CO2 emissions from other aboveground sources should also be considered. The current study assessed the role of the mangrove wetlands in reducing the atmospheric warming effect based on the greenhouse gas exchanges between the mangrove ecosystem and the atmosphere. Further assessment of the potential of the mangrove wetland in global warming feedback is necessary, with both soil greenhouse gas emissions and the ecosystem's carbon sequestration considered.
Acknowledgments
The work described in this paper was supported by the Fujian Province Science and Technology Plan Project (2014Y0067) and the National Natural Science Foundation of China (41206108, 41606105). The Science Research Foundation of the Third Institute of Oceanography, SOA (2014011) also provided support. The authors have no conflicts of interest to report. The authors are grateful to Ms Y P Chen, Dr X Q Zheng and Mrs Q Y Lin for their assistance with field sampling and laboratory analysis and to Mr Z Y Xue for assistance with mangrove site selection. The authors also thank Dr Changhua Weng for the English editing assistance.