

Abstract
Assessing the impacts of land use and land cover change (LUCC) on regional climate is essential for understanding land–atmosphere interactions and for designing climate adaptation and mitigation strategies. Using the weather research and forecasting (WRF) model, we examined how different land use and land cover patterns affect regional climate in the agro-pastoral transitional zone of North China, whose environmental and socioeconomic conditions are sensitive to climate change. We parameterized WRF using land use and land cover maps corresponding to 2001 and 2010 conditions, which differ in the representation of four land surface biophysical parameters: vegetation fraction, leaf area index (LAI), albedo, and emissivity. From 2001 to 2010, vegetation fraction and LAI increased in summer, emissivity increased and albedo decreased in winter. Our WRF simulations show that differences in land use and land cover patterns led to widespread reduction in summer temperature with local cooling on the order of 1 °C, and extensive increase in winter temperature with local warming exceeding 0.8 °C. By contrast, simulations using the default landscape representation, provided by WRF itself, show only minor and random changes in temperature. Model evaluation further reveals that our simulations with appropriate land surface properties improve the performance of the WRF model. Our findings demonstrate that LUCC in Northern China has altered the regional climate over the past decade. The magnitude and spatial patterns of temperature changes quantified by our simulations provide useful information for understanding the impacts of LUCC on climate and for developing mitigation and adaptation strategies in arid and semiarid regions.
Export citation and abstract BibTeX RIS
Changes were made to this article on 24 October 2016. The corresponding author has been indicated.
Introduction
Land use and land cover change (LUCC) is a main driving force of regional and global climate change (Vitousek 1997, Feddema et al 2005, Foley et al 2005). LUCC can affect climate through two general pathways: biogeochemical and biogeophysical. The biogeochemical effects of LUCC on global climate due to emissions of greenhouse gases are well established (e.g., Brovkin et al 2004). However, biogeophysical processes can result in regional climate change of similar, or greater, magnitude as effects due to increases in emissions (Sellers et al 1997, Georgescu et al 2011, de Noblet-Ducoudré et al 2012). For example, landscape change that alters albedo determines the amount of surface-absorbed solar energy. In conjunction with vegetation properties, which regulate the partitioning of available energy into sensible, latent, and ground heat fluxes, the transport of heat and moisture between the land surface and atmosphere is modified, with additional consequences for temperature, air circulation, and precipitation change (Pielke and Niyogi 2010).
Previous studies have shown that regional climate can be highly sensitive to even small changes in land surface properties (e.g., Charney et al 1977, Chase et al 1996, Zhou et al 2003, Georgescu et al 2009, Ge et al 2014, Kumar et al 2014, Zhou et al 2015). Thereby, accurate representation of land surface conditions is essential to assess the impacts of LUCC on climate. Unlike sensitivity tests targeted on individual parameters, Georgescu et al (2011) quantified climatic response to changing vegetation properties by shifting albedo, leaf area index (LAI), and vegetation fraction of annual crops to perennial crops, and found significant cooling effects due to increased transpiration and higher albedo. Although an important step to characterize large-scale shifts in realistic vegetation properties, the importance of landscape heterogeneity resulting from the interannual changes of vegetation characteristics was largely omitted.
Landscape heterogeneity has been recognized to induce mesoscale circulations and further modify the land–atmosphere feedbacks (e.g., Weaver and Avissar 2001). Subgrid-scale heterogeneity, however, is rarely incorporated explicitly in climate models (Pielke and Avissar 1990, Pielke and Niyogi 2010). Such models often assume homogenous subgrid landscapes and fail to characterize key land surface forcing variables on local and regional scales (Avissar and Pielke 1989). Recent work, however, is becoming increasingly cognizant of this limitation (Li et al 2013). Indeed, spatiotemporal patterns of landscapes should be taken into account in order to accurately assess climatic effects of LUCC and develop adaptation and mitigation strategies that can minimize the deleterious impacts (Opdam et al 2009, Wu 2013, Georgescu et al 2014).
The representation of subgrid-scale land surface heterogeneity within and among landscapes can be achieved by the incorporation of high-resolution and real-time remote sensing data into climate models. So far, however, the use of high-resolution landscape data to drive climate models has been limited by inadequate data availability and excessive computational demands, although this situation has been changing in recent years (e.g., Grossman-Clarke et al 2010).
Transitional zones among biomes or ecosystems (i.e., ecotones) are especially sensitive to changing climatic conditions, and are thus ideal locations to study the effects of landscape modification on regional climate. The agro-pastoral transitional zone (APTZ) of North China (figure 1) is one of the world's largest ecotones of its kind. Although APTZ has a mean annual temperature of 6 °C, it spans more than 10° of latitude and the mean annual temperature varies from 0 °C to 9 °C. Human-induced landscape modification within APTZ has been dramatic in recent decades, largely due to China's economic reform (Wu et al 2015). Using the weather research and forecasting (WRF) model (Skamarock et al 2008), this study is designed to examine climatic impacts associated with LUCC of this transitional zone, with a particular focus on changes during the initial decade of the current century. Specific research objectives are: (1) to quantify the magnitude of LUCC during the past decade based on the analyses of remote sensing data; (2) to assess the accuracy of WRF-default biophysical parameters in simulating regional climate in Northern China; (3) to examine the impacts of LUCC on the region's climate, with a particular focus on the surface energy budget and 2 m air temperature.
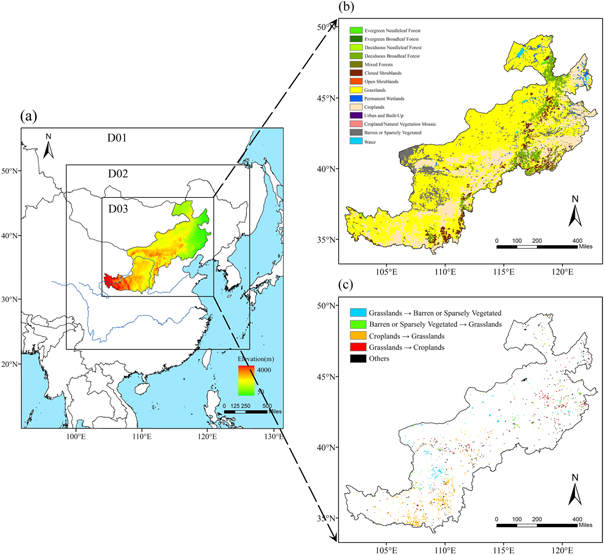
Figure 1. Illustration of the three nested model domains used in the WRF simulations with topography of the agro-pastoral transitional zone (APTZ) of North China overlaid (a), land use and land cover map for 2000 (b), and land use and land cover change from 2000 to 2010 (c) in the APTZ.
Download figure:
Standard image High-resolution imageMaterials and methods
Model configuration and parameterization
The WRF model was configured for fine-scale simulations with three nested domains (figure 1(a)). The coarse outer domain (D01) covers almost all of China and extends to the East and South China Sea to capture the influence of the East Asian Monsoon on the climate of APTZ, and covers a total area of 5310 km × 5490 km with 45 km grid spacing in both horizontal directions. The intermediate domain (D02) covers an area of 3180 km × 3960 km, using 15 km grid spacing. The innermost domain (D03) is centered at 42.3°N and 112.8°E, and covers an area of 2000 km × 1950 km, using 5 km grid spacing. The main physical parameterizations used for all simulations are presented in table A.1. A 10 yr (1 January, 2001–31 December, 2010) averaged global final analysis data obtained from the National Centers for Environmental Prediction were used as initial and lateral boundary conditions. The model was executed using one-way nesting and all simulations were initialized on 1 January at 0000 UTC and run through 31 December at 1800 UTC for a period of 1 yr, with the first 15 d considered spin-up and therefore excluded from the analysis.
Although the coupled WRF-Noah Land Surface Model (LSM) is widely used to simulate regional climate, deficiencies exist with prescribed land surface biophysical parameters. In Noah LSM, the temporal variability of vegetation parameters is determined by changes in vegetation fraction and corresponding annual maximum/minimum values prescribed in look-up tables. LAI and emissivity vary in proportion to vegetation fraction, whereas albedo varies conversely with it. However, there is no evidence showing such linear relationships, and in most cases, albedo is expected to increase as vegetation matures to peak greenness (e.g., Song 1999). In addition, the maximum/minimum LAI, albedo, and emissivity defined in the tables are not suitable for our study area. Thereby, large errors may occur when using the default land surface properties as prescribed by Noah LSM, for longer time-scale simulations (see figures A.1 and A.2).
WRF also allows users to define vegetation fraction, albedo, and LAI from geographical data sets produced based on remote sensing data at a global scale. However, the default data sets utilized also have limitations: (1) the spatial resolution (e.g., 0.144° × 0.144°) is too coarse to describe landscape heterogeneity for high-resolution simulations; (2) interannual changes of vegetation characteristics are omitted. For example, the default vegetation fraction was obtained during the period of 1986–1991, and has not been updated since, despite potentially large changes in the amount of actual vegetation fraction (see figures A.1 and A.2). Therefore, in this study, we used finer spatial resolution with more detailed biogeographic information to improve characterization of landscape properties (see below).
Remote sensing data acquisition
We obtained land use/cover data from the Data Sharing Infrastructure of Earth System Science (http://www.geodata.cn/). The data are produced by the Chinese Academy of Sciences (CAS) for 2000 (hereafter CAS2000) and 2010 (hereafter CAS2010), with a spatial resolution of 1 km × 1 km. The data have been converted to the International Geosphere–Biosphere Program land use classification scheme and the overall accuracy of the classified data is 83.14% (Wu et al 2013). The land use/cover map corresponding to 2000 used in the representation of our innermost domain is shown in figure 1(b).
We computed vegetation fraction based on 16 d, 1 km MODIS vegetation indices data sets (MOD13A2; https://lpdaac.usgs.gov/) following the method proposed by Gutman and Ignatov (1998):

where  denotes the vegetation fraction,
  the NDVI at each pixel,
  the bare soil NDVI, and
  the dense vegetation NDVI. Here, we defined
  and
and  as the lower and upper 5% NDVI of the study area (Sellers et al 1996), respectively. LAI, albedo, and emissivity were obtained from the global land surface satellite (GLASS; http://glass-product.bnu.edu.cn/), with a temporal resolution of 8 d and spatial resolution of 1 km × 1 km. It should be noted that the GLASS albedo products provide both white-sky and black-sky albedo, which are numerically related to each other as follows:

where  is sky light ratio factor determined by proportions of direct beam and diffuse illumination,
  the blue-sky albedo,
  the black-sky albedo, and
  the white-sky albedo (Liang et al 2005). In our study, the weight coefficient,
  was calculated as a function of solar angle as per Long and Gaustad (2004).
The semi-monthly and 8 d data were then linearly interpolated to a daily interval and aggregated to the innermost domain resolution of 5 km × 5 km. The four land surface biophysical parameters along with the CAS land use/cover data were incorporated within the innermost domain. For the two outer domains in all simulations, we used vegetation fraction, LAI, albedo, and land use/cover data from the geographical data set provided by the WRF model, whereas emissivity was prescribed by Noah LSM.
Numerical simulation design
We designed two simulation experiments to explore the effects of human-induced LUCC on regional climate. Experiment2001, corresponding to the 2001 landscape pattern, used CAS2000 (in lieu of 2001 land use/cover data, which were not available) and 2001 land surface biophysical parameters (vegetation fraction, LAI, albedo, and emissivity). Experiment2010, corresponding to the 2010 landscape pattern, used CAS2010 and 2010 land surface biophysical parameters (vegetation fraction, LAI, albedo, and emissivity). In addition, two control experiments were carried out to examine whether the use of non-default land surface biophysical parameters that we derived improved model performance. Control2001 used CAS2000 while Control2010 used CAS2010, and both utilized the default land surface biophysical parameters prescribed by WRF-Noah LSM based on tabular values.
Model evaluation data
The observation data used for evaluating model performance were obtained from 'SURF_CLI_CHN_MUL_MON', a data set provided by China meteorological data sharing service system (http://data.cma.gov.cn/). The data set contain monthly climatological information (pressure, temperature, wind, precipitation, etc) for the meteorological stations across China. For model evaluation, we used observations from 85 stations, which were located in APTZ. To examine the spatial skill of the WRF model and directly compare model simulation results performed at 5 km grid spacing, mean air temperature during summer (i.e., June, July, and August) and winter (i.e., December, January, and February) from 2001 to 2010 were calculated for each station. The 10 yr mean observations were then spatially interpolated to a 5 km × 5 km resolution using the Kriging method (Kalnay 2003).
In addition, the observation minus reanalysis (OMR; Kalnay and Cai 2003) was used to evaluate the temperature changes due to LUCC as simulated by the WRF model. The data used for OMR analyses include the gridded reanalysis data described by Kanamitsu et al (2002) and station-based observations obtained from the data set described above. Prior to use of the OMR analyses, the station-based observations were homogenized using the method proposed by Li and Yan (2009). Temperature trends during summer and winter seasons based on time series of 13 years from 1999 to 2011 were calculated for each station within APTZ by using observations and reanalysis, respectively. The differences in trends of temperatures between those derived from observations and those derived from reanalysis can then evaluate temperature changes induced by LUCC.
Statistical test
Statistical tests were carried out for summer and winter temperature differences simulated by the two experiments (Experiment2010—Experiment2001). As the Experiment2001 and Experiment2010 simulations were carried out for a period of 1 yr respectively, all the grid cells representing temperature differences in summer (and winter) for the Experiment2001 and Experiment2010 comparison were considered as one sample set. Only grid cell values within two standard deviations of the mean of the sample set were considered as confident differences and thus retained for the subsequent analyses (Kalnay 2003). We further enhanced the criteria defined here by additionally requiring temperature change exceeding 0.2 °C for the Experiment2001 and Experiment2010 comparison.
Results
Model evaluation
Model evaluation was carried out during winter and summer seasons, and the results indicate improved model performance with our newly developed landscape representation relative to the WRF default representation (figure 2). During winter, the Control2001 simulation produces a warmer regime in Northern APTZ and a cooler regime in central areas compared to the observations, and the spatial correlation coefficient of air temperature between the observations and Control2001 simulation is 0.824. Although deficiencies still exist, the Experiment2001 simulation largely corrects the deviations of the Control2001 simulation, with a spatial correlation coefficient rising to 0.941. During summer, the Control2001 simulation produces warmer air temperature in central North and Southern APTZ, and a cooler regime in the Northeast, with a spatial correlation coefficient equal to 0.627. In contrast, the Experiment2001 simulation better captures the general pattern of the observed temperature, with a spatial correlation coefficient increasing to 0.732.
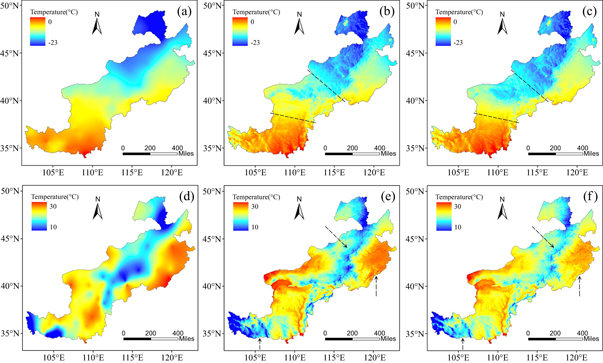
Figure 2. Observed and simulated mean winter and summer temperature (°C): (a) observed mean winter temperature, (b) simulated mean winter temperature from Experiment2001, (c) simulated mean winter temperature from Control2001, (d) observed mean summer temperature, (e) simulated mean summer temperature from Experiment2001, and (f) simulated mean summer temperature from Control2001.
Download figure:
Standard image High-resolution imageBecause the limited number of stations may not adequately represent the spatial variability of temperature, particularly during summer, additional model evaluation was carried out by calculating bias and root mean square error (RMSE) between the observations and simulations (table 1). Model bias was estimated by comparing the averaged station-based observations within APTZ to the corresponding average of simulated grid cells, which were nearest to the station locations, whereas RMSE was computed to measure the discreteness between the observations and simulations. Results show that the model bias and RMSE revealed by the Experiment2001 are smaller than those revealed by the Control2001 in both seasons. Model evaluation for the Experiment2010 and Control2010 simulations further indicates improved model performance with our landscape data (see figure A.3 and table A.2).
Table 1. Model bias and root mean square error (RMSE) between the Experiment2001/Control2001 simulations and station-based observations during summer and winter.
| Summer | Winter | |||
|---|---|---|---|---|
| Bias (°C) | RMSE (°C) | Bias (°C) | RMSE (°C) | |
| Experiment2001 | +0.40 | 1.92 | +0.10 | 1.35 |
| Control2001 | +1.27 | 2.84 | −0.85 | 2.54 |
Land use and land cover change
LUCC includes changes in both land use/cover types and land surface biophysical properties. The major land use/cover changes in APTZ during 2000–2010 were conversions between cropland and grassland, and conversions between grassland and barren land (Wu et al 2013; figure 1(c) and table 2). Compared to changes in land use/cover types, changes in land surface biophysical parameters were much more remarkable (figure 3).
Table 2. Major land use and land cover changes in APTZ.
| Categories | Number of grid cells | Total areas (km2) |
|---|---|---|
| Croplands to grasslands | 648 | 16200 |
| Grasslands to croplands | 205 | 5125 |
| Barren lands to grasslands | 108 | 2700 |
| Grasslands to barren lands | 176 | 4400 |
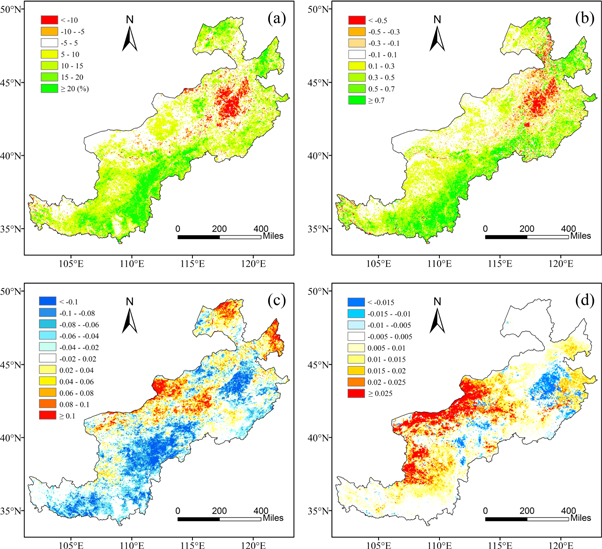
Figure 3. Spatial pattern of changes in four land surface biophysical parameters between 2001 and 2010: (a) summer vegetation fraction (%), (b) summer LAI, (c) winter albedo, and (d) winter emissivity. All the parameters were derived from remote sensing data at a spatial resolution of 5 km × 5 km.
Download figure:
Standard image High-resolution imageDuring summer, vegetation fraction and LAI increased over most regions, although this amplification was most evident for Southern portions, with vegetation fraction rising by more than 20% and LAI by more than 0.7. In contrast, both summer vegetation fraction and LAI decreased substantially in Northeastern Inner Mongolia, with vegetation fraction decreasing by more than 10% and LAI by 0.5 on average. During winter, because of vegetation defoliation, variations in vegetation fraction and LAI were generally modest. On the contrary, changes in albedo and emissivity were greater in winter than in summer. During winter, albedo decreased considerably for most parts of APTZ, with the maximum values exceeding 0.1, while patchy increases, in excess of 0.08, took place in Inner Mongolia. The decreases in albedo over the study area are mainly due to the conversion of cropland to grassland in the past decade. Decreased summer season albedo mainly occurred in the South with a range of 0.02–0.04. Unlike albedo, emissivity increased noticeably for most areas with maximum increases exceeding 0.025, while patchy decreases of more than 0.015 occurred around central and Northern areas.
Impacts of LUCC on 2 m air temperature
We use differences in summer and winter temperature between Experiment2001 and Experiment2010 (Experiment2010–Experiment2001) to estimate the potential impacts of LUCC on regional climate of APTZ. Results show that differences in land use and land cover patterns led to widespread decreases in summer temperature (figure 4(a)) and extensive increases in winter temperature (figure 4(b)). During summer, the most noticeable decreases in 2 m air temperature occurred in Southern and Northernmost regions, with a magnitude of change on the order of 1 °C, while the most noticeable increases were located in Northeastern Inner Mongolia, with local warming of lesser magnitude (generally less than 0.4 °C). Unlike the variations in summer temperature, winter temperature increased by more than 0.8 °C in parts of the South and the North, but decreased by about 0.6 °C in central and Northern APTZ.
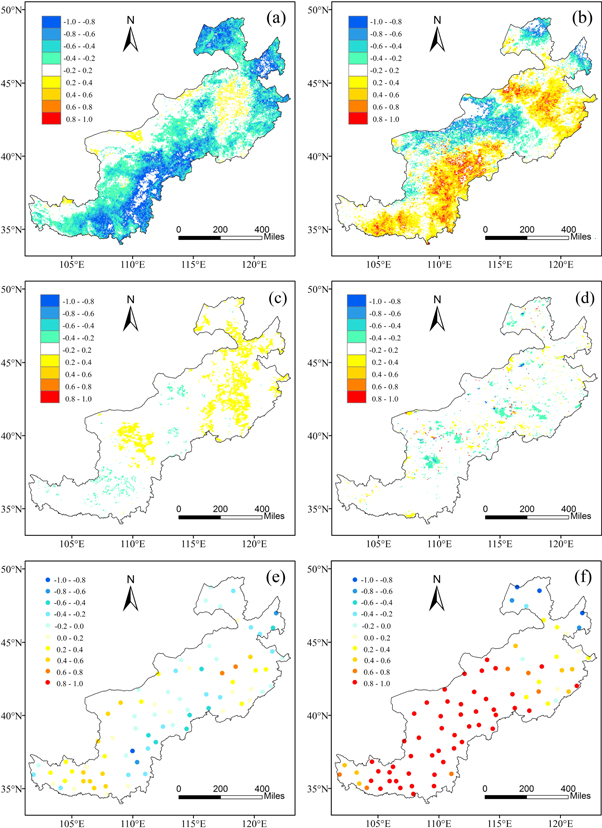
Figure 4. Simulated 2 m air temperature differences (°C) between the two Experiments (Experiment2010–Experiment2001) during summer (a) and winter (b), as compared to those between the two controls (Control2010–Control2001) during summer (c) and winter (d), and decadal trend of air temperature (°C/decade) during summer (e) and winter (f) for the period of 1999–2011 as revealed by observation minus reanalysis at stations in APTZ.
Download figure:
Standard image High-resolution imageDifferences in summer and winter temperature between the two controls (Control2010–Control2001) were comparatively smaller. Although differences in summer temperature (figure 4(c)) were more pronounced relative to winter temperature (figure 4(d)), the spatial pattern of temperature variations, showing widespread warming in Northern and central areas and patchy decreases across APTZ, differed from that revealed by the two experiments. The APTZ-averaged changes in summer, winter, and annual mean temperatures from the two controls were close to zero with insignificant variability, whereas those from the two experiments indicated evident summer and annual cooling effects (figure 5). Overall, the net effect of simulated regional climate change due to LUCC was to decrease the annual range of temperature by lowering maximum (i.e., summer season) but increasing minimum (i.e., winter season) 2 m air temperature.
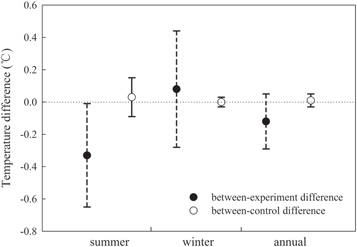
Figure 5. Summary plots of between-experiment versus between-control differences in mean 2 m air temperature (°C) over APTZ during summer, winter, and the whole year. Error bars represent one standard deviation.
Download figure:
Standard image High-resolution imageThe simulated results coincide with the OMR analyses, which also indicate non-negligible summer cooling (figure 4(e)) and widespread winter warming (figure 4(f)). During winter, 41 out of 51 stations show the same signal of temperature changes with Experiment2010–Experiment2001 over APTZ (only those exceeding 0.2 °C were retained). For the 41 stations, the correlation of temperature change between the OMR and Experiment2010–Experiment2001 is statistically significant at 99% confidence level, and the Pearson correlation coefficient, r, between the two is 0.743. Similarly, 35 out of 43 stations show the same signal of temperature changes during summer, and the r value between the two is 0.658 at 99% confidence level among the 35 stations.
Impacts of LUCC on surface energy budget
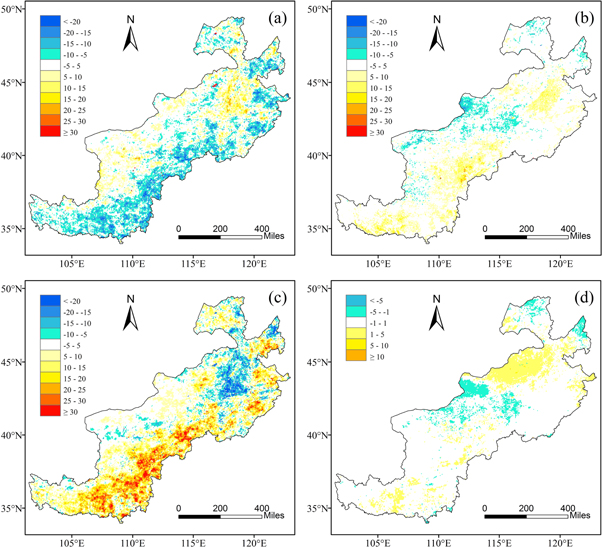
As illustrated by figure 6, simulated differences in spatial variability of net shortwave radiation and albedo displayed considerable similarity. In regions where albedo increased, the net shortwave radiation flux decreased accordingly, and vice versa. Net longwave radiation increased in the summer except over Northeastern Inner Mongolia, and decreased in winter, particularly in Southern areas. The total net radiation flux of the land surface is defined as the sum of net shortwave and longwave radiation flux. During summer, increased net radiation flux in excess of 15 W m−2 was prevalent over Southern regions, while patchy decreases of relatively smaller magnitude occurred over Northeastern Inner Mongolia. During winter, the net radiation flux decreased by about 10 W m−2 over central APTZ and increased by the same magnitude for other regions.
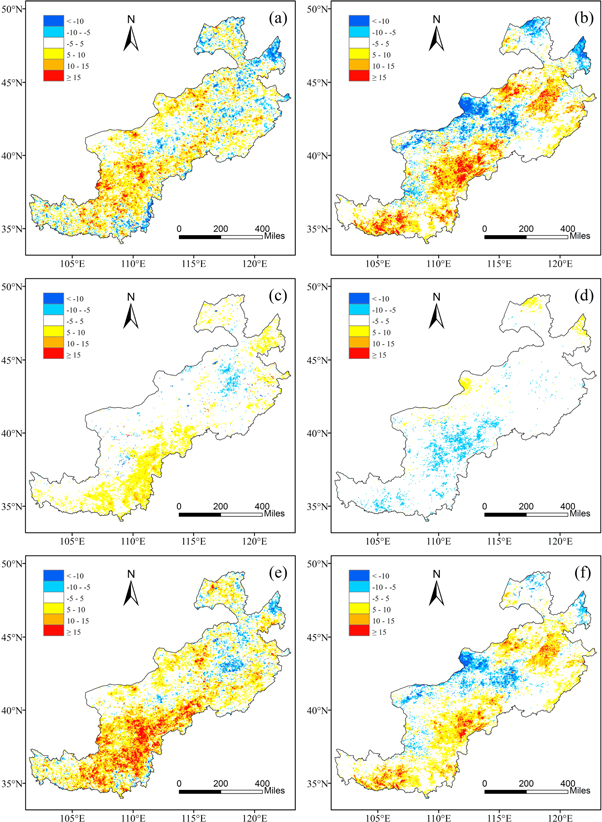
Figure 6. Spatial pattern of simulated between-experiment differences (Experiment2010–Experiment2001; W m−2) in summer and winter mean net shortwave fluxes (a) and (b), summer and winter mean net longwave fluxes (c) and (d), and summer and winter mean net radiation fluxes (e) and (f).
Download figure:
Standard image High-resolution imageVariations in surface radiation flux resulted in differences in surface energy budget (figure 7), which drive the changes in the 2 m air temperature presented earlier. During summer, in Southwestern APTZ, sensible heat flux decreased by about 15 W m−2 on average with local maximum decreases reaching 25 W m−2, whereas latent heat flux increased by more than 25 W m−2 with local maximum increases approaching 35 W m−2. Opposite changes were found in Northeastern Inner Mongolia: increases in sensible heat flux and decreases in latent heat flux exceeding, in absolute value terms, 10 W m−2. During winter, changes in sensible heat flux were reduced relative to summer, whereas latent heat flux impacts were too small to be detected. The spatial variations of sensible heat flux match those of net radiation quite well (figures 6(f) and 7(b)).
Figure 7. Spatial pattern of simulated between-experiment differences (Experiment2010–Experiment2001; W m−2) in mean surface sensible heat fluxes during summer (a) and winter (b), and surface latent heat fluxes during summer (c) and winter (d). Note that the scaling schemes in the legend of (c) and (d) are different, so as to show the relatively small changes in latent heat fluxes during winter.
Download figure:
Standard image High-resolution image
Discussion and conclusions
Impacts of LUCC on 2 m air temperature and heat fluxes
Our results show that LUCC between 2001 and 2010 considerably affected the 2 m air temperature of APTZ, via alterations of land surface biophysical parameters (the parameters we examined include: vegetation fraction, LAI, albedo, and emissivity). Results demonstrate changes in landscape patterns lowered the summer temperature but raised the winter temperature, through modification of the net radiation and surface energy budget. During summer, although the reduced albedo led to rising net radiation, increases in vegetation fraction and LAI substantially affected the partitioning of available radiation into latent heat flux, thus decreasing the Bowen ratio (i.e., the ratio of sensible to latent heating) with additional consequences for near-surface cooling. However, the increases in wintertime net radiation, while smaller in magnitude compared to summer, contributed mainly to changes in sensible heat flux because of vegetation defoliation. This effect led to an increasing Bowen ratio, and therefore, near-surface warming.
Our results provide valuable information for landscape planning to mitigate and adapt to climate change, particularly in arid and semiarid regions such as APTZ, whose environmental and socioeconomic conditions are sensitive to climate change. Generally, vegetation recovery due to the Grain to Green Program in Southern APTZ led to overall cooling effects, whereas grassland degradation in Inner Mongolia, largely due to overgrazing in the past decade (Wu et al 2015), resulted in an overall near-surface warming. Compared to grassland and cropland, however, changes in vegetation fraction and albedo are minor over the woody areas, thus leading to less pronounced temperature changes in both seasons. This suggests that replacement of grassland by woody plants in arid and semiarid regions where the environmental conditions restrict the growth of woody plants may not be a rational choice for land system planning in terms of climate mitigation and adaptation.
Improved characterization of WRF-default biophysical parameters
Our study has demonstrated that using the default biophysical parameters prescribed by WRF-Noah LSM, as shown by the two controls, failed to accurately capture the actual effects of LUCC on regional climate. Obviously, the output of any modeling system will be sensitive to changes in biophysical parameters, such as vegetation fraction, LAI, albedo, and emissivity. Because of strong effects of seasonality, vegetation phenology changes in both time and space, and these changes affect vegetation fraction, LAI, albedo, and emissivity. The default parameter set did not consider these changes, and was based on a coarse-grained land use classification in which each land use type may include multiple distinct land cover types with substantially different biophysical properties.
As a result, the model underestimated changes in the amount and spatial heterogeneity of land use and land cover and associated land surface properties, further leading to incorrect partitioning of available energy between sensible and latent heat fluxes, and consequently prediction of changes in temperature of reduced skill in our study region. The discrepancies between the control and experimental simulations indicate that the composition and configuration of local landscapes must be explicitly considered in assessing the impacts of LUCC on climate at regional and larger spatial scales (Pielke and Avissar 1990, Raupach 1991, Pielke and Niyogi 2010) for seasonal or longer time scale simulations.
Limitations and future research
Our study provides the first comprehensive assessment of impacts of LUCC on the spatiotemporal pattern of temperature in the extensive agricultural-pastoral transitional zone of North China. However, several aspects of the study can, and will be improved in future work. First, although our study demonstrates that spatial patterns of local landscapes may substantially affect the simulation results of WRF, it is not clear how much spatial detail of the landscape should be incorporated for studies of complex dynamic land mosaics such as APTZ. In other words, how small should the grid cell be for execution of the WRF model—or other similar modeling systems—in such studies and what value can be attained via the utility of, for example, a mosaic approach that accounts for sub-grid variability (e.g., Li et al 2013)? Second, comprehensive sensitivity analysis of WRF is needed to quantify changes in model output with respect to changes in the spatial and thematic resolutions of the input land use and land cover maps. Due to limitations of data and computational resources, our study only considered landscape patterns in two separate years (2001 and 2010), and our findings need to be further confirmed by future research that considers more years and longer time horizons (e.g., decadal timescales or longer). With improving computing capacities and data sets, efforts are underway to address these issues.
Acknowledgments
This work was supported by the National Basic Research Program of China (973 Program) under Grant 2014CB954301 and the Fund for Creative Research Groups of National Natural Science Foundation of China under Grant 41321001. MG was supported by NSF under Grant EAR-1204774.