

Abstract
While wind power is a low-carbon renewable energy technology with relatively little land footprint, the necessary infrastructure expansion still has land-related environmental impacts. Brazil has seen more than a ten-fold increase in wind power capacity in the last decade. However, little is known about these impacts of wind power generation in Brazil compared to other world regions, although Brazilian wind power infrastructure is concentrated in the least protected ecosystems that are prone to degradation, desertification and species extinction. This study focuses on land-use impacts of past wind power generation development in four Brazilian federal states, covering 80% of the country's installed capacity. We assessed their spatial installation patterns, associated land-use and land cover change in the period before installation until 2018, and potential alternative installation locations, using a detailed wind turbine location database in combination with a high-resolution land-use and land cover map. In contrast to wind parks built in Europe, we found that 62% of the studied wind park area was covered by native vegetation and coastal sands. Overall, 3.2% of the total wind cluster area was converted from native vegetation to anthropogenic use. Wind parks installed mainly on native vegetation, on average, underwent higher land-use change compared to other wind parks. As Brazil intends to more than double its current wind power capacities by 2029, we explored possibilities to reduce environmental risks due to wind power expansion. We showed that this is feasible by integrating wind parks into human-altered areas, as sufficient wind resources there are available.
Export citation and abstract BibTeX RIS

Original content from this work may be used under the terms of the Creative Commons Attribution 4.0 license. Any further distribution of this work must maintain attribution to the author(s) and the title of the work, journal citation and DOI.
1. Introduction
Wind power has developed dynamically in recent years, notably in Brazil [1]. There, the installed capacity has increased drastically from 0.03 GW in 2005 to 14.4 GW in 2019 [2]. Wind energy became the second largest source for electricity generation after hydropower i.e. 8.9% of electric in 2019 energy came from wind [2]. Historically, wind power deployment was concentrated in the Northeast and South regions of Brazil. Future expansion is expected to occur in the same regions and reach 39.5 GW by 2029 [3]. Wind power expansion is known to be crucial for supporting climate change mitigation efforts [1, 4], also considering that its expected land requirements—the land area necessary to generate a unit of power [5–11]—are lower compared to other renewable technologies such as solar photovoltaics, hydropower, and bioenergy, as shown by existing work on future global- or country-scale energy systems [12–15].
However, the focus on land requirements only does not account for all land-use impacts of wind power infrastructure. Studying a greater variety of impacts is necessary to ensure the deployment of sustainable energy systems [16, 17]. In various countries, case studies at the facility level found natural vegetation removal, habitat fragmentation, ecosystem disturbance, and threats to terrestrial wildlife, to be among the land-use impacts that accompanied onshore wind power expansion [18–25]. In addition, infrastructure expansion is known to affect the ecosystems beyond the directly occupied area and to facilitate further conversion of natural vegetation [26–29]. Capturing such impacts on a large spatial scale is not feasible by estimating solely the land requirements of wind power generation.
Several research approaches have been developed to investigate these land-use impacts on a large spatial scale beyond estimating land requirements only. Among those, existing wind parks in the US have been assessed in terms of which land cover or natural habitat prevails on the land area occupied by the infrastructure [5, 12, 30, 31]. Another approach—applied both at the scale of a single biome (Caatinga, Brazil) and globally—evaluated the overlap between conservation areas and existing wind power infrastructure to assess its biodiversity impacts [32, 33]. However, the former approach does not capture the effects of wind power infrastructure beyond the directly occupied area, whereas the latter limits assessments of land-use impacts to conservation areas.
Moreover, regardless of the approach, the number of studies on land-use impacts related to wind power in Brazil is quite low compared to other world regions [34, 35]. As the negative environmental impacts reported by qualitative research for individual wind parks are significant [20, 36–38], comprehensively assessing them is of high importance, especially considering that past and future wind power expansion occurs in states with climatically vulnerable and comparably less protected ecosystems [39–41]. In particular, Caatinga—the biome with the highest number of wind parks—is prone to degradation, desertification and extinction of several endemic species of flora and fauna [42].
Here, we extend the existing knowledge on land-use impacts of wind power generation, first, by expanding the spatial land-use and land cover analysis of the existing wind power infrastructure beyond estimating directly occupied land and assessing conservation areas only, and, second, by doing so for all wind parks installed until 2018 in four federal states of Brazil: Bahia, Ceará, Rio Grande do Norte, and Rio Grande do Sul, which cover 80% of total installed capacity.
We determined the land-use and land cover installation patterns of wind parks by integrating their location [43], and the surrounding area with land-use and land cover maps, considering the installation period. In particular, we used a cutting-edge annual land-use and land cover map developed for Brazil which has an annual temporal resolution and a particularly high spatial resolution of 30 × 30 m [44, 45]. In addition, we estimated the cumulative land-use and land cover change (LUCC) that occurred after installation of the wind parks. As we found a significant proportion of wind parks installed on native vegetation and dunes, we also assessed whether alternative locations that are already largely influenced by human activity would have been available for deployment instead. To do so, we estimated the wind resources necessary for the future wind parks based on average wind power densities [46] of the built wind parks and quantified the area of more intensively human-altered land that has similar wind resources.
2. Data and methods
Our research focuses on four federal states of Brazil, where 80% of all national onshore wind parks are installed, i.e. Rio Grande do Norte (Caatinga & Mata Atlântica biomes), Bahia (Caatinga & Mata Atlântica biomes), Ceará (Caatinga biome), and Rio Grande do Sul (Mata Atlântica & Pampa biomes). On the temporal scale, we analyzed wind parks that were installed until 2018. The data sets used for this study are listed in table 1. All data sets are public and free to download.
Table 1. Used datasets.
| Source | Data | Spatial resolution | Temporal resolution |
|---|---|---|---|
| Brazilian Annual Land-Use and Land Cover Mapping Project (MapBiomas) [44, 45] | Annual land-use & land cover raster maps | 30 m × 30 m | Annual (1996–2018) |
| Georeferenced information system for the electricity sector by the Brazilian Electricity Regulatory Agency (ANEEL) [43] | Wind turbines: wind park registration code, location & installed capacity Wind parks: commissioning date, operational status | Points | Annual (1998–2018) |
| Global Wind Atlas (GWA) [46] | Mean power density at 100 m height | 1 km × 1 km | 10 year average (2008–2017) |
| Brazilian Institute of Geography and Statistics (IBGE) [47] | State boundaries | Polygons | — |
2.1. Land-use and land cover classification
Distinguishing between different levels of human impact on land is central to this study. As the comparably small size of wind power infrastructure requires high spatial resolution and time series are necessary to understand the dynamic impacts of wind power expansion, we opted for an approach that has limited diversity of qualitative indicators but provided the necessary resolution. We therefore aggregated the MapBiomas land-use and land cover classification [44] into three major classes i.e. native vegetation, anthropogenic land, and coastal sands (S1). To assess the installation patterns of historical wind power deployment, we considered land-use and land cover for each wind cluster two years prior to its commissioning date, as provided by ANEEL [43]. The type of the wind cluster is described in terms of its dominant land-use and land cover class two years prior to the commissioning year. Hence, we distinguish wind clusters built mainly on (a) native vegetation (NatVeg), (b) anthropogenic land (AnthLd), and (c) coastal sands (Coast). In section S2 of the supplementary material (available online at stacks.iop.org/ERL/16/024010/mmedia), our classification is discussed in detail and compared to the human footprint index. Section S8 shows how the assumption on the starting year for the analysis affect land-use change estimates.
Land covered with native vegetation and dunes is prone to conversion to more intense land-use, and this, consequently, increases the risk for these lands in terms of ecosystem disturbances, natural habitat fragmentation, biodiversity loss and other ecological risks [48]. Hence, we refer to native vegetation and coastal sands as environmentally vulnerable land. The share of vulnerable land per wind cluster was estimated as the sum of native vegetation and coastal sands relative to the total area for each wind cluster and its deployment region. The estimation of land conversion is explained in the supplementary material (S3).
2.2. Wind cluster boundaries and their deployment region
For this study, we selected wind parks that were built up to 2018 and which are currently in operation. The polygons of wind park boundaries, reported by ANEEL, cover the area that legally belongs to the wind parks. However, in some cases, this area extends far beyond the location of the wind turbines (S4, figure SF3). This may lead to a misinterpretation of installation patterns for such wind parks. Hence, wind park boundaries were defined as the convex hull of all wind turbine locations that belong to the same park (figure 1(a)).
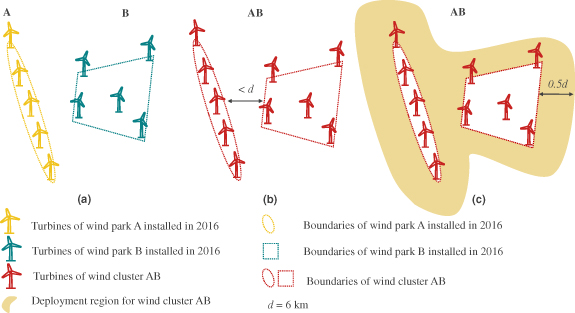
Figure 1. Schematic explanation for creating (a) polygons of wind park boundaries, (b) wind cluster multipolygons, and (c) deployment region polygons.
Download figure:
Standard image High-resolution imageInstallation patterns were analyzed on two spatial scales: wind cluster and deployment region. Wind clusters indicate spatial concentration of the wind parks and prevent double counting of the area for wind parks with overlapping boundaries. The polygons of wind parks built in the same year were joined into wind clusters based on the distance between them. The minimum distance between two wind clusters is 6 km (figure 1(b) and section S5). The deployment region is used to describe land-use patterns of areas in the neighborhood of the wind cluster area. The deployment region refers to the area within the 3 km buffer around the wind cluster, excluding the cluster itself (figure 1(c)). This buffer radius, that is equal to half of the minimum distance between two wind clusters, prevents overlapping between deployment regions.
2.3. Alternative locations for future wind power deployment
Here, we suggest that wind power deployment could be fully integrated with already human-altered lands in order to prevent further conversion of environmentally vulnerable areas. We examined the basic feasibility of this approach by assessing whether such land, in theory, has sufficient wind resources to be considered for accommodating wind parks. To do so, we used wind power density as a parameter to determine the wind resources required for operating a wind park. Of course, power density on its own is not a sufficient condition to determine the suitability of land for wind park installations, but it is a necessary one. For that purpose, we extracted the average power density for each existing wind cluster polygon from the GWA [46] and derived a distribution of these power densities for all wind clusters in a state (S6, figure SF4). We assume that wind parks need a minimum power density equal to or larger than the 1st quartile of the observed power density distribution in existing wind parks (S6). Thus, the 1st quartile defines a threshold for the necessary minimum level of wind resources. We consider the 1st quartile to be a conservative estimate, as 25% of locations have even lower wind speeds and wind parks were still built there. Also, future technological developments may shift wind power development to locations with even lower power densities. Nevertheless, in the supplementary material S6, we assessed how our choice of the threshold affects the estimated area of anthropogenic land with sufficient wind resources. By overlapping the raster data from the GWA, which fulfill the threshold, with the land-use and land cover map for 2018, we determined the area of anthropogenic land that, in principle, would comply with minimum wind resource requirements for a wind park. We derived two scenarios: in the first scenario (scenario I), we used the threshold found for each state to estimate the area of eligible anthropogenic land; in a second scenario (scenario II), we applied the threshold, which is the 1st quartile of the power density distribution of all wind clusters in the four states, uniformly to all states (table 2). In supplementary material S6, we assessed in a sensitivity analysis how our choice affects the estimated area of anthropogenic land with sufficient wind resources. As that difference in thresholds among the states is due to availability of wind resources as well as techno-economic conditions, scenario I assumes that these conditions remain as distinct across the states as earlier. In contrast, scenario II, assumes that these conditions are homogeneous across the states.
Table 2. Thresholds for minimum necessary wind power density in each scenario. The values per state refer to the thresholds applied in scenario I. The threshold defined for scenario II is applied uniformly to all states.
| Scenario | Description | Bahia | Ceará | Rio Grande do Norte | Rio Grande do Sul |
|---|---|---|---|---|---|
| Scenario I | Minimum necessary power density (1st quartile of the state's distribution), W m−2 | 604 | 296 | 367 | 351 |
| Scenario II | Minimum necessary power density (1st quartile of overall distribution), W m−2 | 368 | |||
The code used to produce results presented in this study is available at https://github.com/olga-turkovska/wind-land-brazil.
3. Results
According to ANEEL, the first wind park in Brazil (Ceará state) was deployed in 1998 [43]. Over the 14 year period between the installation of the first park and 2011, wind power did not considerably expand in most Brazilian states (table 3). However, this changed after 2011, when the four states in our analysis reached a total installed capacity of 11.2 GW in 2018 [43]. Our clustering approach indicates spatio-temporal concentration of the wind parks i.e. on average there are 3.4 wind parks per cluster within a distance of less than 6 km built in the same year. Half of the installed wind clusters are NatVeg (64 clusters). The rest of the wind clusters are split between AnthLd (30%) and Coast (20%).
Table 3. Historical wind power deployment for the case-study region. Based on [43].
| Bahia | Ceará | Rio Grande do Norte | Rio Grande do Sul | Total in four states | |
|---|---|---|---|---|---|
| First wind park, year | 2012 | 1998 | 2006 | 2006 | 1998 |
| Peak of installations, year | 2018 | 2014 | 2016 | 2015 | 2014 |
| Installed capacity (2011), GW | 0 | 0.5 | 0.3 | 0.3 | 1.1 |
| Installed capacity (2018), GW | 3.5 | 2 | 3.9 | 1.8 | 11.2 |
| Number of turbines | 1 703 | 997 | 1 946 | 829 | 5 475 |
| Number of parks | 132 | 78 | 142 | 80 | 432 |
| Total number of clusters | 34 | 33 | 34 | 27 | 128 |
| Number of NatVeg clusters | 29 | 5 | 16 | 14 | 64 |
| Number of AnthLd clusters | 5 | 10 | 11 | 12 | 38 |
| Number of Coast clusters | 0 | 18 | 7 | 1 | 26 |
3.1. Land-use and land cover installation patterns of wind power expansion in Brazil
We assessed the share of vulnerable land within the wind cluster (x-axis) and its deployment region (y-axis) in figures 2(a)–(d). In the four states, 90 of 128 clusters were built on predominantly vulnerable land. Native vegetation covered 52% of the total wind cluster area, coastal sand covered around 10%, and anthropogenic land covered 38%. In total, therefore, wind clusters were deployed to a larger extent on vulnerable than on anthropogenic land.
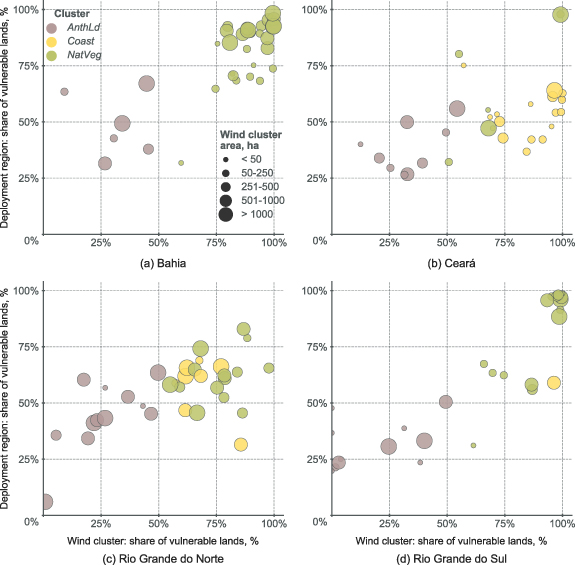
Figure 2. Land-use and land cover installation patterns for wind clusters in (a) Bahia, (b) Ceará, (c) Rio Grande do Norte, and (d) Rio Grande do Sul. Each circle represents a wind cluster where the size indicates the area (ha) of the wind cluster. The circle's color reflects the type of the wind cluster in terms of dominant land use and land cover class. The x- and y-axis show the share of vulnerable land (%) in the wind cluster and its deployment region, respectively (two years before the commissioning year).
Download figure:
Standard image High-resolution imageThe four states show quite differentiated patterns of deployment. Wind clusters in Bahia and Rio Grande do Sul were extensively installed on vulnerable land (the upper right corner in figures 2(a) and (d)) which covers more than 75% of the area in those clusters. Moreover, this applies to the respective deployment regions as well. In total, 20 out of 34 wind clusters in Bahia and nine out of 27 wind clusters in Rio Grande do Sul show this pattern, independently of their size. Ceará and Rio Grande do Norte have in total only three wind clusters that indicate such a high presence of vulnerable land on both axes.
Wind clusters in Ceará mainly occupy land along the coast. Within Coast clusters, the share of vulnerable land was above 58% of the wind cluster area (figure 2(b)). Most of those clusters were deployed in regions with a high presence of anthropogenic land. With a few exceptions, the share of anthropogenic land in the deployment regions was above 40% there. This is a consequence of coastal regions in Ceará being comparably more developed in terms of settlement and agricultural activities. The intensity of this pattern is unique to Ceará. To a smaller extent it is also present in Rio Grande do Norte, where eight wind clusters are built on the coast and in Rio Grande do Sul, where we found one similar wind cluster.
Rio Grande do Norte shows very mixed installation patterns in both the wind cluster and the deployment region (figure 2(c)). The share of vulnerable land varies between 50% and 90%, which implies the presence of more anthropogenic land in those clusters compared to Bahia and Rio Grande do Sul. The share of vulnerable land in the deployment regions of Rio Grande do Norte is lower compared to the share of vulnerable land occupied by wind clusters. With a few exceptions, the share of vulnerable land does not exceed 75% and in some cases land in the deployment regions is predominately anthropogenic for NatVeg and Coast clusters. This installation pattern is strongly present only in this state.
A minor share of the wind clusters was installed mostly on anthropogenic land. This pattern is observed in all states i.e. 18% of wind parks in Bahia, 27% in Ceará, 35% in Rio Grande do Norte, and 40% in Rio Grande do Sul. Similarly, the deployment regions of these wind clusters are characterized by land with higher anthropogenic activity i.e. at least 50%, except for some clusters in Bahia and Rio Grande do Norte. In all states, only three clusters were built exclusively on anthropogenic land. Such installation patterns clearly imply that their deployment occurred in areas with significant presence of human development. In terms of wind cluster size, five out of nine of the largest wind clusters followed this pattern.
3.2. Land-use and land cover change within wind clusters
We estimated LUCC that occurred within the wind cluster area for the period between two years prior to the commissioning and 2018. LUCC estimates include conversion that occurred during the construction phase and later on after the parks were commissioned (S8). Here, we excluded wind clusters, which were commissioned in 2018 (16 clusters).
The total net LUCC amounted to −3.2% (22 km2) of the total wind cluster area in all states i.e. indicating the net loss of native vegetation. Among all states, net native vegetation loss was detected in 65 (58%) wind clusters, while net native vegetation regrowth was observed in 33 (29%) clusters. Native vegetation areas remained unchanged in 14 (13%) wind clusters. The LUCC per wind cluster varies between −39.2% of wind cluster area, i.e. the highest native vegetation loss, and 23.5% of wind cluster area, i.e. the highest native vegetation regrowth (figure 3). In all states, native vegetation loss occurred in the majority of NatVeg wind clusters and was higher compared to other clusters. While in NatVeg wind clusters native vegetation regrowth usually did not exceed 2.5% of the wind cluster area, the regrowth in AnthLd wind clusters was mostly above 2.5% of the wind cluster area. Yet, this holds only for seven AnthLd wind clusters as vegetation loss occurred in the majority of AnthLd clusters. The wind clusters, which showed zero net LUCC were mainly Coast wind clusters in Ceará, and several AnthLd clusters in Rio Grande do Sul with share of anthropogenic land above 97% of the cluster area (S7, figure SF5). Overall, the net LUCC in NatVeg wind clusters was −6.1% (15.2 km2) of their total area, whereas in AnthLd wind clusters it was −2% (6.9 km2), and −0.3% (0.4 km2) in Coast wind clusters. However, when the LUCC is compared to the initial native vegetation area per cluster type, the difference between NatVeg and AnthLd wind clusters is reduced i.e. within those clusters, vegetation loss was −7.2% and −6.2%, respectively.
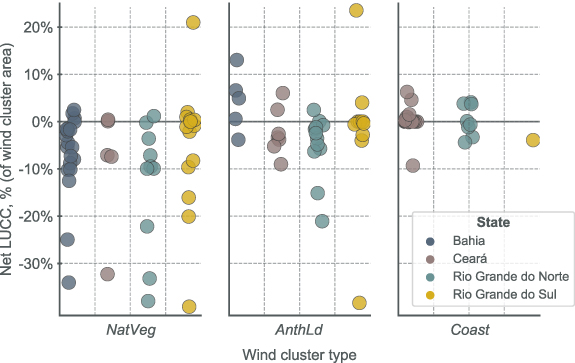
Figure 3. Difference in net LUCC among wind cluster types. The X-axis shows the type of the wind cluster. The Y-axis refers to net LUCC relative to the wind cluster area (%). Each circle corresponds to one wind cluster and its color refers to the federal state where the cluster is located. Positive values indicate native vegetation regrowth.
Download figure:
Standard image High-resolution imageOn the state level, in Ceará and Rio Grande do Norte, the native vegetation loss in the wind clusters was considerably higher than the state average loss (table 4). This difference suggests that wind power expansion in these states might have been a factor which led to additional LUCC in these areas. In contrast, in Bahia and Rio Grande do Sul, the estimates for the wind clusters and state average are fairly close. Despite the vast majority of wind clusters in Bahia showed native vegetation loss (figure 3), on the aggregated level, the total net LUCC is very low i.e. −0.1%. This is also confirmed, when normalizing LUCC by the size of the wind clusters in terms of installed generation capacity. The estimate for Bahia is much lower than those for the other states i.e. −30 m2 MW−1 (table 4). The opposite is observed for Rio Grande do Norte, where the vegetation loss is −4627 m2 MW−1. In both states, we found wind clusters that significantly shift the aggregated estimates. In Bahia, the vegetation regrowth estimated in one of the wind clusters was as high as the total vegetation regrowth in other clusters. Excluding this cluster from the estimates changed the total net LUCC to −2.1% of total wind cluster area, and the net LUCC per MW increased to −1081 m2 MW−1, which makes the estimates for Bahia more similar to those for the other states. Similarly, in Rio Grande do Norte, the vegetation loss in two clusters was as high as the total vegetation regrowth in other clusters. Hence, by excluding them, the net LUCC per MW decreased to −2848 m2 MW−1. This estimate is closer to the other states but still remains the highest among all states. This is a result of vegetation loss being quite high in most of the wind clusters in Rio Grande do Norte (figure 3). In addition to net LUCC, table ST1 in the supplementary material (S3) shows total native vegetation regrowth and loss values per state.
Table 4. Comparison of net LUCC among the four states and wind cluster types. On the temporal scale, net land conversion for wind clusters was estimated for the period between two years prior to commissioning year and 2018. Total wind cluster area excludes the area of wind clusters that were commissioned in 2018. Values in parentheses were estimated after excluding outlying clusters in Bahia and Rio Grande do Norte.
| State | Bahia | Ceará | Rio Grande do Norte | Rio Grande do Sul | Four states |
|---|---|---|---|---|---|
| State net conversion (2012–2018) relative to the state area, % | −0.2 | 0.4 | −2.3 | −2.9 | −1.0 |
| Total wind cluster area, km2 | 116 | 102 | 331 | 157 | 706 |
| Total net LUCC in the wind clusters (relative to total wind cluster area), % | −0.1 (−2.8) | −1.8 | −5.0 (−3.1) | −2.6 | −3.2 |
| Total net LUCC per MW, m2 MW−1 | −30 (−1081) | −1027 | −4627 (−2848) | −2245 | −2387 (−1912) |
| Wind cluster type | AnthLd | NatVeg | Coast | ||
| Net LUCC in the wind clusters, km2 | −6.9 | −15.2 | −0.4 | ||
| Initial area of native vegetation, km2 | 110 | 209 | 11 | ||
| Net LUCC in the wind clusters (relative to total wind cluster area), % | −6.2 | −7.3 | −3.4 | ||
3.3. Alternative wind park locations
Here, we assessed the possibility to reduce environmental risks for vulnerable land through expansion of wind power infrastructure on anthropogenic land. Both scenarios indicate that all states have enough anthropogenic land with wind resources sufficient for wind park operation. This implies that, in theory, future wind power expansion on anthropogenic land could easily accommodate a 160% increase of installed wind power capacity, as foreseen in government plans up to 2029 [3]. Assuming that business-as-usual expansion would occur only on environmentally vulnerable land and technology will not significantly change, then integration of wind power infrastructure into anthropogenic land would spare about 2150 km2 of environmentally vulnerable land from being affected.
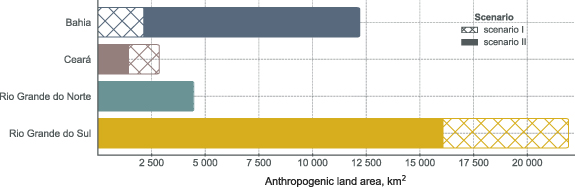
In particular, in scenario I, the estimated area of anthropogenic land is 37 times larger compared to the total area of wind parks installed before 2018. The difference is slightly larger in scenario II i.e. the estimated area of anthropogenic land is 40 times larger compared to the total area of installed wind parks. On the state scale, in Bahia, the estimated area is 11–61 times larger than the area of existing wind parks, which implies that 1%–5% of the state's anthropogenic land has a power density above the applied threshold (figure 4). Unlike the other states, Bahia has more anthropogenic land with sufficient wind resources in scenario II as the power density threshold in scenario II is considerably lower than in scenario I (table 2 in Method & Data). The estimated area of anthropogenic land in Ceará is 13–26 times larger than the area of existing wind clusters, the share of current anthropogenic land in the state with sufficient wind resources varies between 3% and 6%. As the power density threshold in scenario I for Ceará is the lowest among the state, applying the threshold in scenario II reduced the land area with sufficient resources. In Rio Grande do Norte, the thresholds in both scenarios are very close, therefore, the anthropogenic land area with sufficient resources practically does not change. In both scenarios, the estimated area of anthropogenic land with sufficient wind resources is 12 times above the area of existing wind clusters, which accounts for 17% of anthropogenic land in this state. The difference between power density thresholds in Rio Grande do Sul is rather low, however, the area of anthropogenic land with sufficient energy resources notably decreases in scenario II. Nevertheless, the estimated area is 103–140 times higher compared to the area of existing wind clusters. This implies that 12%–16% of the state's anthropogenic land has a power density above the applied threshold.
Figure 4. Anthropogenic land per state as of 2018 with sufficient wind resources for wind park installation in Bahia, Ceará, Rio Grande do Norte, and Rio Grande do Sul. The X-axis refers to the area of anthropogenic land (km2) in scenario I (crossed bars) and scenario II (filled bars). The Y-axis shows the federal state.
Download figure:
Standard image High-resolution image
4. Discussion
Our findings suggest that installation patterns of wind power differ between Brazil and known patterns in Europe, which may lead to a different outcome in terms of land-use impacts. E.g. in contrast to Austria and Denmark, where the vast majority of wind parks are located on agricultural land [31], wind power in Brazil—although, in principle, enough wind would have been available on anthropogenic land—was built mainly on environmentally vulnerable land such as savanna, grasslands, and dunes. This goes in line with a recent study that found that 47% of wind parks in the Caatinga biome, where three states studied here belong to, overlaps with high priority conservation areas [32]. In addition, studies on the scale of single wind parks in Ceará reported that wind parks installed on the coast suffered from the alteration of dunes and removal of native vegetation [20, 49] among others impacts, confirming our results. The environmental problem is further aggravated by the fact that, although environmental licensing procedures for the wind parks exist in Brazil [50], they were not mandatory for all wind parks in Bahia and Rio Grande do Sul [51]. In other cases, environmental licenses were issued despite concerns regarding the environmental impacts of the wind park, hence, putting vulnerable ecosystems at risk [52]. Development on environmentally vulnerable land and within conservation areas on one hand, and reported issues with environmental licensing of wind parks on the other hand, suggests that existing environmental regulations potentially enabled unsustainable siting of wind park. Therefore, further research should rigorously examine the role of environmental regulations in placing the wind parks into environmentally vulnerable lands and assess possibilities to improve them.
LUCC considerably varies among the wind clusters and states, this highlights the difference in terms of land-use impacts among the installation areas. Our net LUCC estimates include native vegetation regrowth, which is occurring mostly on pastures, and could indicate abandonment of these areas. Our estimate for all states i.e. 2 387 m2 MW−1 shows that actual land-use change is much higher than estimated by the natural land transformation coefficient for wind power applied in a recent life cycle analysis for South America i.e. 75 m2 MW−1 [15]. Such differences suggest that, due to the direct footprint of wind power infrastructure, wind power expansion can be accompanied by additional land-use change. Our value is fairly close to the mean land transformation of 3 000 m2 MW−1 estimated for the US wind parks, based on the environmental assessment reports [5]. Our approach provides net LUCC and focuses on native vegetation, whereas Denholm et al estimate total land transformation without distinguishing between the different land-use and land cover classes. This implies that our net LUCC value could be higher if it included the transformation of croplands, pastures, and dunes. A comparison with other studies shows a considerable gap between the assessed land-use impacts from actual wind parks and estimates that are used in studies, which project the land-use impacts of future wind power development. This implies that some of the assessments in energy transitions may be underestimating the consequences of renewable energy development.
We also explored the possibility to mitigate negative environmental implications of wind power expansion and integrate its deployment into human-altered lands. We found that negative environmental land-use impacts could be avoided or considerably reduced, given that enough wind resources are available on such lands. This agrees with other research that studied similar questions on the wind park [53], large ecosystem [54], and global scale [55]. However, the social implications of such an approach require careful examination, especially considering the 'social-gap' in wind power deployment [56, 57]. This is particularly relevant for Brazil, where the displacement of local communities and land-use conflicts due to land tenure insecurities have been widely reported in the context of wind power expansion [49, 58]. Especially in the Brazilian Northeast, this can be further exacerbated by extremely limited options for participation in planning processes of wind power siting and flaws in compensation schemes [59].
There are some methodological limitations of our analysis: firstly, the differentiation between vulnerable and anthropogenic lands relies on two factors i.e. data quality and underlying assumptions regarding the definition of those terms. To deal with the former, we have strongly aggregated land-use and land cover classes to reduce classification errors. However, some land-use classes such as pasture remain a source of uncertainty. In particular in Rio Grande do Sul natural, non-planted pastures can be falsely classified as grasslands [44], hence potentially overestimating the share of native vegetation per wind cluster for that state. To tackle the latter, we conducted a validation, which showed that our approach captures the difference between land with lower and higher anthropogenic use (S2). However, our differentiation does not imply that vulnerable land is not under human use and vice versa. Our approach is, comparably to others that estimate human impact on land [60–64], quite restricted in its qualitative depth. It nevertheless shows that human impact intensified over time through wind power expansion and simultaneous land-use change. Secondly, our analysis does not allow to establish a causal link between the estimated land-use change and wind power expansion. Further research is necessary to understand to what extent this change is caused by the installation of wind power infrastructure or other drivers.
5. Conclusions
This study reveals how wind power spatially expanded in Brazil and which land-use impacts accompanied this expansion. We showed that regions with high presence of environmentally vulnerable land were more affected by wind power development than regions with higher anthropogenic activity. Within the same state we observed that the impact varies greatly depending on the prevailing land-use of the wind park. Our findings suggest that land-use impacts can be broader and more regionally diverse than it is assumed in energy transition studies. Therefore, to acknowledge this diversity of impacts and better account for negative impacts, a more detailed representation of land-use impacts should be integrated into studies on the future development of renewables.
Our results question the sustainability of historical wind power expansion in Brazil, in terms of land-use impacts. Therefore—as Brazil foresees to more than double its installed capacity by 2029—we investigated whether current deployment practices could be improved. We demonstrated that the impacts on environmentally vulnerable land could be reduced through the integration of wind power into human-altered areas, as sufficient wind resources are available there. Future research should conduct a more advanced analysis of techno-economic conditions for wind power development on anthropogenic land, including an assessment of the trade-offs between installing renewable energy infrastructure on land with high and low anthropogenic use. Ultimately, gaining a deeper understanding of the factors that drove wind park installation on vulnerable land in the past is also a highly important research avenue to allow for more sustainable choices in the future.
Acknowledgments
We gratefully acknowledge support from the European Research Council ('reFUEL' ERC-2017-STG 758149). G.C. was financed in part by the Coordenação de Aperfeiçoamento de Pessoal de Nível Superior—Brasil (CAPES)—Finance Code 001. Open access funding provided by BOKU Vienna Open Access Publishing Fund.
Data availability statement
The data that support the findings of this study are openly available at the following URL/DOI: http://doi.org/10.5281/zenodo.4013396.